Home > Analyses > Energy > Exxon Mobil Corporation
Exxon Mobil powers modern life by fueling transportation, industry, and energy worldwide. As a titan in integrated oil and gas, it commands vast upstream reserves alongside a robust downstream and chemical portfolio. Renowned for operational scale and innovation, Exxon shapes energy markets and pioneers carbon capture technologies. Yet, with energy transition accelerating, I ask: does Exxon’s current valuation reflect its ability to sustain growth and adapt long term? This analysis explores that critical question.

Table of contents
Business Model & Company Overview
Exxon Mobil Corporation, founded in 1870 and headquartered in Irving, Texas, dominates the integrated oil and gas sector. It operates a vast ecosystem encompassing exploration, production, refining, and chemical manufacturing. With over 20,500 net operated wells and a workforce of 61K, it integrates upstream, downstream, and chemical segments to fuel global energy demand efficiently.
The company’s revenue engine balances crude oil and natural gas production with petrochemical manufacturing and carbon capture initiatives. Exxon Mobil serves key markets across the Americas, Europe, and Asia, leveraging its scale and expertise. Its competitive advantage lies in a diversified portfolio and robust operational footprint that fortifies its economic moat amid industry volatility.
Financial Performance & Fundamental Metrics
I analyze Exxon Mobil Corporation’s income statement, key financial ratios, and dividend payout policy to assess its profitability, efficiency, and shareholder returns.
Income Statement
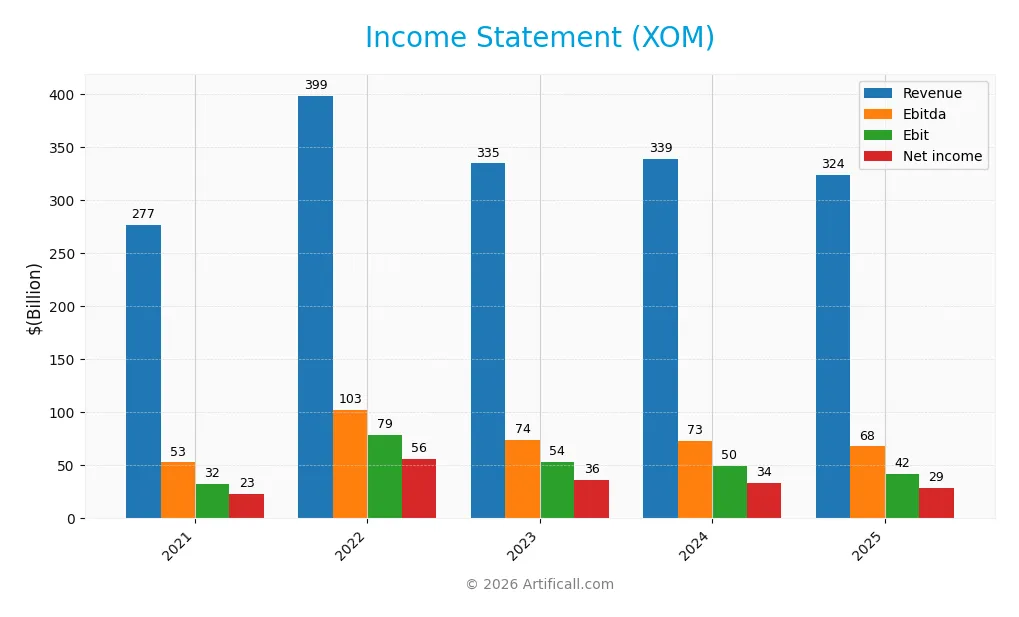
The table below presents Exxon Mobil Corporation’s key income statement figures for fiscal years 2021 through 2025, showing trends in profitability and expense management.
| 2021 | 2022 | 2023 | 2024 | 2025 | |
|---|---|---|---|---|---|
| Revenue | 277B | 399B | 335B | 339B | 324B |
| Cost of Revenue | 212B | 296B | 251B | 263B | 254B |
| Operating Expenses | 41B | 39B | 40B | 37B | 36B |
| Gross Profit | 65B | 103B | 84B | 77B | 70B |
| EBITDA | 53B | 103B | 74B | 73B | 68B |
| EBIT | 32B | 79B | 54B | 50B | 42B |
| Interest Expense | 947M | 798M | 849M | 996M | 603M |
| Net Income | 23B | 56B | 36B | 34B | 29B |
| EPS | 5.39 | 13.26 | 8.89 | 7.84 | 6.66 |
| Filing Date | 2022-02-23 | 2023-02-22 | 2024-02-28 | 2025-02-19 | 2026-02-18 |
Income Statement Evolution
Exxon Mobil’s revenue grew 17.1% from 2021 to 2025 but declined 4.5% in the last year. Net income rose 25.2% overall but fell 10.3% in 2025. Margins show mixed trends: the net margin improved 6.9% over the period but deteriorated recently, reflecting margin pressures despite generally favorable profitability ratios.
Is the Income Statement Favorable?
The 2025 income statement reveals a net margin of 8.91%, an EBIT margin of 12.93%, and a low interest expense ratio at 0.19%, all favorable fundamentals. However, recent declines in revenue, gross profit, EBIT, and EPS growth indicate emerging headwinds. Overall, the fundamentals remain favorable but show signs of recent operational challenges.
Financial Ratios
The table below presents key financial ratios for Exxon Mobil Corporation (XOM) over the last five fiscal years, providing a concise view of profitability, valuation, liquidity, leverage, and efficiency metrics:
| Ratios | 2021 | 2022 | 2023 | 2024 | 2025 |
|---|---|---|---|---|---|
| Net Margin | 8.3% | 14.0% | 10.8% | 9.9% | 8.9% |
| ROE | 13.7% | 28.6% | 17.6% | 12.8% | 11.1% |
| ROIC | 6.3% | 15.8% | 10.0% | 7.3% | 6.3% |
| P/E | 11.4 | 8.3 | 11.3 | 13.7 | 18.1 |
| P/B | 1.6 | 2.4 | 2.0 | 1.8 | 2.0 |
| Current Ratio | 1.04 | 1.41 | 1.48 | 1.31 | 1.15 |
| Quick Ratio | 0.71 | 1.06 | 1.09 | 0.97 | 0.79 |
| D/E | 0.28 | 0.21 | 0.20 | 0.16 | 0.17 |
| Debt-to-Assets | 14.1% | 11.2% | 11.0% | 9.2% | 9.7% |
| Interest Coverage | 25.4 | 80.2 | 52.4 | 39.8 | 56.3 |
| Asset Turnover | 0.82 | 1.08 | 0.89 | 0.75 | 0.72 |
| Fixed Asset Turnover | 1.28 | 1.95 | 1.56 | 1.15 | 1.08 |
| Dividend Yield | 5.7% | 3.2% | 3.7% | 3.6% | 3.3% |
Evolution of Financial Ratios
Return on Equity (ROE) showed a decline from 28.6% in 2022 to 11.1% in 2025, indicating reduced profitability. The Current Ratio gradually decreased from 1.48 in 2023 to 1.15 in 2025, suggesting tightening liquidity. Debt-to-Equity Ratio improved, falling from 0.21 in 2022 to 0.17 in 2025, reflecting a more conservative leverage stance.
Are the Financial Ratios Favorable?
In 2025, profitability metrics like net margin (8.9%) and ROE (11.1%) remain neutral, while the weighted average cost of capital (WACC) is favorable at 5.18%. Liquidity is mixed; the Current Ratio is neutral at 1.15, but the Quick Ratio is unfavorable at 0.79. Leverage ratios, including Debt-to-Equity (0.17) and Debt-to-Assets (9.7%), are favorable. Efficiency ratios are mostly neutral, and dividend yield at 3.31% is favorable, leading to a slightly favorable global ratios opinion.
Shareholder Return Policy
Exxon Mobil maintains a consistent dividend policy with a payout ratio near 60% and a yield around 3.3%. The dividend per share has steadily increased, supported by free cash flow coverage above 100%. The company also engages in share buybacks, balancing distributions with capital expenditure needs.
This approach reflects disciplined capital allocation, aligning with sustainable long-term value creation. The payout is covered prudently by operating cash flow, minimizing risks of over-distribution or excessive buybacks amid market volatility. Exxon’s policy supports stable income while preserving financial flexibility.
Score analysis
The radar chart below illustrates Exxon Mobil Corporation’s key financial scores across valuation, profitability, and leverage metrics:
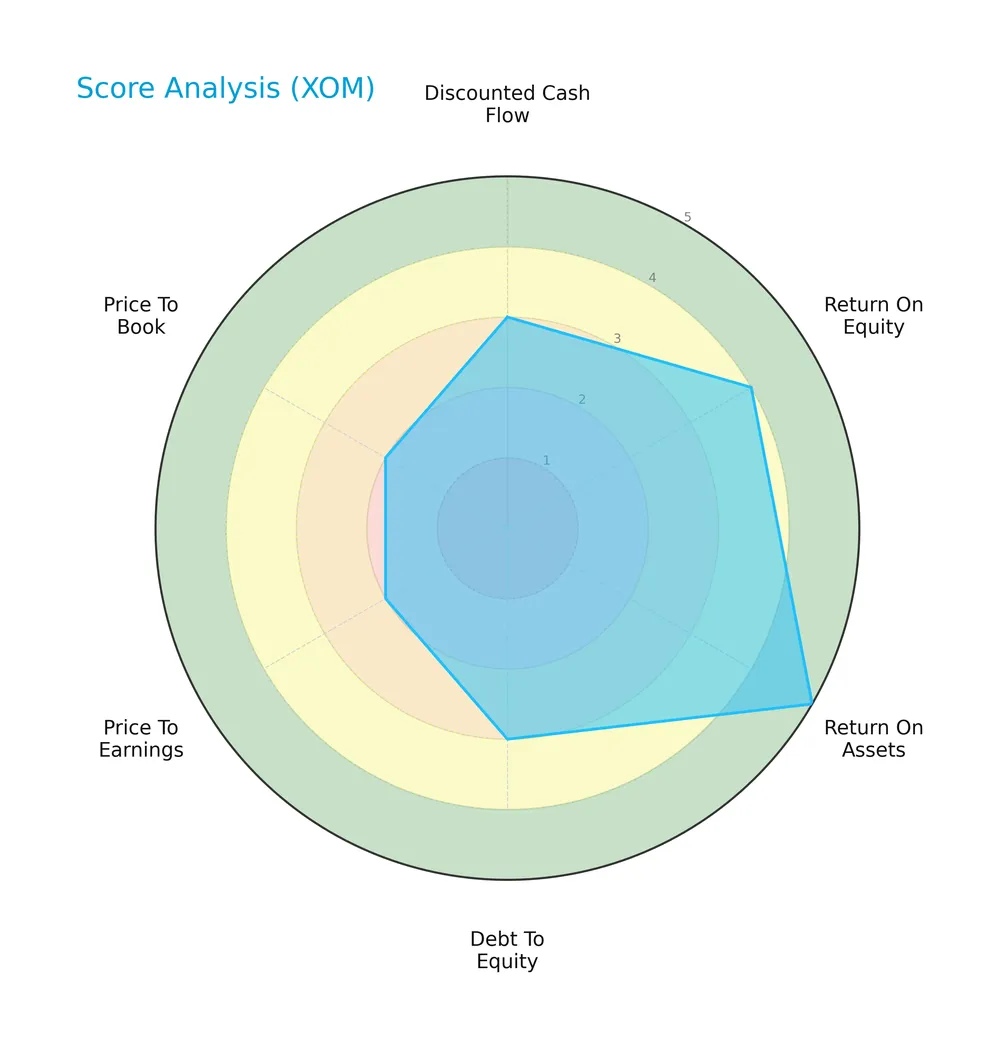
Exxon shows a very favorable return on assets (5) and a favorable return on equity (4). Its discounted cash flow and debt-to-equity scores are moderate (3). Valuation metrics, price-to-earnings and price-to-book, lag with unfavorable scores (2 each).
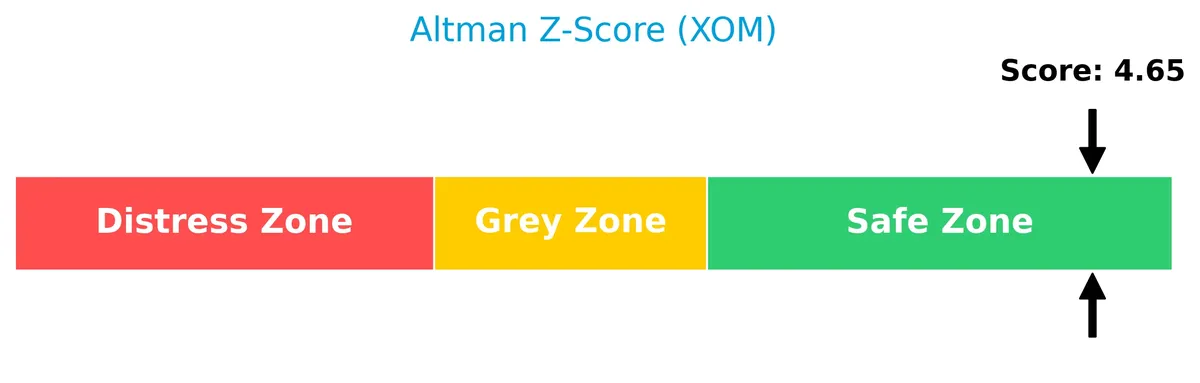
Analysis of the company’s bankruptcy risk
Exxon Mobil’s Altman Z-Score places it firmly in the safe zone, indicating low bankruptcy risk and financial stability:
Is the company in good financial health?
The Piotroski Score chart below evaluates Exxon’s financial strength based on profitability, leverage, and efficiency criteria:

With a Piotroski Score of 5, Exxon holds an average financial health status, suggesting moderate strength but room for improvement in key areas.
Competitive Landscape & Sector Positioning
This sector analysis examines Exxon Mobil Corporation’s strategic positioning, revenue by segment, key products, and main competitors. I will assess whether Exxon Mobil holds a competitive advantage over its peers.
Strategic Positioning
Exxon Mobil maintains a diversified product portfolio spanning upstream, downstream, chemical, and specialty segments. Geographically, it balances significant revenue exposure between the United States (277B in 2025) and international markets (386B), highlighting a broad global footprint within the integrated oil & gas sector.
Revenue by Segment
This pie chart illustrates Exxon Mobil Corporation’s revenue distribution across key business segments for the fiscal year 2025, highlighting their relative scale and contribution.
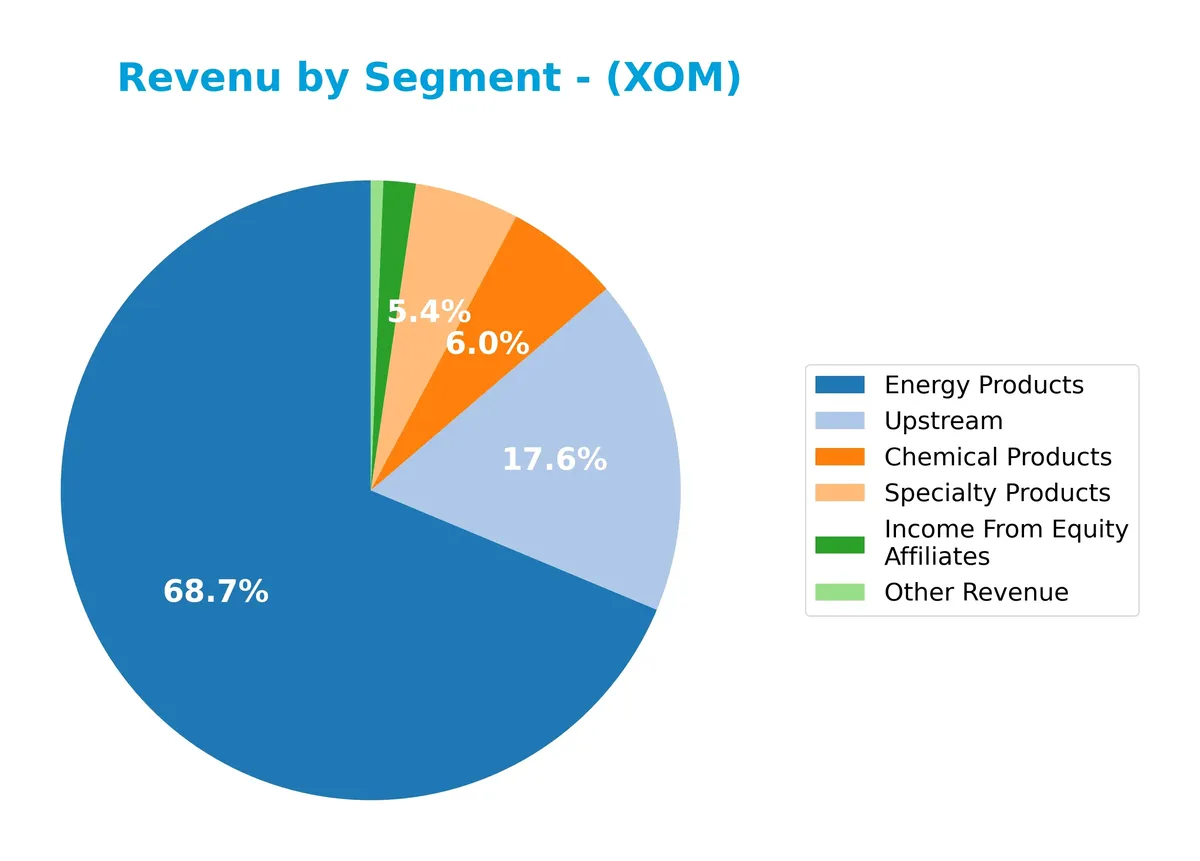
In 2025, Energy Products dominate with $218B, underscoring Exxon’s core strength in fuel and energy sales. Upstream operations contribute a substantial $56B, reflecting the company’s focus on exploration and production. Chemical Products and Specialty Products generate $19B and $17B respectively, maintaining steady diversification. Income From Equity Affiliates, at $5.3B, adds a smaller but notable income stream. The year shows concentration in Energy Products, signaling exposure to oil market volatility.
Key Products & Brands
This table summarizes Exxon Mobil Corporation’s main product lines and brand categories:
| Product | Description |
|---|---|
| Upstream | Exploration and production of crude oil and natural gas, including approximately 20,528 net operated wells. |
| Downstream | Manufacture, trade, transport, and sale of petroleum products and crude oil refining operations. |
| Chemical Products | Production and sale of petrochemicals, including olefins, polyolefins, aromatics, and other specialty chemicals. |
| Specialty Products | Manufacture and sale of specialty products related to energy and chemicals. |
| Other Revenue | Miscellaneous revenue streams not classified under main segments. |
| Income From Equity Affiliates | Earnings from investments in affiliated companies. |
Exxon Mobil’s product portfolio spans upstream oil and gas extraction, downstream refining and marketing, and chemicals. This diversified base underpins its integrated business model.
Main Competitors
There are 2 competitors in the Energy sector, with the table below showing the top 2 leaders by market capitalization:
| Competitor | Market Cap. |
|---|---|
| Exxon Mobil Corporation | 517B |
| Chevron Corporation | 312B |
Exxon Mobil Corporation ranks 1st among its competitors with a market cap 23% above the top player benchmark, reflecting its dominant scale. It sits above both the average market cap of the top 10 and the sector median. Exxon Mobil’s lead over Chevron, the next competitor, is substantial at 104%.
Comparisons with competitors
Check out how we compare the company to its competitors:
Does Exxon Mobil Corporation have a competitive advantage?
Exxon Mobil Corporation does not currently demonstrate a clear competitive advantage. Its return on invested capital (ROIC) is slightly below the weighted average cost of capital (WACC), indicating the company is shedding value, while profitability remains stable.
Looking ahead, Exxon Mobil’s operations span Upstream, Downstream, and Chemical segments, with a strong international presence and ongoing activities in carbon capture and biofuels. These areas represent potential growth opportunities as the company explores new products and markets.
SWOT Analysis
This analysis identifies key internal and external factors shaping Exxon Mobil Corporation’s strategic positioning.
Strengths
- strong global market presence
- robust dividend yield of 3.31%
- low debt-to-assets ratio at 9.7%
Weaknesses
- recent 1-year revenue decline of 4.5%
- quick ratio below 1 (0.79) signals liquidity risk
- neutral moat with ROIC close to WACC
Opportunities
- expansion in carbon capture and biofuels
- increasing non-US revenue growth
- growing energy demand in emerging markets
Threats
- volatile oil prices
- regulatory pressures on fossil fuels
- intensifying competition from renewables
Exxon Mobil’s strengths in market reach and financial stability support resilience. However, recent growth weakness and liquidity concerns require cautious capital allocation. The company must leverage clean energy opportunities while managing commodity and regulatory risks.
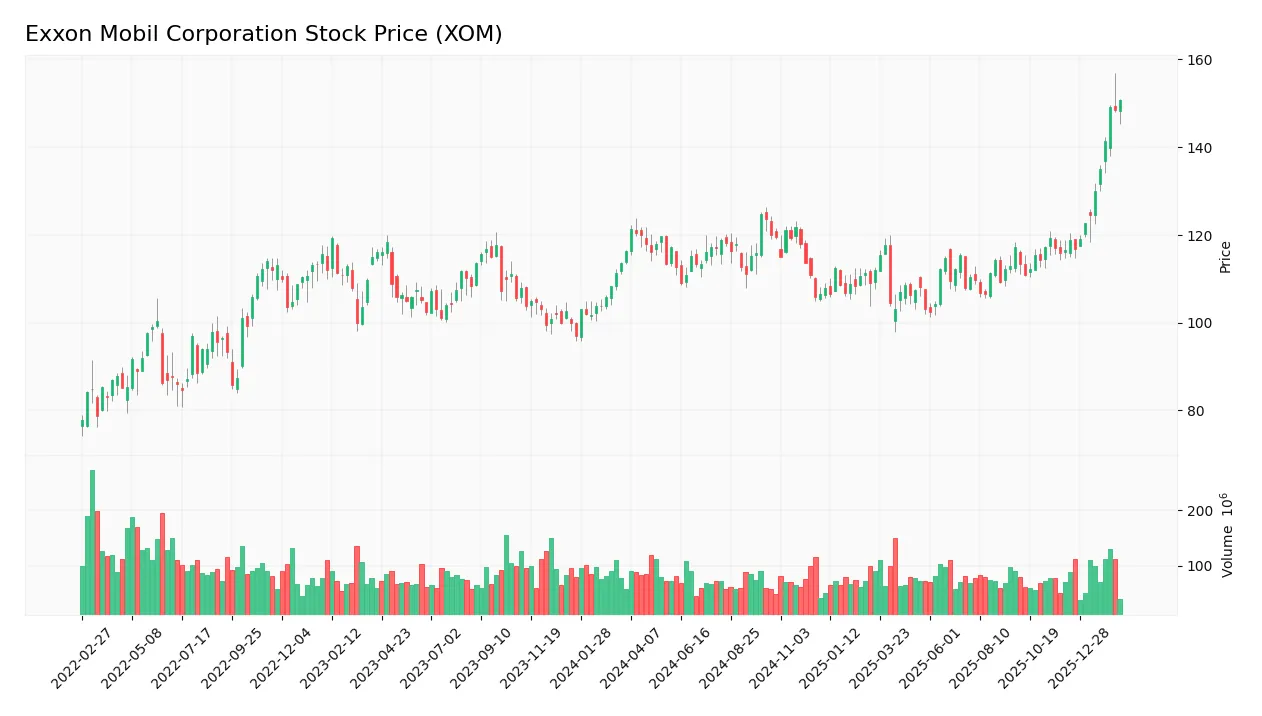
Stock Price Action Analysis
The weekly stock chart over the past 12 months shows a strong upward price movement with notable volatility and accelerating momentum:
Trend Analysis
Over the past 12 months, the stock price increased by 29.63%, indicating a bullish trend with acceleration. The price ranged from a low of 102.3 to a high of 150.68, supported by a volatility measure of 8.72%.
Volume Analysis
Over the last three months, trading volume shows a decreasing trend despite strong buyer dominance at 78.38%. This suggests investor sentiment remains positive but market participation is tapering off.
Target Prices
Analysts set a target consensus that indicates moderate upside potential for Exxon Mobil Corporation.
| Target Low | Target High | Consensus |
|---|---|---|
| 123 | 171 | 144.85 |
The target range from 123 to 171 reflects cautious optimism, with the consensus price suggesting a roughly 10-15% upside from current levels.

Don’t Let Luck Decide Your Entry Point
Optimize your entry points with our advanced ProRealTime indicators. You’ll get efficient buy signals with precise price targets for maximum performance. Start outperforming now!
Analyst & Consumer Opinions
This section reviews Exxon Mobil Corporation’s analyst ratings and consumer feedback to provide a balanced perspective.
Stock Grades
Here are the latest verified stock grades for Exxon Mobil Corporation from leading financial institutions:
| Grading Company | Action | New Grade | Date |
|---|---|---|---|
| TD Cowen | Maintain | Buy | 2026-02-03 |
| Barclays | Maintain | Overweight | 2026-02-03 |
| Wells Fargo | Maintain | Overweight | 2026-02-02 |
| RBC Capital | Maintain | Sector Perform | 2026-02-02 |
| B of A Securities | Maintain | Neutral | 2026-01-28 |
| Morgan Stanley | Maintain | Overweight | 2026-01-23 |
| Barclays | Maintain | Overweight | 2026-01-21 |
| Piper Sandler | Maintain | Overweight | 2026-01-08 |
| Freedom Capital Markets | Downgrade | Sell | 2026-01-06 |
| Bernstein | Maintain | Outperform | 2026-01-05 |
Most analysts maintain positive views, favoring “Buy” or “Overweight” ratings. Only one recent downgrade to “Sell” stands out, showing some divergence but overall steady confidence in the stock.
Consumer Opinions
Exxon Mobil Corporation enjoys a mixed but generally favorable consumer sentiment, reflecting its strong brand presence and operational scale.
| Positive Reviews | Negative Reviews |
|---|---|
| Reliable fuel quality and widespread availability. | Pricing often higher than competitors. |
| Strong commitment to sustainability initiatives. | Customer service can be slow and unresponsive. |
| Consistent performance in energy supply. | Limited innovation in retail experience. |
Consumers appreciate Exxon Mobil’s dependable products and environmental efforts. However, pricing and customer service remain notable pain points.
Risk Analysis
Below is a summary table highlighting key risks Exxon Mobil Corporation faces, with their likelihood and potential impact:
| Category | Description | Probability | Impact |
|---|---|---|---|
| Commodity Price | Volatility in oil and gas prices can sharply affect earnings. | High | High |
| Regulatory | Stricter environmental laws may increase compliance costs. | Medium | Medium |
| Liquidity | Quick ratio at 0.79 signals some short-term liquidity pressure. | Medium | Medium |
| Market Demand | Transition to renewables may reduce fossil fuel demand long-term. | Medium | High |
| Geopolitical | Global conflicts can disrupt supply chains and market access. | Low | High |
Exxon’s greatest risks are commodity price swings and long-term demand shifts due to energy transition. The company’s strong balance sheet and low debt mitigate financial distress risk despite a suboptimal quick ratio. Regulatory shifts require close monitoring as they could pressure margins.
Should You Buy Exxon Mobil Corporation?
Exxon Mobil appears to be a robust company with stable profitability but a neutral competitive moat suggesting limited durable advantage. Its leverage profile seems manageable, supported by a safe-zone Altman Z-Score and a B+ overall rating, indicating moderate financial health.
Strength & Efficiency Pillars
Exxon Mobil Corporation maintains solid operational efficiency, with a net margin of 8.91% and a return on equity (ROE) of 11.12%. Its return on invested capital (ROIC) stands at 6.34%, comfortably above the weighted average cost of capital (WACC) at 5.18%, marking the company as a value creator. Interest coverage is notably strong at 69.44, underscoring robust earnings relative to debt costs. These metrics reflect a stable profitability profile amid a competitive sector.
Weaknesses and Drawbacks
While Exxon Mobil shows operational strength, its valuation metrics offer caution. The price-to-earnings (P/E) ratio of 18.07 and price-to-book (P/B) ratio of 2.01 are neutral but could signal limited upside compared to sector averages. The quick ratio is weak at 0.79, suggesting potential liquidity constraints under short-term stress. Additionally, a moderate debt-to-equity ratio of 0.17, though favorable, requires monitoring in volatile commodity markets where cash flow can fluctuate.
Our Final Verdict about Exxon Mobil Corporation
Exxon Mobil presents a fundamentally sound profile with a safe Altman Z-Score of 4.65, indicating low bankruptcy risk. The stock’s bullish trend and strong buyer dominance, with 78.38% buyer volume recently, suggest growing investor interest. However, neutral valuation and liquidity metrics mean that while the profile may appear attractive for long-term exposure, a cautious, watchful approach could be prudent for new entrants.
Disclaimer: This content is for informational purposes only and does not constitute financial, investment, or other professional advice. Investing in financial markets involves a significant risk of loss, and past performance is not indicative of future results.
Additional Resources
- ExxonMobil to Speak at Morgan Stanley Energy & Power Conference – Exxon Mobil Corporation (Feb 17, 2026)
- Exxon Mobil Corporation (XOM) is Attracting Investor Attention: Here is What You Should Know – Yahoo Finance (Feb 16, 2026)
- Exxon Mobil (NYSE:XOM) Trading Up 3% – Here’s What Happened – MarketBeat (Feb 18, 2026)
- Decoding Exxon Mobil Corp (XOM): A Strategic SWOT Insight – GuruFocus (Feb 19, 2026)
- How ExxonMobil Makes Money – Investopedia (Feb 14, 2026)
For more information about Exxon Mobil Corporation, please visit the official website: corporate.exxonmobil.com