Home > Analyses > Industrials > Expeditors International of Washington, Inc.
Expeditors International of Washington, Inc. orchestrates the flow of goods that underpin global commerce. This logistics powerhouse excels in integrated freight solutions across continents, from air and ocean freight to customs brokerage and supply chain optimization. Renowned for precision and innovation, Expeditors serves major retailers, tech firms, and manufacturers alike. As supply chains evolve, I ask: does Expeditors’ robust business model still command a premium valuation and growth outlook in 2026?

Table of contents
Business Model & Company Overview
Expeditors International of Washington, Inc., founded in 1979 and headquartered in Seattle, WA, commands a leading position in the integrated freight and logistics sector. Its comprehensive ecosystem spans air, ocean, and ground transportation, coupled with customs brokerage and supply chain solutions. This cohesive approach serves diverse industries, from electronics to manufacturing, making Expeditors a critical link in global trade networks.
The company’s revenue engine balances freight consolidation, forwarding services, and ancillary offerings like cargo insurance and compliance consulting. Its footprint extends across the Americas, Europe, Asia, and beyond, reinforcing a competitive advantage through global reach and operational agility. Expeditors’ robust network and service integration create a formidable economic moat, shaping the future of international logistics.
Financial Performance & Fundamental Metrics
I will analyze Expeditors International of Washington, Inc.’s income statement, key financial ratios, and dividend payout policy to assess its core financial health and shareholder value.
Income Statement
The following table presents Expeditors International of Washington, Inc.’s key income statement figures for the fiscal years 2021 through 2025 in USD.

| 2021 | 2022 | 2023 | 2024 | 2025 | |
|---|---|---|---|---|---|
| Revenue | 16.5B | 17.1B | 9.3B | 10.6B | 11.1B |
| Cost of Revenue | 14.4B | 14.9B | 8.1B | 9.3B | 9.4B |
| Operating Expenses | 256M | 347M | 306M | 308M | 642M |
| Gross Profit | 2.2B | 2.2B | 1.2B | 1.3B | 1.7B |
| EBITDA | 2.0B | 1.9B | 1.0B | 1.1B | 1.2B |
| EBIT | 1.9B | 1.8B | 0.9B | 1.0B | 1.1B |
| Interest Expense | 0.4M | 23M | 4.8M | 0 | 0 |
| Net Income | 1.4B | 1.4B | 753M | 810M | 814M |
| EPS | 8.37 | 8.33 | 5.05 | 5.75 | 5.97 |
| Filing Date | 2022-03-15 | 2023-03-01 | 2024-02-23 | 2025-02-21 | 2026-02-25 |
Income Statement Evolution
From 2021 to 2025, Expeditors International’s revenue declined significantly by 33%, while net income fell 42.5%. The 2025 revenue rose 4.4% year-over-year, with gross profit growing 25.6%, indicating margin improvement. However, net margin contracted 3.8% in the last year, reflecting weaker bottom-line profitability despite stable EBIT margins near 9.9%.
Is the Income Statement Favorable?
The 2025 income statement shows neutral revenue growth but favorable gross profit and EBIT growth. Operating expenses rose proportionally with revenue, an unfavorable sign. Interest expense is zero, supporting net margins. Yet, net margin and overall profitability trends remain under pressure. Given these mixed signals, fundamentals appear broadly unfavorable for sustained earnings strength.
Financial Ratios
The table below summarizes key financial ratios for Expeditors International of Washington, Inc. from 2021 to 2025, illustrating profitability, liquidity, leverage, and market valuation metrics:
| Ratios | 2021 | 2022 | 2023 | 2024 | 2025 |
|---|---|---|---|---|---|
| Net Margin | 8.57% | 7.95% | 8.10% | 7.64% | 7.35% |
| ROE | 40.51% | 43.65% | 31.50% | 36.44% | 34.55% |
| ROIC | 35.49% | 37.23% | 23.85% | 27.62% | 26.65% |
| P/E | 16.05 | 12.48 | 25.20 | 19.28 | 24.87 |
| P/B | 6.50 | 5.45 | 7.94 | 7.03 | 8.59 |
| Current Ratio | 1.78 | 2.20 | 2.02 | 1.77 | 1.81 |
| Quick Ratio | 1.78 | 2.20 | 2.02 | 1.77 | 1.81 |
| D/E | 0.13 | 0.17 | 0.22 | 0.26 | 0.24 |
| Debt-to-Assets | 6.15% | 9.27% | 11.67% | 11.97% | 11.66% |
| Interest Coverage | 4646x | 78x | 196x | N/A | N/A |
| Asset Turnover | 2.17 | 3.05 | 2.06 | 2.23 | 2.26 |
| Fixed Asset Turnover | 17.45 | 16.91 | 9.34 | 10.59 | 10.93 |
| Dividend Yield | 0.86% | 1.26% | 1.06% | 1.31% | 1.03% |
Evolution of Financial Ratios
Return on Equity (ROE) showed a variable trend, peaking at 43.65% in 2022 before settling at 34.55% in 2025. The Current Ratio remained stable, fluctuating modestly around 1.8 to 2.2, signaling consistent liquidity. Debt-to-Equity Ratio increased gradually from 0.13 in 2021 to 0.24 in 2025, indicating cautious leverage growth. Profitability remained generally solid but showed some compression in net margins.
Are the Financial Ratios Fovorable?
In 2025, profitability metrics like ROE (34.55%) and ROIC (26.65%) are favorable, comfortably exceeding the WACC at 8.75%. Liquidity indicators, including the Current and Quick Ratios at 1.81, are also favorable, suggesting sound short-term financial health. Leverage ratios are conservative, with Debt-to-Equity at 0.24 and Debt-to-Assets at 11.66%. Market multiples reveal a high Price-to-Book (8.59) as unfavorable, though Price-to-Earnings (24.87) remains neutral. Overall, the ratios paint a favorable financial profile with some valuation caution.
Shareholder Return Policy
Expeditors International maintains a consistent dividend policy, with a payout ratio near 25% and a steady dividend per share rising from $1.16 in 2021 to $1.53 in 2025. The dividend yield hovers around 1%, supported by free cash flow coverage, indicating a balanced distribution approach.
The company also engages in share buybacks, enhancing shareholder returns beyond dividends. This combination suggests a disciplined capital allocation strategy aligned with sustainable long-term value creation, avoiding excessive distributions or repurchases that could strain financial flexibility.
Score analysis
Below is a radar chart illustrating Expeditors International’s key financial metric scores for a comprehensive overview:

The company scores very favorably on return on equity and assets, showing operational efficiency. Moderate scores in discounted cash flow and debt-to-equity suggest balanced capital management. However, valuation metrics like price-to-earnings and price-to-book are weak, indicating potential market undervaluation.
Analysis of the company’s bankruptcy risk
Expeditors International’s Altman Z-Score places it well within the safe zone, signaling low bankruptcy risk and strong financial stability:

Is the company in good financial health?
The following Piotroski diagram reflects a very strong score, underscoring robust financial health and operational strength:

With a Piotroski Score of 8, the company demonstrates excellent profitability, leverage, and liquidity metrics, marking it as financially sound and well-managed.
Competitive Landscape & Sector Positioning
This section examines Expeditors International of Washington, Inc.’s strategic positioning, revenue segments, and key products. I will analyze the main competitors and evaluate its competitive advantages. The goal is to determine whether Expeditors maintains an edge over its industry peers.
Strategic Positioning
Expeditors International diversifies across airfreight, ocean freight, and customs brokerage, with 2025 revenues of $3.98B, $2.81B, and $4.27B respectively. Its geographic footprint spans the US, Europe, North and South Asia, Latin America, and other North American markets, reflecting broad global exposure.
Revenue by Segment
This pie chart illustrates Expeditors International of Washington, Inc.’s revenue distribution by segment for the fiscal year 2025, highlighting the relative contribution of each service line.
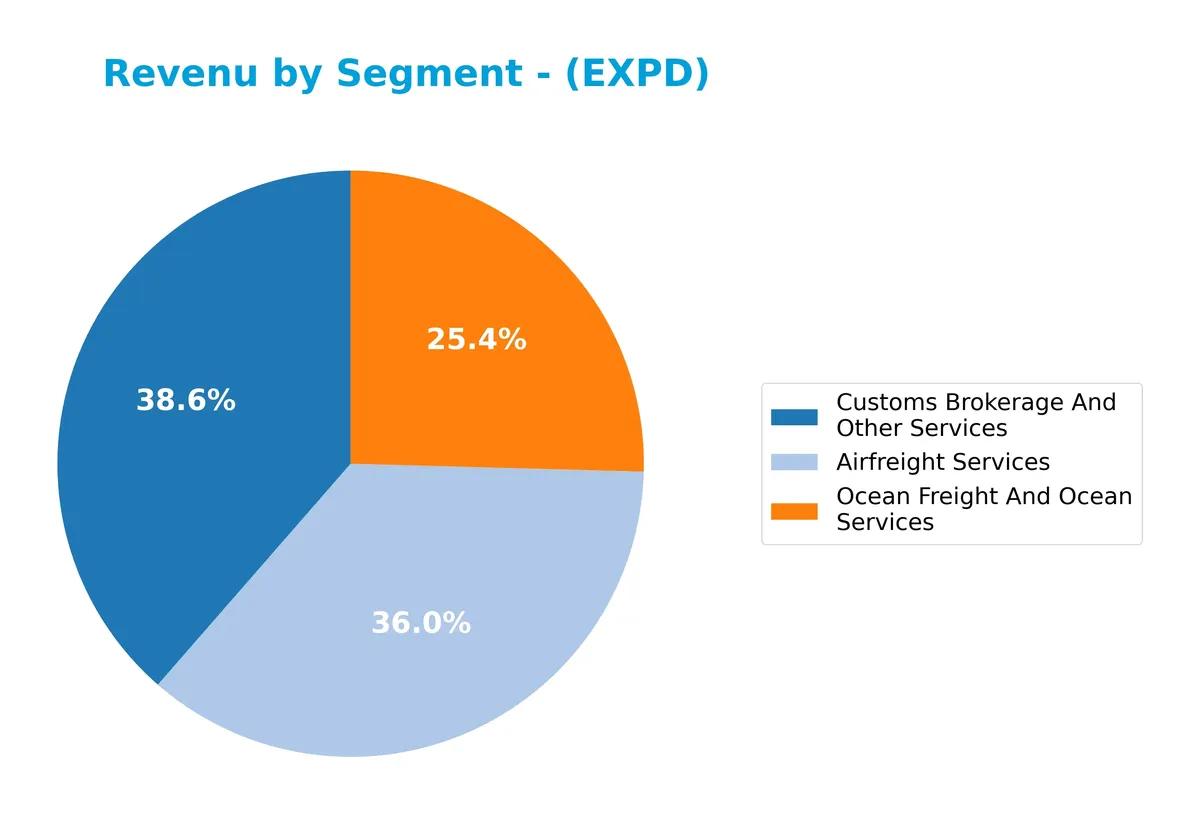
In 2025, Customs Brokerage And Other Services leads with $4.27B, closely followed by Airfreight Services at $3.98B. Ocean Freight And Ocean Services, at $2.81B, shows a decline from prior years, reflecting a notable shift away from ocean freight. This concentration around customs and airfreight suggests strategic emphasis on faster, higher-margin services amid evolving logistics demands. The downward trend in ocean freight signals potential risk if market dynamics shift further.
Key Products & Brands
Expeditors International’s main offerings cover airfreight, customs brokerage, and ocean freight services:
| Product | Description |
|---|---|
| Airfreight Services | Air freight consolidation, forwarding, and time-definite transportation across global markets. |
| Customs Brokerage And Other Services | Customs clearance, trade compliance, consulting, cargo security, and supply chain optimization solutions. |
| Ocean Freight And Ocean Services | Ocean freight consolidation, direct forwarding, order management, and related ocean logistics services. |
Expeditors operates a diversified logistics portfolio. Airfreight and customs brokerage generate stable revenue streams. Ocean freight complements with global shipping solutions, reflecting comprehensive supply chain expertise.
Main Competitors
The sector includes 5 main competitors; below is a table of the top 10 leaders by market capitalization:
| Competitor | Market Cap. |
|---|---|
| United Parcel Service, Inc. (UPS) | 85.7B |
| FedEx Corporation (FDX) | 69.2B |
| Expeditors International of Washington, Inc. (EXPD) | 20.8B |
| C.H. Robinson Worldwide, Inc. (CHRW) | 19.3B |
| J.B. Hunt Transport Services, Inc. (JBHT) | 18.7B |
Expeditors ranks third in market capitalization among its five competitors. Its market cap represents 22.5% of the leader, United Parcel Service. The company is below both the top 10 average of 42.8B and the sector median of 20.8B. It holds a strong 259% gap above its nearest competitor, demonstrating a clear lead in its peer group.
Comparisons with competitors
Check out how we compare the company to its competitors:
Does Expeditors have a competitive advantage?
Expeditors International of Washington, Inc. presents a competitive advantage by creating value with an ROIC 18% above its WACC, signaling efficient capital use. However, its ROIC trend is declining, indicating some erosion in profitability over recent years.
The company leverages a global logistics network across key regions, including North Asia and the United States, supporting diverse customer segments. Future opportunities lie in expanding services like temperature-controlled transit and supply chain optimization across new markets.
SWOT Analysis
This analysis highlights Expeditors International’s key strategic factors shaping its competitive position and growth prospects.
Strengths
- strong ROIC well above WACC
- robust liquidity with current ratio 1.81
- diversified global footprint across key regions
Weaknesses
- declining ROIC trend signals margin pressure
- unfavorable long-term revenue and net income growth
- high price-to-book ratio signals possible overvaluation
Opportunities
- expanding e-commerce logistics demand
- growth potential in emerging markets like South Asia
- leveraging technology for supply chain optimization
Threats
- global trade volatility and geopolitical risks
- intense competition in integrated logistics
- rising operational costs and inflationary pressures
Expeditors shows solid financial health and value creation but faces challenges with declining profitability and growth. The company must leverage its global network and capitalize on technological advances to sustain competitive advantage amid market uncertainties.
Stock Price Action Analysis
The weekly stock chart displays Expeditors International of Washington, Inc. (EXPD) price movements and volatility over the past 100 weeks:
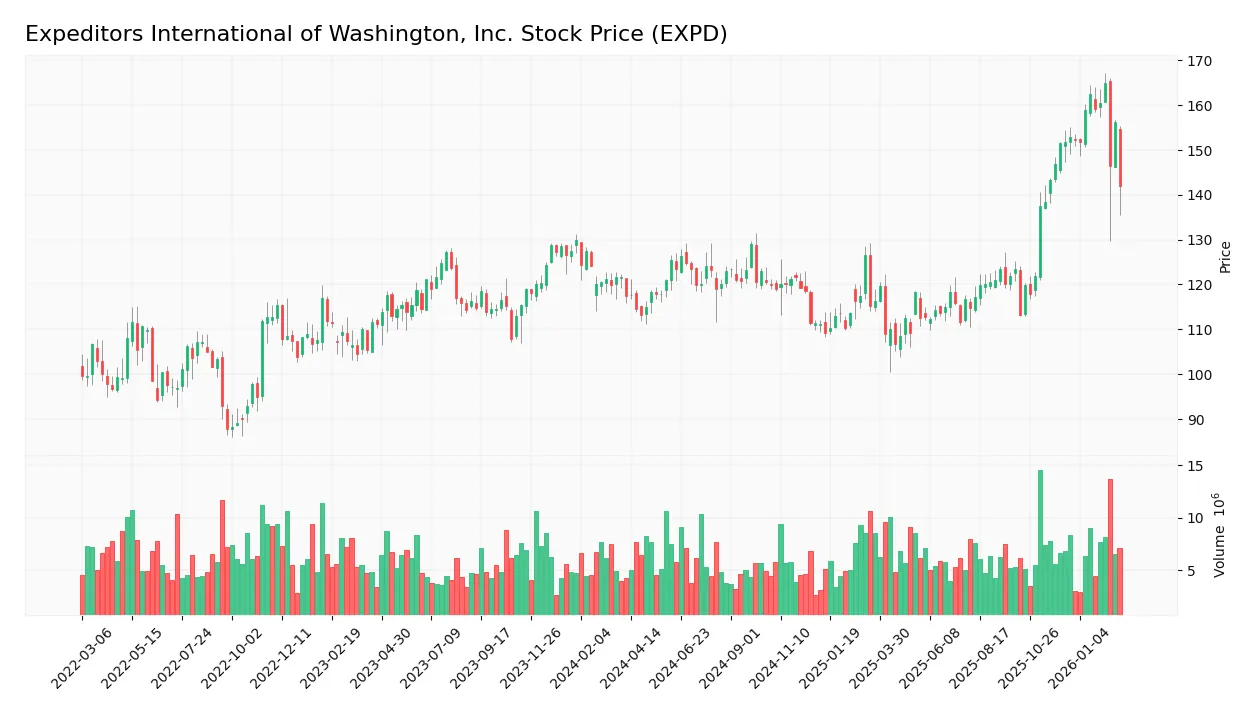
Trend Analysis
Over the past 12 months, EXPD’s price rose 20.89%, indicating a bullish trend despite deceleration. The stock ranged between 106.7 and 165.04, showing strong gains but reduced momentum. Volatility remains elevated with a 13.84% standard deviation, reflecting ongoing market fluctuations.
Volume Analysis
Trading volume for EXPD is increasing, with buyers dominating 61.61% overall and 62.89% recently. Buyer-driven activity suggests sustained investor confidence and growing market participation over the last three months. Seller volume remains significantly lower, reinforcing bullish demand pressure.
Target Prices
Analysts set a clear target consensus for Expeditors International of Washington, Inc. (EXPD).
| Target Low | Target High | Consensus |
|---|---|---|
| 95 | 166 | 140.13 |
The consensus target price of 140.13 suggests moderate upside potential, reflecting cautious optimism among industry analysts.

Don’t Let Luck Decide Your Entry Point
Optimize your entry points with our advanced ProRealTime indicators. You’ll get efficient buy signals with precise price targets for maximum performance. Start outperforming now!
Analyst & Consumer Opinions
This section examines the latest analyst grades and consumer feedback related to Expeditors International of Washington, Inc. for 2026.
Stock Grades
Here are the latest verified stock grades for Expeditors International of Washington, Inc.:
| Grading Company | Action | New Grade | Date |
|---|---|---|---|
| Susquehanna | Maintain | Neutral | 2026-02-25 |
| Truist Securities | Maintain | Hold | 2026-02-25 |
| Barclays | Maintain | Underweight | 2026-01-15 |
| Truist Securities | Maintain | Hold | 2026-01-15 |
| JP Morgan | Maintain | Underweight | 2026-01-12 |
| Stifel | Maintain | Hold | 2025-12-16 |
| Morgan Stanley | Maintain | Underweight | 2025-12-08 |
| UBS | Upgrade | Buy | 2025-11-17 |
| Stifel | Maintain | Hold | 2025-11-06 |
| TD Cowen | Maintain | Sell | 2025-11-05 |
The consensus remains a Hold with a majority of analysts maintaining neutral or hold ratings. Notably, UBS upgraded to Buy in late 2025, but several firms continue to favor cautious stances or underweight positions.
Consumer Opinions
Expeditors International of Washington, Inc. consistently earns praise for reliability but faces critiques on pricing and communication.
| Positive Reviews | Negative Reviews |
|---|---|
| “Always delivers on time with great care.” | “Customer service can be slow during peak seasons.” |
| “Transparent tracking and proactive updates.” | “Rates are higher compared to competitors.” |
| “Professional staff who handle complex logistics well.” | “Occasional delays in customs clearance notifications.” |
Overall, customers value Expeditors’ operational reliability and professionalism. However, concerns about pricing and occasional communication delays suggest areas for improvement.
Risk Analysis
Below is a summary table of key risks facing Expeditors International of Washington, Inc., highlighting their likelihood and potential impact:
| Category | Description | Probability | Impact |
|---|---|---|---|
| Market Volatility | Beta at 1.13 indicates moderate sensitivity to market swings. | Medium | Medium |
| Valuation Risk | High PB ratio (8.59) signals possible overvaluation. | High | High |
| Industry Disruption | Freight/logistics can be disrupted by geopolitical tensions. | Medium | High |
| Operational Risk | Supply chain delays or cost increases could pressure margins. | Medium | Medium |
| Financial Risk | Strong Altman Z-Score (8.7) and Piotroski (8) mitigate risk. | Low | Low |
Valuation risk stands out due to an unfavorable price-to-book ratio, suggesting the stock may be expensive versus assets. Geopolitical disruptions in global logistics pose significant impact risks. The company’s strong financial health, highlighted by a safe Altman Z-Score and very strong Piotroski score, provides a solid cushion against bankruptcy and credit risk.
Should You Buy Expeditors International of Washington, Inc.?
Analytically, Expeditors appears to offer robust profitability and a slightly favorable competitive moat despite declining ROIC. Its leverage profile is manageable, supported by a safe-zone Altman Z-score and a strong Piotroski score, suggesting a B+ rating.
Strength & Efficiency Pillars
Expeditors International of Washington, Inc. showcases robust profitability with a net margin of 7.35% and a return on equity (ROE) of 34.55%. Its return on invested capital (ROIC) stands at 26.65%, significantly above the weighted average cost of capital (WACC) at 8.75%, confirming it as a clear value creator. The company benefits from a high asset turnover of 2.26x and a low debt-to-equity ratio of 0.24, underscoring operational efficiency and prudent capital allocation. These metrics reflect strong financial discipline despite a slight decline in ROIC over recent years.
Weaknesses and Drawbacks
The valuation metrics raise concerns, with a price-to-book (P/B) ratio of 8.59 flagged as very unfavorable, indicating the stock trades at a steep premium relative to its book value. Although the price-to-earnings (P/E) ratio of 24.87 is neutral, it suggests limited margin for valuation expansion. However, liquidity and leverage profiles remain sound, with a current ratio of 1.81 and minimal debt burden. Market activity is positive, showing buyer dominance at 62.89%, reducing short-term selling pressure risk.
Our Final Verdict about Expeditors International of Washington, Inc.
The company’s strong solvency, confirmed by an Altman Z-Score of 8.69 in the safe zone, supports a fundamentally stable profile. Given the bullish overall stock trend and buyer dominance in recent periods, the stock may appear attractive for long-term exposure. However, elevated valuation multiples and decelerating ROIC suggest investors might consider timing entry points cautiously to optimize risk-adjusted returns.
Disclaimer: This content is for informational purposes only and does not constitute financial, investment, or other professional advice. Investing in financial markets involves a significant risk of loss, and past performance is not indicative of future results.
Additional Resources
- Decoding Expeditors International of Washington Inc (EXPD): A St – GuruFocus (Feb 26, 2026)
- EXPEDITORS INTERNATIONAL OF WASHINGTON INC SEC 10-K Report – TradingView (Feb 25, 2026)
- Expeditors International Unveils New $3 Billion Share Buyback – The Globe and Mail (Feb 25, 2026)
- Truist Financial Lowers Expeditors International of Washington (NASDAQ:EXPD) Price Target to $140.00 – MarketBeat (Feb 25, 2026)
- Expeditors International Of Washington Inc. Reports Drop In Q4 Profit – Nasdaq (Feb 24, 2026)
For more information about Expeditors International of Washington, Inc., please visit the official website: expeditors.com