Home > Analyses > Consumer Cyclical > Expedia Group, Inc.
Expedia Group, Inc. transforms how millions plan and book travel, shaping global mobility with unmatched digital reach. As a powerhouse in travel services, it commands a diverse brand portfolio, from Hotels.com to Vrbo, driving innovation in both leisure and corporate segments. Its seamless platforms set industry standards for convenience and choice. The critical question now: can Expedia’s robust fundamentals sustain its lofty market valuation and fuel future growth in a competitive landscape?

Table of contents
Business Model & Company Overview
Expedia Group, Inc., founded in 1996 and headquartered in Seattle, WA, dominates the travel services sector. The company orchestrates a vast ecosystem of brands—Expedia, Hotels.com, Vrbo, Orbitz, and more—offering seamless travel solutions from lodging to car rentals. This integrated platform caters to both leisure and corporate travelers, creating a unified mission to simplify global travel.
Its revenue engine balances diversified streams: retail bookings, B2B corporate travel management through Egencia, and metasearch referrals via Trivago. Expedia’s footprint spans the Americas, Europe, and Asia, leveraging localized websites and loyalty programs. This breadth and brand portfolio establish a formidable economic moat, positioning Expedia as a key architect of the travel industry’s future.
Financial Performance & Fundamental Metrics
I analyze Expedia Group, Inc.’s income statement, key financial ratios, and dividend payout policy to assess its core financial health and shareholder returns.
Income Statement
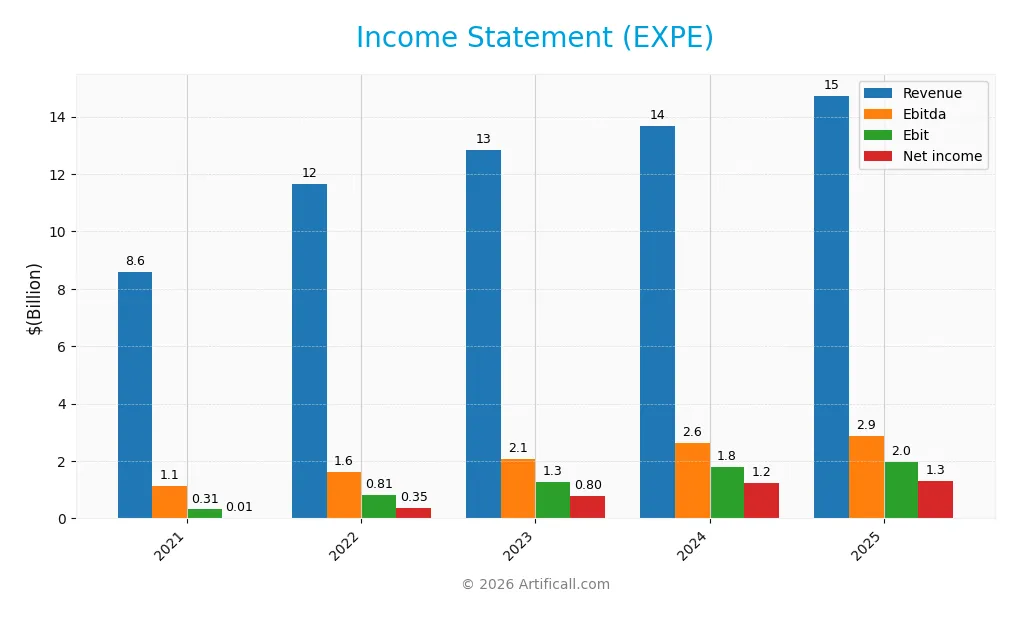
The table below presents Expedia Group, Inc.’s key income statement figures for fiscal years 2021 through 2025, showing revenue, expenses, and profitability metrics.
| 2021 | 2022 | 2023 | 2024 | 2025 | |
|---|---|---|---|---|---|
| Revenue | 8.6B | 11.7B | 12.8B | 13.7B | 14.7B |
| Cost of Revenue | 1.5B | 1.7B | 1.6B | 1.4B | 2.3B |
| Operating Expenses | 6.9B | 8.9B | 10.2B | 10.9B | 10.4B |
| Gross Profit | 7.1B | 10.0B | 11.3B | 12.2B | 12.4B |
| EBITDA | 1.1B | 1.6B | 2.1B | 2.6B | 2.9B |
| EBIT | 313M | 815M | 1.3B | 1.8B | 2.0B |
| Interest Expense | 351M | 277M | 245M | 246M | 299M |
| Net Income | 12M | 352M | 797M | 1.2B | 1.3B |
| EPS | -1.8 | 2.25 | 5.5 | 9.39 | 10.32 |
| Filing Date | 2022-02-11 | 2023-02-10 | 2024-02-09 | 2025-02-07 | 2026-02-13 |
Income Statement Evolution
From 2021 to 2025, Expedia Group’s revenue grew 71%, reaching $14.7B in 2025. Gross profit remained stable near $12B, supporting strong gross margins of 84%. Operating expenses rose in line with revenue, enabling EBIT growth of 11% in the latest year. Net income surged over 10,000% since 2021, though net margin dipped slightly by 2.5% in 2025.
Is the Income Statement Favorable?
In 2025, Expedia posted a net income of $1.29B on $14.7B revenue, with net margin at 8.8%, reflecting solid profitability. EBIT margin of 13.4% and a contained interest expense ratio at 2% underline operational discipline. Despite a minor net margin contraction, overall income statement metrics demonstrate favorable fundamentals supported by strong revenue and earnings growth.
Financial Ratios
The table below summarizes key financial ratios for Expedia Group, Inc. over the last five fiscal years, providing insight into profitability, liquidity, leverage, and market valuation:
| Ratios | 2021 | 2022 | 2023 | 2024 | 2025 |
|---|---|---|---|---|---|
| Net Margin | 0.14% | 3.02% | 6.21% | 9.01% | 8.78% |
| ROE | 0.58% | 15.42% | 51.96% | 79.25% | 100.78% |
| ROIC | -0.57% | 6.42% | 7.08% | 10.66% | 17.05% |
| P/E | 2255 | 39.0 | 27.6 | 19.8 | 27.4 |
| P/B | 13.16 | 6.01 | 14.34 | 15.73 | 27.66 |
| Current Ratio | 0.87 | 0.82 | 0.78 | 0.72 | 0.73 |
| Quick Ratio | 0.87 | 0.82 | 0.78 | 0.72 | 0.73 |
| D/E | 4.28 | 2.87 | 4.28 | 4.19 | 5.19 |
| Debt-to-Assets | 40.9% | 30.4% | 30.3% | 29.2% | 27.3% |
| Interest Coverage | 0.53 | 3.92 | 4.22 | 5.36 | 6.62 |
| Asset Turnover | 0.40 | 0.54 | 0.59 | 0.61 | 0.60 |
| Fixed Asset Turnover | 3.32 | 4.53 | 4.73 | 5.04 | 5.37 |
| Dividend Yield | 0.25% | 0.00% | 0.00% | 0.00% | 0.56% |
Evolution of Financial Ratios
The Return on Equity (ROE) improved sharply from 0.58% in 2021 to 100.78% in 2025, indicating a dramatic growth in shareholder returns. The Current Ratio declined from 0.87 to 0.73, signaling weakening short-term liquidity. Debt-to-Equity rose notably, reaching 5.19 in 2025, reflecting increased leverage. Profitability stabilized with net margins around 8.8% recently.
Are the Financial Ratios Favorable?
Profitability ratios like ROE (100.78%) and ROIC (17.05%) are favorable, signaling efficient capital use above the WACC (8.71%). Liquidity ratios (Current and Quick at 0.73) and leverage (Debt-to-Equity 5.19) are unfavorable, highlighting potential solvency risks. Market valuation ratios (P/E 27.45, P/B 27.66) also appear stretched. Overall, the financial ratios suggest a slightly unfavorable position.
Shareholder Return Policy
Expedia Group, Inc. resumed dividends in 2025 with a payout ratio of 15.5%, yielding 0.56% annually, supported by solid free cash flow coverage and moderate share buybacks. The dividend per share increased to $1.60, indicating cautious but positive distribution growth.
This payout approach appears sustainable, balancing shareholder returns with reinvestment needs. The company’s free cash flow comfortably covers dividends and buybacks, which supports long-term value creation without risking excessive leverage or cash strain.
Score analysis
The radar chart below highlights Expedia Group’s key financial scores across valuation, profitability, and leverage metrics:
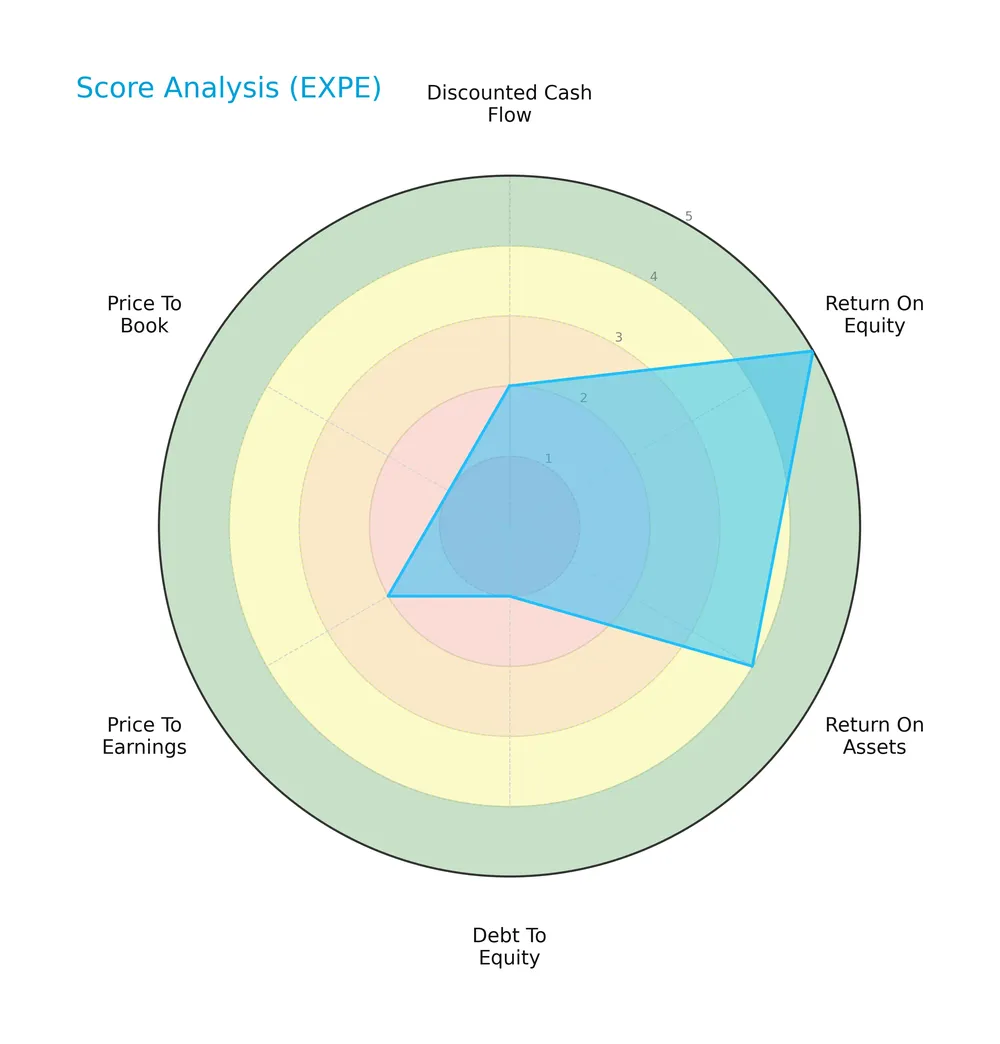
Expedia shows strong return on equity (5) and favorable return on assets (4). However, debt-to-equity (1), price-to-earnings (2), and price-to-book (1) scores signal significant weaknesses. The discounted cash flow score is also unfavorable (2), resulting in a moderate overall score (3).
Analysis of the company’s bankruptcy risk
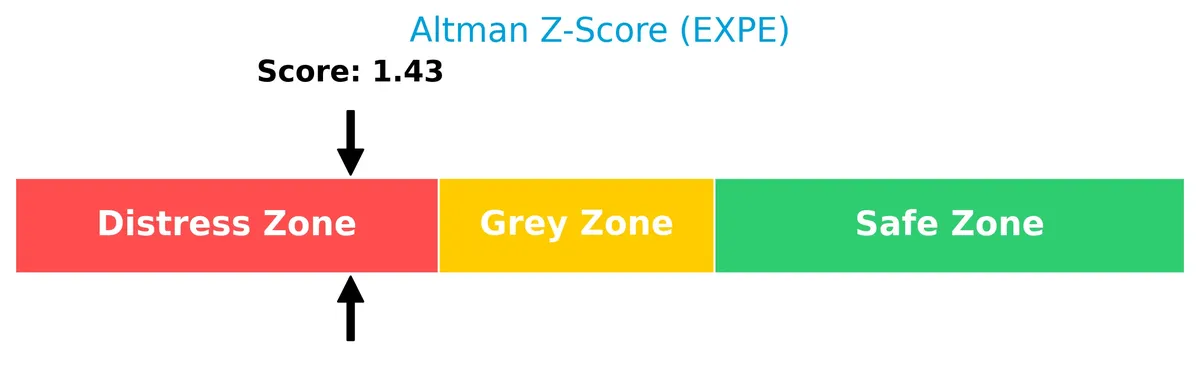
Expedia’s Altman Z-Score places it in the distress zone, indicating a high risk of financial distress and possible bankruptcy:
Is the company in good financial health?
The Piotroski Score diagram illustrates Expedia’s robust financial strength and operational efficiency:

With a strong Piotroski score of 8, the company demonstrates solid profitability, liquidity, and leverage metrics, signaling very strong financial health despite some valuation and leverage concerns.
Competitive Landscape & Sector Positioning
This section analyzes Expedia Group’s strategic positioning within the travel services sector. It examines revenue by segment, key products, main competitors, and competitive advantages. I will assess whether Expedia Group holds a sustainable competitive edge over its peers.
Strategic Positioning
Expedia Group concentrates mainly on lodging, generating $11.75B in 2025, while air travel and advertising contribute smaller shares. Its geographic exposure balances between the U.S. ($8.71B) and international markets ($5.32B in 2024), reflecting a diversified yet lodging-focused portfolio.
Revenue by Segment
This pie chart illustrates Expedia Group’s revenue distribution by segment for the fiscal year 2025, highlighting the company’s primary business drivers in the travel sector.
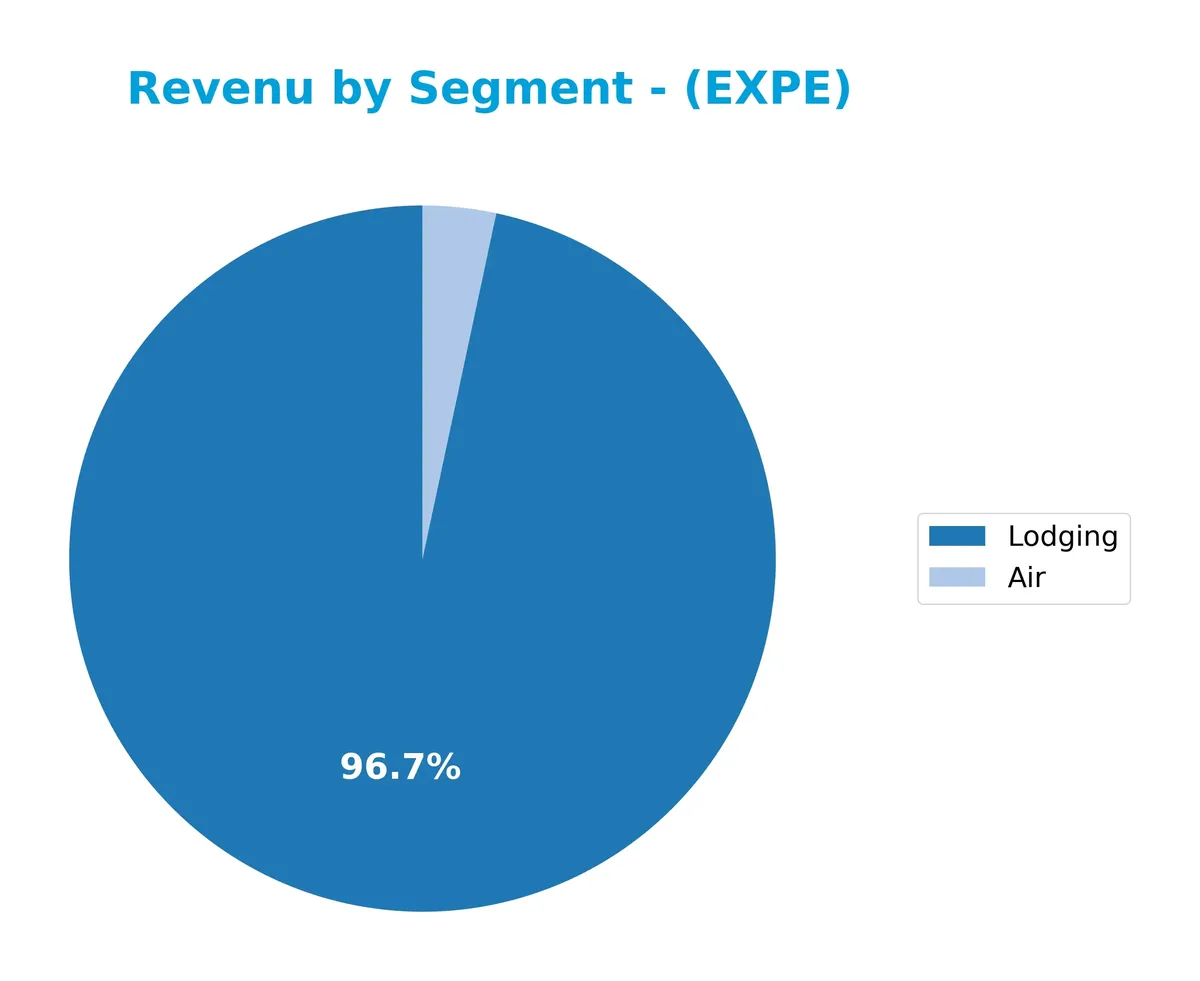
Lodging dominates with $11.75B, underscoring Expedia’s core strength in accommodations. Air contributes a modest $407M, reflecting a smaller but steady business line. Notably, Advertising and Media Customers, once a meaningful segment, is absent in 2025, indicating a strategic shift or divestment. The data show Lodging’s accelerating growth, reinforcing concentration risk but also demonstrating Expedia’s moat in hotel bookings.
Key Products & Brands
Below is an overview of Expedia Group’s key products and brands with brief descriptions:
| Product | Description |
|---|---|
| Brand Expedia | Full-service online travel brand with localized websites worldwide. |
| Hotels.com | Platform for marketing and distributing lodging accommodations globally. |
| Vrbo | Online marketplace specializing in alternative accommodations like vacation rentals. |
| Orbitz, Travelocity, CheapTickets | Travel booking websites offering flights, hotels, and packages. |
| ebookers | Online travel agent operating in EMEA providing diverse travel options. |
| Hotwire | Travel booking service focusing on discounted hotel rooms, flights, and car rentals. |
| CarRentals.com | Online car rental booking service across multiple locations. |
| Classic Vacations | Luxury travel specialist offering curated vacation packages. |
| Expedia Cruise | Advisor and booking platform for cruise travelers. |
| Expedia Partner Solutions | B2B service providing travel and non-travel vertical solutions including corporate travel. |
| Egencia | Corporate travel management services for business clients. |
| Trivago | Hotel metasearch website sending referrals to online travel companies and providers. |
| Expedia Group Media Solutions | Advertising and media services supporting travel brands and partners. |
| Wotif.com, lastminute.com.au, travel.com.au, Wotif.co.nz, lastminute.co.nz | Regional online travel service brands targeting Australian and New Zealand markets. |
Expedia Group’s portfolio spans full-service retail travel, alternative accommodations, corporate travel management, and advertising. This diverse brand mix supports leisure and business travelers across multiple global markets.
Main Competitors
The sector includes 5 competitors, with the table listing the top 5 leaders by market capitalization:
| Competitor | Market Cap. |
|---|---|
| Booking Holdings Inc. | 172B |
| Airbnb, Inc. | 82.3B |
| Royal Caribbean Cruises Ltd. | 77.2B |
| Expedia Group, Inc. | 33.1B |
| Norwegian Cruise Line Holdings Ltd. | 10.4B |
Expedia Group ranks 4th among its competitors. Its market cap represents 14.5% of the sector leader, Booking Holdings. Expedia’s scale is below both the average market cap of the top 10 (75B) and the median market cap in the sector (77B). It stands 210% below the next competitor above, highlighting a significant gap in scale.
Comparisons with competitors
Check out how we compare the company to its competitors:
Does EXPE have a competitive advantage?
Expedia Group demonstrates a sustainable competitive advantage, creating significant value with an ROIC exceeding its WACC by over 8%. Its ROIC trend shows strong growth, signaling increasingly efficient capital allocation.
Looking ahead, Expedia’s diverse brand portfolio and expansion in international markets offer multiple growth avenues. Continued investments in B2B and alternative accommodations position the company to capture evolving travel service demands.
SWOT Analysis
This analysis highlights Expedia Group’s core strengths, weaknesses, opportunities, and threats shaping its strategic outlook.
Strengths
- strong brand portfolio
- high ROIC above WACC
- diversified global presence
Weaknesses
- low current and quick ratios
- high debt-to-equity ratio
- elevated P/E and P/B multiples
Opportunities
- expanding alternative accommodations
- growing corporate travel segment
- increasing digital adoption in travel
Threats
- intense competition in online travel
- economic downturn impact on travel demand
- regulatory risks in global markets
Expedia’s robust competitive moat and operational efficiency support growth. However, liquidity constraints and valuation risks require caution. Strategic focus should leverage growth areas while managing financial leverage prudently.
Stock Price Action Analysis
The following weekly stock chart for Expedia Group, Inc. displays price movements over the past 12 months, highlighting key volatility and trend shifts:
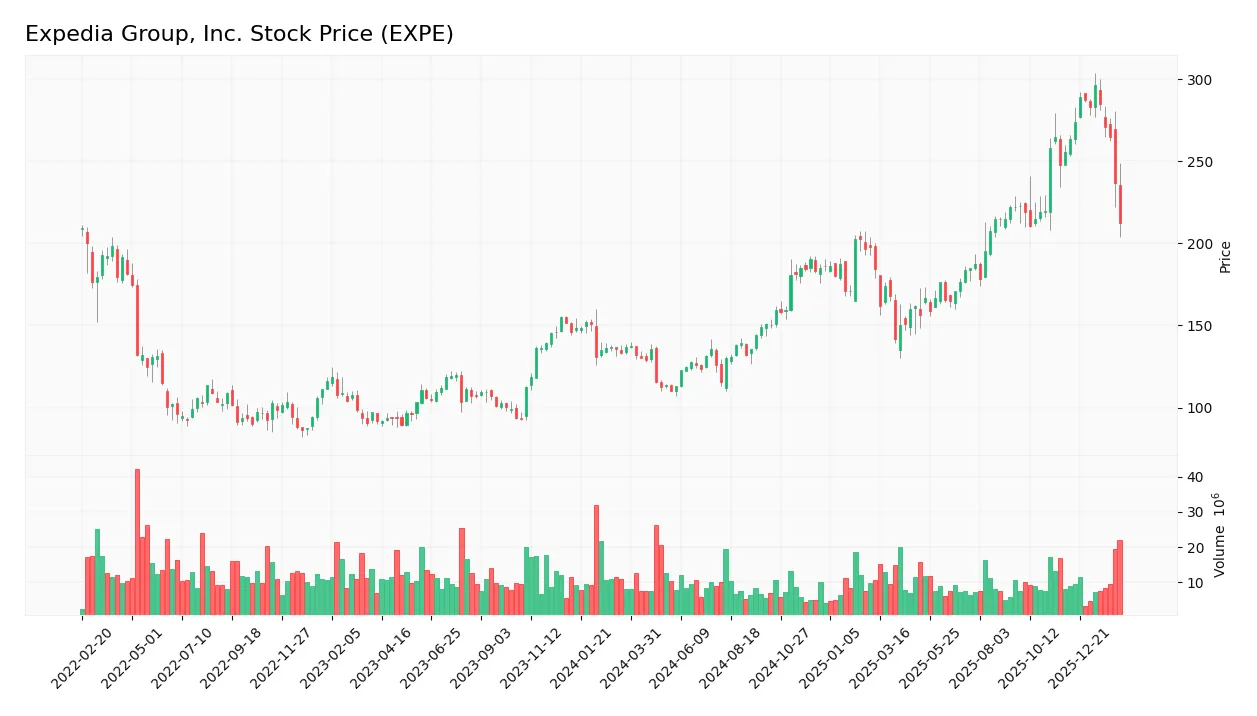
Trend Analysis
Over the past 12 months, Expedia’s stock rose 55.42%, indicating a strong bullish trend despite a deceleration in momentum. The price fluctuated widely, with a high of 296.33 and a low of 110.31, reflecting significant volatility (47.22 std dev).
Volume Analysis
Trading volume has decreased recently, with sellers dominating 62.23% over the last three months. This shift to seller-driven activity suggests waning buying interest and cautious investor sentiment during the recent downtrend.
Target Prices
Analysts present a moderately bullish consensus for Expedia Group, Inc. in 2026.
| Target Low | Target High | Consensus |
|---|---|---|
| 244 | 330 | 277.43 |
The target range from 244 to 330 indicates analysts expect solid upside potential, reflecting confidence in Expedia’s recovery and growth prospects.

Don’t Let Luck Decide Your Entry Point
Optimize your entry points with our advanced ProRealTime indicators. You’ll get efficient buy signals with precise price targets for maximum performance. Start outperforming now!
Analyst & Consumer Opinions
This section examines the latest analyst ratings and consumer feedback regarding Expedia Group, Inc.’s market performance and service quality.
Stock Grades
Below is a summary of recent verified analyst grades for Expedia Group, Inc., reflecting the current consensus:
| Grading Company | Action | New Grade | Date |
|---|---|---|---|
| Piper Sandler | Maintain | Neutral | 2026-02-13 |
| TD Cowen | Maintain | Hold | 2026-02-13 |
| BTIG | Maintain | Buy | 2026-02-13 |
| Benchmark | Maintain | Buy | 2026-02-13 |
| Wells Fargo | Maintain | Equal Weight | 2026-02-13 |
| DA Davidson | Maintain | Neutral | 2026-02-13 |
| Barclays | Maintain | Equal Weight | 2026-02-13 |
| Truist Securities | Maintain | Hold | 2026-02-10 |
| Wedbush | Maintain | Neutral | 2026-02-06 |
| UBS | Maintain | Neutral | 2026-02-03 |
The grades uniformly reflect a cautious stance, with a preponderance of Hold, Neutral, and Equal Weight ratings. Buy ratings persist but do not dominate, indicating mixed sentiment among analysts.
Consumer Opinions
Consumers express mixed feelings about Expedia Group, Inc., reflecting both the convenience and occasional frustrations of online travel booking.
| Positive Reviews | Negative Reviews |
|---|---|
| Easy-to-use platform with comprehensive options. | Customer service response times can be slow. |
| Competitive pricing and frequent discounts. | Occasional booking errors and cancellations. |
| Helpful mobile app features for on-the-go planning. | Confusing refund policies in some cases. |
Overall, users appreciate Expedia’s user-friendly interface and pricing but often cite customer support delays and booking inconsistencies as key pain points. These issues could undermine trust if not addressed promptly.
Risk Analysis
The table below summarizes key risks facing Expedia Group, Inc. based on financial and market indicators:
| Category | Description | Probability | Impact |
|---|---|---|---|
| Financial Health | Altman Z-Score in distress zone signals bankruptcy risk | High | High |
| Liquidity | Low current and quick ratios (0.73) suggest liquidity issues | Medium | Medium |
| Leverage | High debt-to-equity ratio (5.19) indicates financial risk | Medium | High |
| Valuation | Elevated P/E (27.45) and P/B (27.66) ratios suggest overvaluation | Medium | Medium |
| Market Volatility | Beta of 1.38 shows above-average stock price volatility | High | Medium |
| Dividend Yield | Low yield (0.56%) limits income appeal | Low | Low |
Expedia’s bankruptcy risk is elevated with its Altman Z-Score at 1.43, below the safe threshold of 3. Liquidity constraints and heavy leverage compound this risk. Despite strong profitability (ROE 100.8%), valuation multiples remain stretched, reflecting market skepticism after a recent 6.4% price drop. Investors must weigh these risks carefully.
Should You Buy Expedia Group, Inc.?
Expedia appears to be in a very favorable moat position with growing ROIC indicating strong value creation. Despite robust profitability and operational efficiency, its leverage profile raises concerns. The overall B- rating reflects moderate financial health with notable risks.
Strength & Efficiency Pillars
Expedia Group, Inc. delivers robust operational efficiency highlighted by a favorable net margin of 8.78% and a striking return on equity of 100.78%. Its return on invested capital stands at 17.05%, comfortably exceeding the weighted average cost of capital at 8.71%, confirming the company as a clear value creator. The firm’s gross margin of 84.1% and EBIT margin of 13.43% further underline its operational strength despite sector cyclicality. This combination suggests Expedia maintains a sustainable competitive advantage with growing profitability.
Weaknesses and Drawbacks
Expedia currently resides in the Altman Z-Score distress zone with a score of 1.43, signaling a significant bankruptcy risk that overshadows profitability metrics. The company’s leverage is precarious, with a debt-to-equity ratio of 5.19, indicating heavy reliance on debt financing. Liquidity is constrained, as reflected in a current ratio of 0.73, which raises concerns about short-term solvency. Additionally, premium valuation multiples—P/E at 27.45 and P/B at 27.66—may pressure the stock amid recent seller dominance, where buyers account for only 37.77%.
Our Final Verdict about Expedia Group, Inc.
Despite strong operational margins and value creation, Expedia’s solvency risk, evidenced by its distress-level Altman Z-Score, renders the investment profile highly speculative. This financial fragility tempers enthusiasm and suggests prudence for conservative capital. Investors might consider waiting for clearer signs of balance sheet stabilization before committing, as the current risk environment is too elevated despite underlying profitability.
Disclaimer: This content is for informational purposes only and does not constitute financial, investment, or other professional advice. Investing in financial markets involves a significant risk of loss, and past performance is not indicative of future results.
Additional Resources
- Expedia Group Inc (EXPE) Stock Price, Trades & News – GuruFocus (Feb 13, 2026)
- Expedia Group, Inc. (NASDAQ:EXPE) Announces Dividend Increase – $0.48 Per Share – MarketBeat (Feb 13, 2026)
- Expedia Group, Inc. (NASDAQ:EXPE) Q4 2025 Earnings Call Transcript – Insider Monkey (Feb 13, 2026)
- Expedia Group Reports Fourth Quarter and Full Year 2025 Results – Business Wire (Feb 12, 2026)
- EXPE Q4 Deep Dive: B2B Growth, AI Investments, and Strategic Supply Expansion – Finviz (Feb 13, 2026)
For more information about Expedia Group, Inc., please visit the official website: expediagroup.com