Home > Analyses > Energy > Expand Energy Corporation
Expand Energy Corporation fuels millions of homes and industries by unlocking vast natural gas reserves beneath U.S. soil. As a pioneer in unconventional gas exploration, it commands a significant footprint in the Marcellus and Haynesville Shales, blending cutting-edge technology with operational expertise. Known for steady production and disciplined capital allocation, Expand Energy shapes the future of energy supply. But does its current financial strength and growth pipeline justify today’s market valuation?

Table of contents
Business Model & Company Overview
Expand Energy Corporation, founded in 1989 and headquartered in Oklahoma City, dominates the U.S. independent oil and gas exploration sector. Its core mission integrates acquisition, exploration, and development of unconventional natural gas assets, including about 5,000 wells across Marcellus and Haynesville/Bossier Shales. This cohesive ecosystem centers on tapping underground reservoirs to deliver energy resources efficiently and sustainably.
The company’s revenue engine balances production from oil, natural gas, and natural gas liquids, leveraging strong footholds in key American basins. While primarily focused on the U.S. market, its operational scale and expertise build a robust competitive advantage. Expand Energy’s deep asset base and specialized knowledge form a durable economic moat, positioning it as a pivotal player shaping North America’s energy future.
Financial Performance & Fundamental Metrics
I analyze Expand Energy Corporation’s income statement, key financial ratios, and dividend payout policy to assess its core financial health and shareholder value.
Income Statement
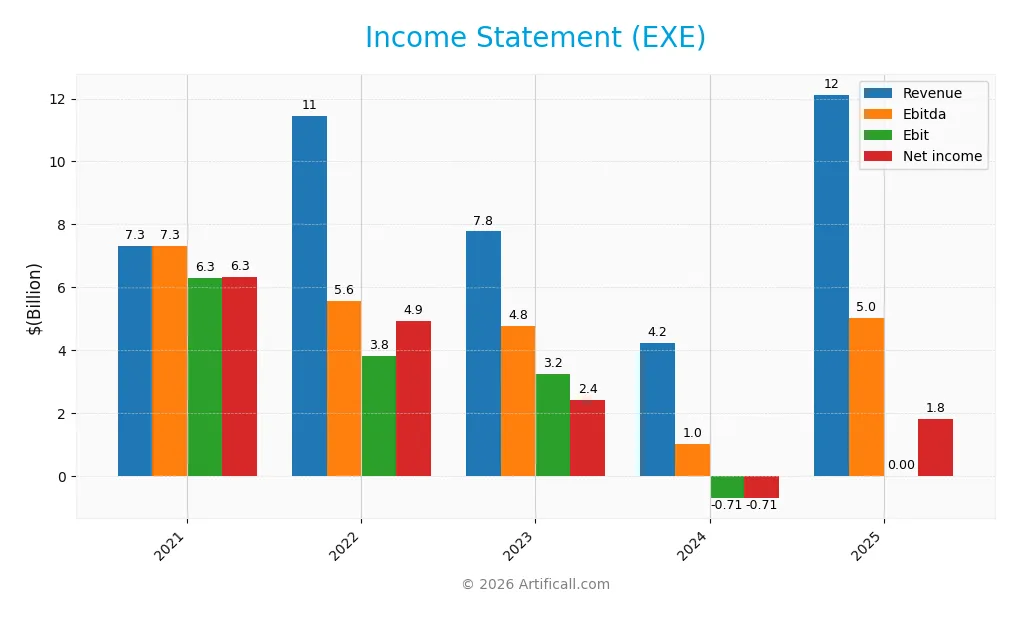
The following table summarizes Expand Energy Corporation’s key income statement metrics for fiscal years 2021 through 2025. All figures are in USD.
| 2021 | 2022 | 2023 | 2024 | 2025 | |
|---|---|---|---|---|---|
| Revenue | 7.3B | 11.4B | 7.8B | 4.2B | 12.1B |
| Cost of Revenue | 4.9B | 3.3B | 2.7B | 3.1B | 2.4B |
| Operating Expenses | 95M | 4.4B | 1.9B | 1.9B | 7.3B |
| Gross Profit | 2.4B | 8.2B | 5.0B | 1.1B | 9.7B |
| EBITDA | 7.3B | 5.6B | 4.8B | 1.0B | 5.0B |
| EBIT | 6.3B | 3.8B | 3.2B | -711M | 0 |
| Interest Expense | 84M | 160M | 104M | 123M | 235M |
| Net Income | 6.3B | 4.9B | 2.4B | -714M | 1.8B |
| EPS | 53.66 | 38.71 | 18.21 | -4.55 | 7.67 |
| Filing Date | 2022-02-24 | 2023-02-22 | 2024-02-21 | 2025-02-26 | 2026-02-17 |
Income Statement Evolution
Expand Energy Corporation’s revenue surged 187% from 2024 to 2025, following a favorable 66% growth over 2021–2025. Gross margin improved markedly to 80.4%, signaling efficient cost control. However, net income declined over the longer term by 71%, reflecting margin pressure. The net margin rose to 15% in 2025, recovering from prior weakness, yet EBIT margin remained flat at 0%.
Is the Income Statement Favorable?
In 2025, EXE’s fundamentals show mixed signals. Revenue and gross profit growth were strong, but operating expenses rose proportionally, limiting EBIT margin expansion. Interest expense remains low at 1.94% of revenue, supporting net income generation. Despite a positive net margin of 15%, the zero EBIT margin highlights operational challenges. Overall, the income statement trend appears favorable yet signals caution on profitability sustainability.
Financial Ratios
The following table presents key financial ratios for Expand Energy Corporation from 2021 to 2025, illustrating its profitability, valuation, liquidity, leverage, and efficiency metrics:
| Ratios | 2021 | 2022 | 2023 | 2024 | 2025 |
|---|---|---|---|---|---|
| Net Margin | 87% | 43% | 31% | -17% | 15% |
| ROE | 112% | 54% | 23% | -4% | 0% |
| ROIC | 27% | 29% | 19% | -3% | 0% |
| P/E | 1.2 | 2.4 | 4.2 | -21.9 | 0.01 |
| P/B | 1.34 | 1.30 | 0.95 | 0.89 | 0 |
| Current Ratio | 0.86 | 1.00 | 1.99 | 0.64 | 0 |
| Quick Ratio | 0.86 | 1.00 | 1.99 | 0.64 | 0 |
| D/E | 0.41 | 0.35 | 0.20 | 0.33 | 0 |
| Debt-to-Assets | 21% | 21% | 15% | 21% | 0% |
| Interest Coverage | 28x | 24x | 30x | -6.5x | -10.5x |
| Asset Turnover | 0.66 | 0.74 | 0.54 | 0.15 | 0 |
| Fixed Asset Turnover | 0.83 | 1.01 | 0.76 | 0.17 | 0 |
| Dividend Yield | 0.02% | 0.10% | 0.05% | 0.02% | 29.2% |
Evolution of Financial Ratios
Return on Equity (ROE) for Expand Energy Corporation fell to zero in 2025, indicating a sharp decline in profitability compared to previous years. The Current Ratio dropped to zero, signaling potential liquidity issues. Meanwhile, the Debt-to-Equity Ratio also reached zero, reflecting a significant change or data omission. Profitability margins showed instability, with net margin improving to 15% in 2025 after negative results in 2024.
Are the Financial Ratios Fovorable?
The 2025 ratios present a mixed picture. Profitability appears favorable with a net margin of 15% and an extremely low Price-to-Earnings ratio of 0.01, suggesting undervaluation. However, liquidity ratios are unfavorable, as both current and quick ratios stand at zero. Leverage ratios remain favorable, with zero debt-to-equity and debt-to-assets ratios. Efficiency metrics like asset turnover are unfavorable. Overall, the financial ratios are slightly unfavorable due to liquidity and efficiency concerns.
Shareholder Return Policy
Expand Energy Corporation maintains a dividend payout ratio of approximately 42% in 2025, with a substantial dividend per share increase to 3,224 USD and an extraordinarily high dividend yield near 29%. The dividend appears well covered by free cash flow, supported by share buybacks, indicating a commitment to returning capital to shareholders.
However, the exceptional dividend yield raises concerns about sustainability amid volatile margins and negative interest coverage ratios in recent years. While the policy reflects aggressive shareholder returns, it warrants cautious monitoring to ensure long-term value creation without jeopardizing financial flexibility.
Score analysis
The following radar chart illustrates the company’s key financial metric scores for a comprehensive overview:
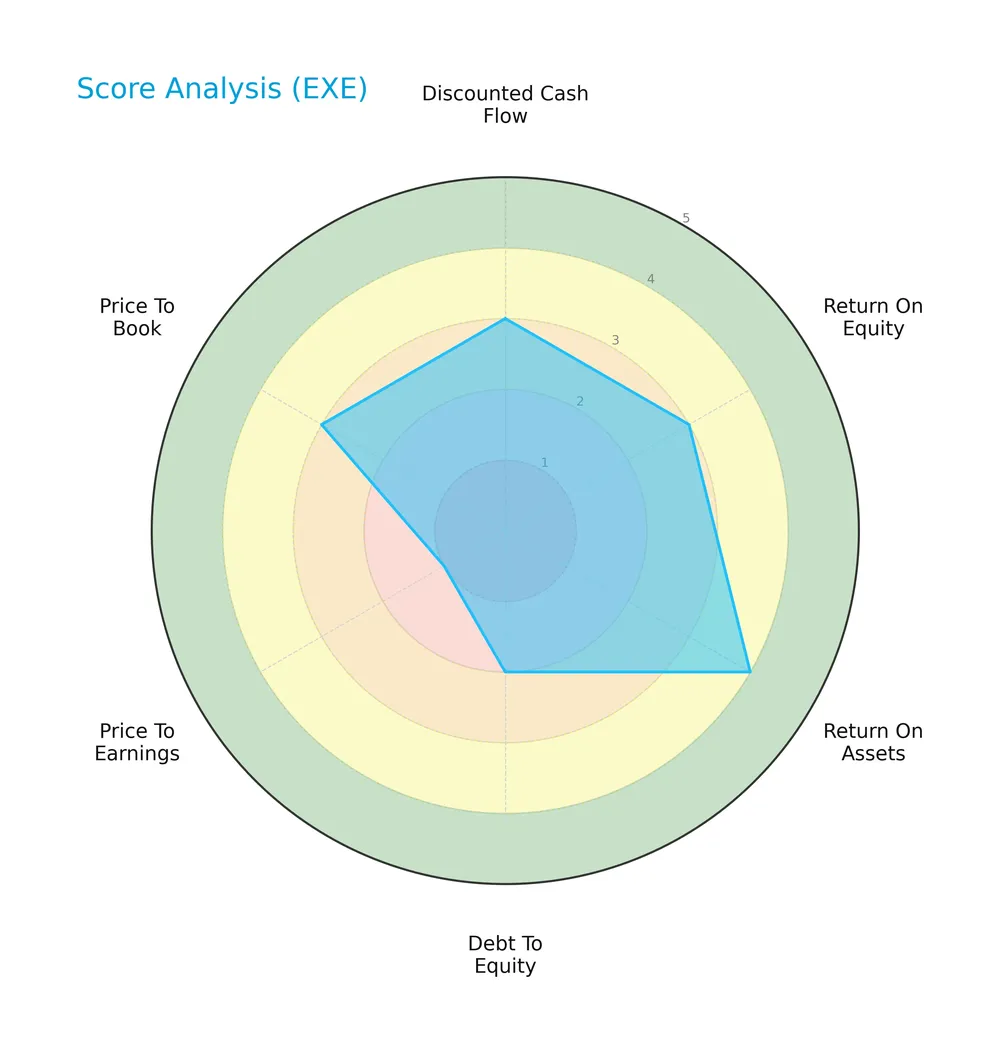
Expand Energy Corporation shows moderate scores in discounted cash flow, ROE, and price-to-book. Return on assets stands out favorably. Debt-to-equity and price-to-earnings scores are notably weak, signaling potential capital structure and valuation concerns.
Analysis of the company’s bankruptcy risk
The Altman Z-Score positions the company in the grey zone, indicating a moderate risk of bankruptcy that requires cautious monitoring:

Is the company in good financial health?
This Piotroski diagram highlights the company’s strong financial health based on its maximum score:

With a perfect Piotroski Score of 9, Expand Energy demonstrates very strong profitability, liquidity, and operational efficiency, signaling robust financial strength despite some valuation weaknesses.
Competitive Landscape & Sector Positioning
This section examines Expand Energy Corporation’s strategic positioning, revenue segments, and key products within the oil and gas sector. I will assess whether the company holds a competitive advantage over its main industry rivals.
Strategic Positioning
Expand Energy Corporation focuses on a concentrated portfolio of U.S. onshore unconventional natural gas assets, primarily in the Marcellus and Haynesville/Bossier Shales. Its revenue heavily depends on natural gas sales and related midstream activities, reflecting a specialized regional and product strategy within the energy sector.
Revenue by Segment
The pie chart illustrates Expand Energy Corporation’s revenue breakdown by segment for fiscal year 2024, highlighting key drivers within its energy portfolio.
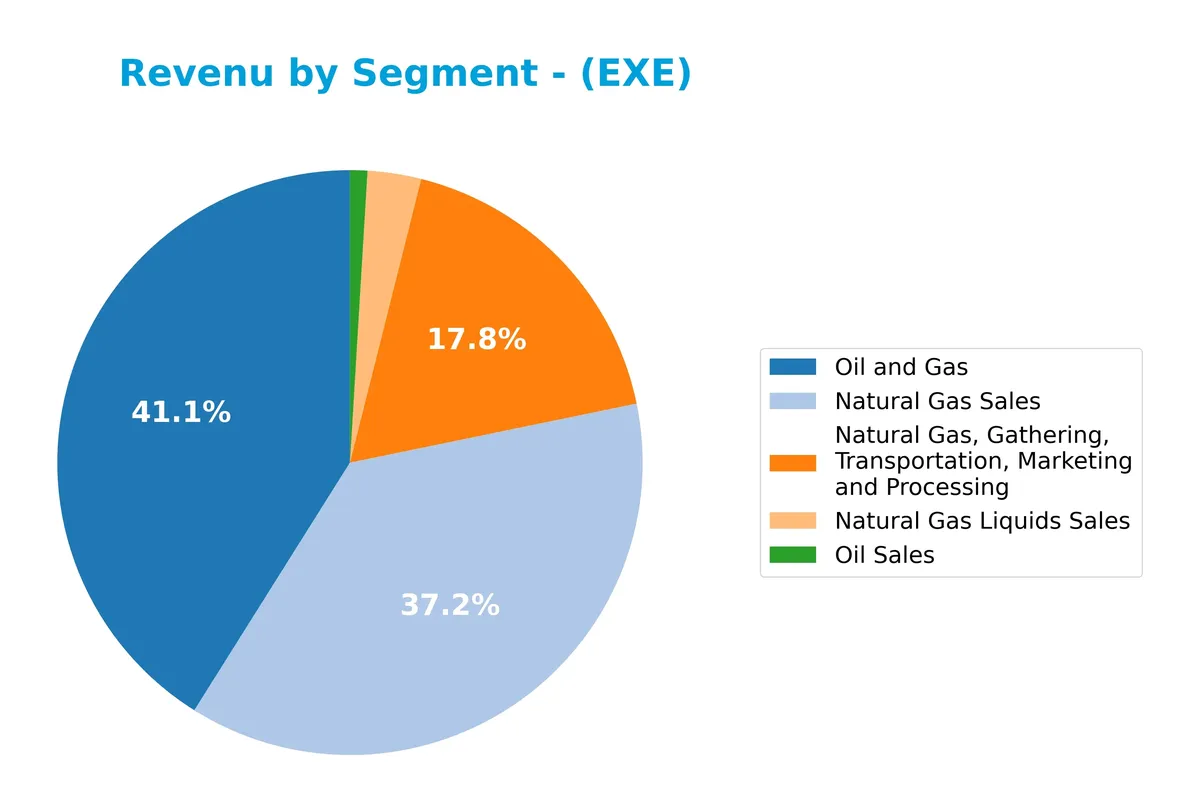
In 2024, Natural Gas Sales dominate with $2.7B, followed by Natural Gas Gathering, Transportation, Marketing and Processing at $1.3B. Natural Gas Liquids Sales and Oil Sales contribute smaller shares at $214M and $69M, respectively. The data reveals a concentration in natural gas-related segments, reflecting a strategic focus. Compared to prior years, Oil Sales have sharply declined, signaling potential sector risk or portfolio shift.
Key Products & Brands
Expand Energy Corporation’s key products and brands focus on natural gas, oil, and related midstream services:
| Product | Description |
|---|---|
| Natural Gas Sales | Sales of natural gas produced from onshore U.S. unconventional reservoirs. |
| Natural Gas Liquids Sales | Sales of natural gas liquids (NGLs) extracted alongside natural gas production. |
| Oil Sales | Sales of crude oil produced from company-operated wells. |
| Natural Gas, Gathering, Transportation, Marketing and Processing | Midstream services including gathering, transportation, marketing, and processing of natural gas. |
| Oil and Gas | Combined revenue from oil and natural gas production activities. |
Expand Energy primarily generates revenue from natural gas sales and midstream operations, with oil sales representing a smaller portion. Midstream services add diversification within the energy value chain.
Main Competitors
Expand Energy Corporation faces 10 main competitors in the Oil & Gas Exploration & Production sector. The table below lists the top 10 leaders by market capitalization:
| Competitor | Market Cap. |
|---|---|
| ConocoPhillips | 120B |
| EOG Resources, Inc. | 59B |
| Diamondback Energy, Inc. | 44B |
| Occidental Petroleum Corporation | 42B |
| EQT Corporation | 33B |
| Expand Energy Corporation | 26B |
| Devon Energy Corporation | 24B |
| Texas Pacific Land Corporation | 20B |
| Coterra Energy Inc. | 20B |
| APA Corporation | 9B |
Expand Energy Corporation ranks 6th among its top 10 competitors. Its market cap is 20.3% of the leader, ConocoPhillips. The company sits below both the average market cap of 40B and the median sector cap of 29.8B. It enjoys a 36.3% premium over the next closest competitor above, indicating a moderate gap in scale.
Comparisons with competitors
Check out how we compare the company to its competitors:
Does EXE have a competitive advantage?
Expand Energy Corporation shows some competitive strengths with a high gross margin of 80.4% and a solid net margin of 15.0%, supported by favorable revenue growth of 187% in the past year. However, its declining ROIC trend and unavailable ROIC versus WACC data limit visibility on sustainable economic moats.
Looking ahead, Expand Energy’s focus on unconventional natural gas assets in key U.S. shale plays presents growth opportunities. The company’s portfolio of approximately 5,000 wells in the Marcellus and Haynesville/Bossier Shales could drive future production expansion and cash flow generation.
SWOT Analysis
This analysis highlights Expand Energy Corporation’s core competitive factors and risks to inform strategic decisions.
Strengths
- strong net margin of 15%
- robust revenue growth of 187% in the past year
- very strong Piotroski score of 9
Weaknesses
- zero ROIC indicating poor capital efficiency
- unfavorable current and quick ratios signaling liquidity risks
- declining net income growth over the period
Opportunities
- expanding natural gas demand in U.S. markets
- potential to optimize operational efficiency
- growth in Marcellus and Haynesville shale assets
Threats
- volatile commodity prices impacting revenue
- regulatory and environmental compliance costs
- moderate bankruptcy risk indicated by Altman Z-Score
Expand Energy possesses solid profitability and growth momentum but faces liquidity and capital efficiency challenges. The company should leverage its operational strengths while addressing financial risks to sustain growth and resilience.
Stock Price Action Analysis
The weekly stock chart of Expand Energy Corporation (EXE) displays price movements and volatility over the past 100 weeks:
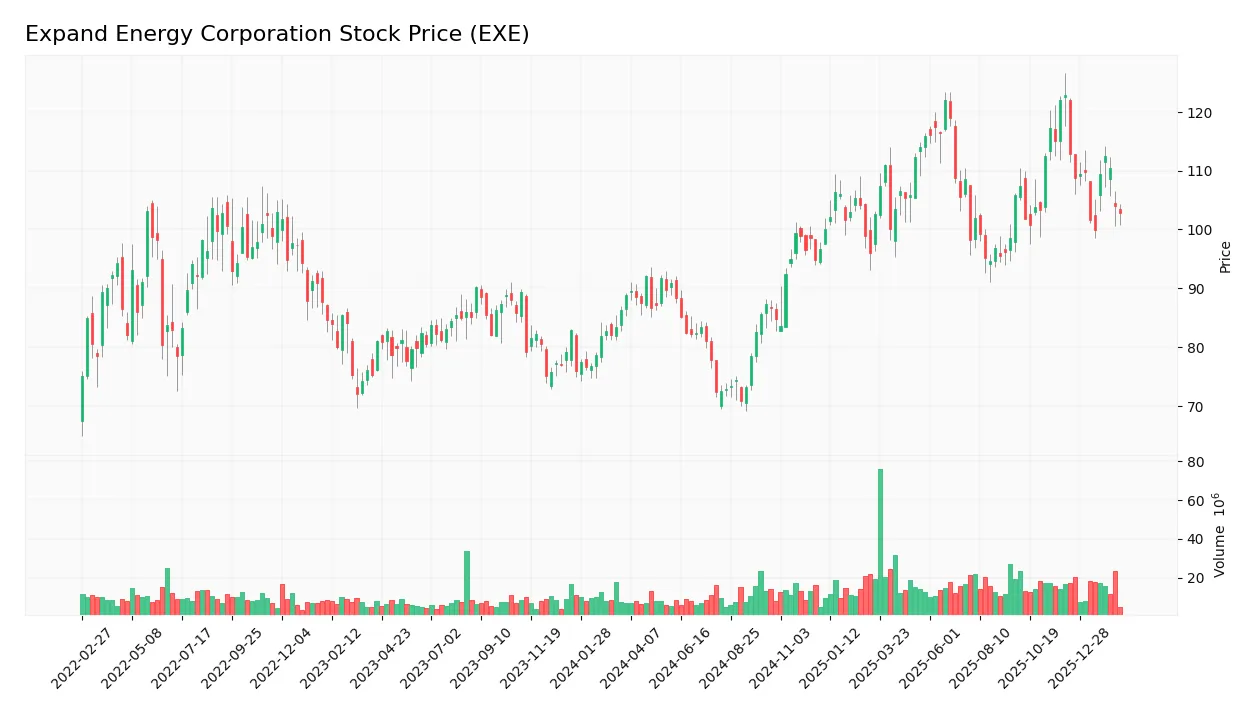
Trend Analysis
Over the past 12 months, EXE’s stock price rose 15.67%, indicating a bullish trend with decelerating momentum. The price ranged from a low of 70.84 to a high of 122.86, with volatility measured by a 12.66 standard deviation. Recent weeks show a negative 16.37% change, signaling short-term weakness.
Volume Analysis
Trading volume for EXE is increasing, with buyers accounting for 57.49% overall. However, the recent three-month period shows seller dominance at 63.64%, with declining buyer participation. This shift suggests weakening buying interest and rising selling pressure in the near term.
Target Prices
Analysts set a clear target consensus for Expand Energy Corporation, indicating solid growth expectations.
| Target Low | Target High | Consensus |
|---|---|---|
| 126 | 150 | 140.78 |
The target range reflects confidence in EXE’s upside potential, with a consensus near 141 signaling strong market optimism.

Don’t Let Luck Decide Your Entry Point
Optimize your entry points with our advanced ProRealTime indicators. You’ll get efficient buy signals with precise price targets for maximum performance. Start outperforming now!
Analyst & Consumer Opinions
This section reviews Expand Energy Corporation’s recent analyst ratings and consumer feedback to gauge market sentiment.
Stock Grades
Here is the latest summary of Expand Energy Corporation’s stock grades from leading financial firms:
| Grading Company | Action | New Grade | Date |
|---|---|---|---|
| Piper Sandler | Maintain | Overweight | 2026-01-28 |
| Barclays | Maintain | Overweight | 2026-01-21 |
| Stephens & Co. | Maintain | Overweight | 2026-01-20 |
| Jefferies | Maintain | Buy | 2026-01-08 |
| UBS | Maintain | Buy | 2026-01-08 |
| Bernstein | Maintain | Outperform | 2026-01-05 |
| Citigroup | Maintain | Buy | 2025-12-19 |
| Mizuho | Maintain | Outperform | 2025-12-12 |
| UBS | Maintain | Buy | 2025-12-12 |
| Piper Sandler | Maintain | Overweight | 2025-11-18 |
Consensus data shows the majority of analysts rate the stock as a Buy, with no Sell or Strong Sell opinions. This consistent positive outlook suggests stable confidence in the company’s performance.
Consumer Opinions
Consumers express mixed feelings about Expand Energy Corporation, reflecting its evolving market position and service reliability.
| Positive Reviews | Negative Reviews |
|---|---|
| “Reliable energy supply with minimal outages.” | “Customer service response times are slow.” |
| “Competitive pricing compared to local providers.” | “Billing errors occur more frequently than expected.” |
| “Easy-to-use online platform for account management.” | “Limited renewable energy options offered.” |
Overall, customers appreciate Expand Energy’s reliability and competitive pricing. However, recurring complaints about customer service delays and billing accuracy signal areas needing urgent improvement.
Risk Analysis
Here is a summary of key risks facing Expand Energy Corporation, highlighting likelihood and potential impact:
| Category | Description | Probability | Impact |
|---|---|---|---|
| Financial Stability | Altman Z-Score in grey zone indicates moderate bankruptcy risk. | Medium | High |
| Liquidity | Current and quick ratios at zero flag severe liquidity concerns. | High | High |
| Profitability | ROE and ROIC at zero suggest weak capital efficiency. | Medium | Medium |
| Market Volatility | Low beta (0.45) reduces sensitivity to market swings but limits upside. | Low | Low |
| Interest Coverage | Negative interest coverage signals difficulty servicing debt. | Medium | High |
| Industry Cyclicality | Exposure to oil and gas price fluctuations impacts earnings. | High | High |
Liquidity issues and debt servicing risk stand out as the most urgent red flags. Expand’s Altman Z-Score of 2.46 places it in the grey zone, implying caution. Despite a strong Piotroski score of 9, weak returns on invested capital and unfavorable current ratios expose vulnerabilities, especially in a volatile energy market.
Should You Buy Expand Energy Corporation?
Expand Energy Corporation appears to be in a moderate profitability phase with declining operational returns suggesting an eroding moat. Despite a substantial leverage profile and liquidity challenges, the overall B rating and very strong Piotroski score suggest a cautiously favorable investment profile.
Strength & Efficiency Pillars
Expand Energy Corporation shows operational strength with a solid gross margin of 80.4% and a net margin of 15.0%, reflecting effective cost management and profitability. Despite a zero return on equity (ROE) and return on invested capital (ROIC), the company maintains favorable interest expense at -1.94%, indicating some financial flexibility. However, the lack of available WACC and declining ROIC trend limits conclusions about value creation. Operational margins remain the key positive drivers amid mixed efficiency signals.
Weaknesses and Drawbacks
Expand Energy is in the Altman Z-Score grey zone at 2.46, indicating moderate bankruptcy risk and financial instability. This caution overshadows profitability metrics. The company suffers from unfavorable leverage ratios, including a weak current ratio and quick ratio, signaling liquidity concerns. Additionally, its price-to-earnings ratio is very unfavorable, suggesting valuation inefficiencies. Recent market behavior shows seller dominance (36.36% buyer volume), adding short-term pressure and risk to the stock’s near-term outlook.
Our Final Verdict about Expand Energy Corporation
Despite operational profitability and a very strong Piotroski score of 9, the grey zone Altman Z-Score of 2.46 flags moderate solvency risk. This makes Expand Energy a speculative investment at best. While the long-term trend is bullish, recent seller dominance advises a wait-and-see approach before committing capital. The profile might appear appealing for investors willing to accept elevated financial risk but remains too uncertain for conservative portfolios.
Disclaimer: This content is for informational purposes only and does not constitute financial, investment, or other professional advice. Investing in financial markets involves a significant risk of loss, and past performance is not indicative of future results.
Additional Resources
- Compared to Estimates, Expand Energy (EXE) Q4 Earnings: A Look at Key Metrics – Yahoo Finance (Feb 17, 2026)
- Expand Energy: Q4 Earnings Snapshot – KTEN (Feb 18, 2026)
- North America’s largest gas producer plans $1B debt cut, 20th straight dividend – Stock Titan (Feb 17, 2026)
- Expand Energy Swings To Q4 Profit – Nasdaq (Feb 17, 2026)
- Earnings Flash (EXE) Expand Energy Corporation Posts Q4 Adjusted EPS $2.00 per Share, vs. FactSet Est of $1.87 – marketscreener.com (Feb 17, 2026)
For more information about Expand Energy Corporation, please visit the official website: expandenergy.com