Home > Analyses > Utilities > Exelon Corporation
Exelon Corporation powers millions of homes and businesses across the U.S. and Canada, blending nuclear, renewable, and fossil fuels to deliver reliable electricity. As a dominant force in regulated electric utilities, Exelon combines innovation with a diverse energy portfolio that balances sustainability and efficiency. I’m intrigued by whether this industry giant’s strong fundamentals continue to support its current valuation and future growth prospects.
Table of contents
Business Model & Company Overview
Exelon Corporation, headquartered in Chicago and founded in 1999, stands as a dominant player in the regulated electric sector. It operates a diverse energy ecosystem, combining nuclear, fossil, wind, hydroelectric, biomass, and solar generation. This integrated approach supports a mission to deliver reliable, sustainable power across the United States and Canada, serving a broad customer base from municipalities to industrial clients.
Exelon’s revenue engine balances electricity generation with retail sales, natural gas marketing, and energy-related services. Its footprint spans the Americas, leveraging transmission and distribution networks to reach wholesale and retail markets. The company’s competitive advantage lies in its multifaceted operations and regulated infrastructure, creating a durable economic moat that positions it as a key shaper of North America’s energy future.
Financial Performance & Fundamental Metrics
I will analyze Exelon Corporation’s income statement, key financial ratios, and dividend payout policy to assess its core financial health and shareholder value.
Income Statement
The table below summarizes Exelon Corporation’s key income statement figures for the fiscal years 2021 through 2025, showing revenue, expenses, profits, and earnings per share.

| 2021 | 2022 | 2023 | 2024 | 2025 | |
|---|---|---|---|---|---|
| Revenue | 17.9B | 19.1B | 21.7B | 23.0B | 24.3B |
| Cost of Revenue | 10.9B | 11.0B | 12.8B | 13.6B | 13.1B |
| Operating Expenses | 4.3B | 4.7B | 4.9B | 5.1B | 19.1B |
| Gross Profit | 7.0B | 8.0B | 8.9B | 9.4B | 11.1B |
| EBITDA | 9.4B | 7.2B | 7.9B | 8.2B | 4.8B |
| EBIT | 2.9B | 3.9B | 4.4B | 4.6B | 0.0 |
| Interest Expense | 1.3B | 1.4B | 1.7B | 1.9B | -2.1B |
| Net Income | 1.7B | 2.2B | 2.3B | 2.5B | 2.8B |
| EPS | 1.74 | 2.20 | 2.34 | 2.45 | 2.74 |
| Filing Date | 2022-02-25 | 2023-02-14 | 2024-02-21 | 2025-02-12 | 2026-02-12 |
Income Statement Evolution
Exelon’s revenue rose steadily from 17.9B in 2021 to 24.3B in 2025, marking a 35% growth. Net income expanded even faster, up 62% to 2.8B, reflecting improved efficiency. Gross margins improved to 45.9%, while net margins increased nearly 20%, indicating better profitability despite a sharp EBIT margin decline to zero in 2025.
Is the Income Statement Favorable?
The 2025 income statement shows solid fundamentals with a favorable net margin of 11.4% and a strong gross margin near 46%. Interest expense at 8.7% remains manageable, supporting operating stability. However, the EBIT margin fell to zero, signaling increased operating pressures or non-cash charges. Overall, the income statement trends are favorable but warrant monitoring of EBIT dynamics.
Financial Ratios
The table below presents key financial ratios for Exelon Corporation over recent fiscal years, providing a snapshot of profitability, valuation, liquidity, leverage, and efficiency:
| Ratios | 2021 | 2022 | 2023 | 2024 | 2025 |
|---|---|---|---|---|---|
| Net Margin | 9.51% | 11.37% | 10.71% | 10.68% | 11.41% |
| ROE | 4.96% | 8.77% | 9.04% | 9.14% | 17.74% |
| ROIC | 2.18% | 3.18% | 3.62% | 3.93% | -53.76% |
| P/E | 23.64 | 19.64 | 15.36 | 15.35 | 15.92 |
| P/B | 1.17 | 1.72 | 1.39 | 1.40 | 2.82 |
| Current Ratio | 0.87 | 0.69 | 0.82 | 0.87 | 0.00 |
| Quick Ratio | 0.83 | 0.62 | 0.74 | 0.78 | 0.00 |
| D/E | 1.00 | 1.62 | 1.71 | 1.73 | 3.18 |
| Debt-to-Assets | 26.0% | 42.0% | 43.2% | 43.3% | 0.00% |
| Interest Coverage | 2.08 | 2.29 | 2.33 | 2.26 | -2.45 |
| Asset Turnover | 0.13 | 0.20 | 0.21 | 0.21 | 0.00 |
| Fixed Asset Turnover | 0.28 | 0.28 | 0.30 | 0.29 | 0.00 |
| Dividend Yield | 3.71% | 3.13% | 4.01% | 4.04% | 3.67% |
Evolution of Financial Ratios
Return on Equity (ROE) improved steadily, reaching 17.74% in 2025, signaling stronger profitability. The Current Ratio fluctuated slightly but fell to zero in 2025, indicating worsening liquidity. Debt-to-Equity Ratio increased sharply to 3.18 in 2025, reflecting higher leverage and risk. Profitability showed moderate gains while liquidity and leverage trends raise concerns.
Are the Financial Ratios Fovorable?
In 2025, profitability ratios like net margin (11.41%) and ROE (17.74%) are favorable, indicating efficient earnings generation. Liquidity ratios are unfavorable, with current and quick ratios at zero. Leverage is high at 3.18 debt-to-equity, and interest coverage is negative, signaling financial strain. Market multiples remain neutral, while dividend yield is favorable at 3.67%. Overall, the ratio profile is slightly unfavorable.
Shareholder Return Policy
Exelon Corporation pays dividends with a payout ratio around 58%, supporting a stable dividend per share near $1.60 and an annual yield of roughly 3.7%. The dividend coverage by free cash flow is negative, indicating potential strain from capital expenditures and debt service.
The company also engages in share buybacks, although elevated debt levels and negative free cash flow coverage highlight risks. This distribution strategy balances shareholder returns with reinvestment but may pressure long-term sustainability if cash flow challenges persist.
Score analysis
The radar chart below summarizes key financial scores that reflect various performance aspects of the company:

Exelon Corporation’s discounted cash flow score is favorable at 4, but profitability metrics like ROE and ROA score very low at 1 each. Debt-to-equity and valuation ratios remain unfavorable, signaling financial challenges.
Is the company in good financial health?
The Piotroski Score diagram illustrates the company’s financial strength based on nine key criteria:
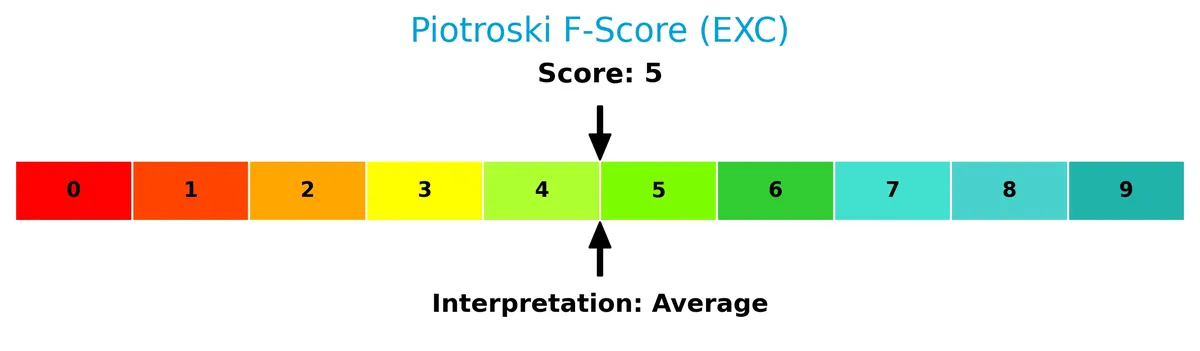
With a Piotroski Score of 5, Exelon shows average financial health. This middling score suggests moderate operational efficiency and stability but leaves room for improvement.
Competitive Landscape & Sector Positioning
This section examines Exelon Corporation’s strategic positioning within the regulated electric utilities sector. We will analyze its revenue by segment, key products, and main competitors. I will assess whether Exelon holds a competitive advantage over its peers based on its operational scope and market presence.
Strategic Positioning
Exelon Corporation operates a diversified portfolio across regulated electric utilities in key U.S. regions, with significant revenue from Commonwealth Edison, Pepco Holdings, and Baltimore Gas & Electric. Its integrated energy generation and delivery model spans nuclear to renewables, emphasizing stable, regulated markets in the U.S. and Canada.
Revenue by Segment
This pie chart illustrates Exelon Corporation’s revenue breakdown by business segment for the fiscal year 2025, highlighting the contributions of each operating unit.
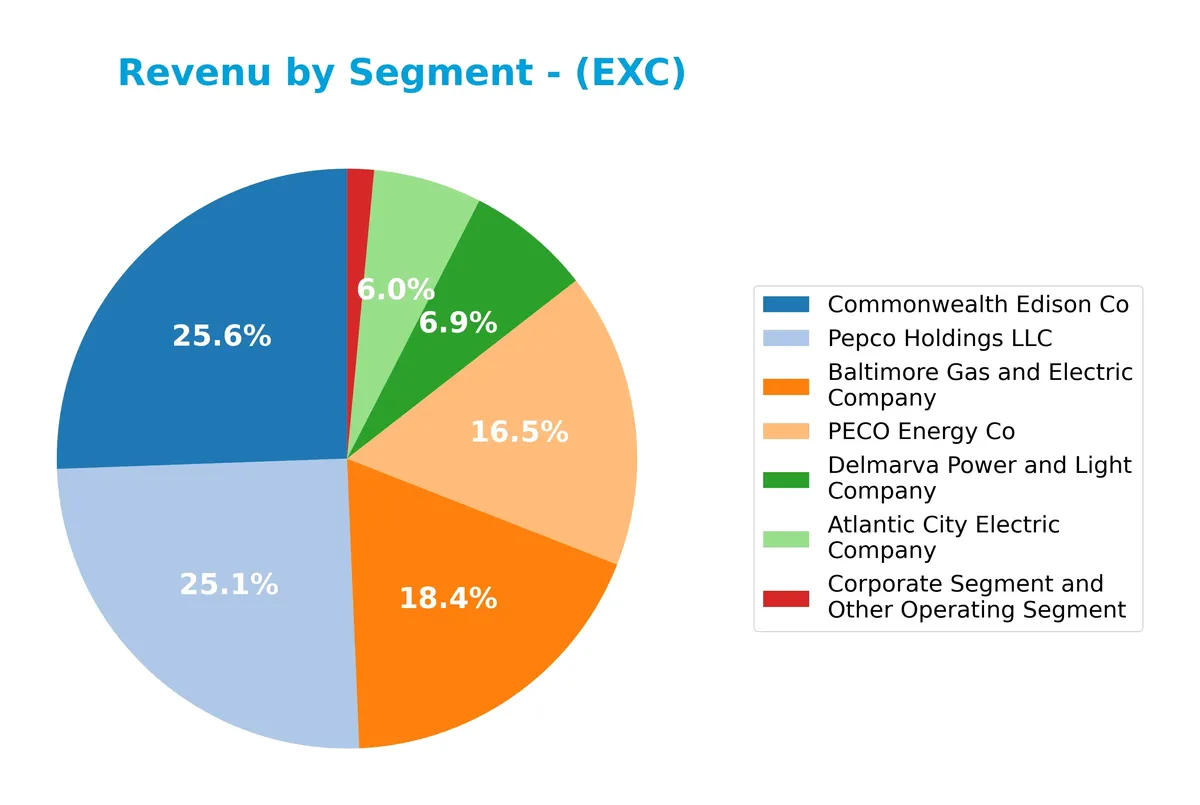
In 2025, Commonwealth Edison Co leads with $7.3B, followed closely by Pepco Holdings LLC at $7.1B and Baltimore Gas and Electric Company at $5.2B. PECO Energy Co and Delmarva Power and Light contribute $4.7B and $2.0B respectively, showing stable mid-tier support. Atlantic City Electric remains smaller at $1.7B, while Corporate and Other is minimal at $424M. The revenue concentration in a few key utilities suggests moderate segment risk but steady operational focus.
Key Products & Brands
Exelon Corporation’s key products and brands span regulated electric utilities and corporate services, detailed as follows:
| Product | Description |
|---|---|
| Atlantic City Electric Company | Provides regulated electric utility services primarily in southern New Jersey. |
| Baltimore Gas and Electric Company | Offers regulated electric and gas utility services in the Baltimore, Maryland area. |
| Commonwealth Edison Co | Major regulated electric utility serving northern Illinois, including Chicago. |
| Delmarva Power and Light Company | Delivers regulated electric and natural gas services in Delaware and the eastern shore of Maryland. |
| PECO Energy Co | Regulated electric and natural gas utility serving southeastern Pennsylvania. |
| Pepco Holdings LLC | Operates regulated electric and natural gas utilities in the Washington, D.C. metropolitan area. |
| Corporate Segment and Other Operating Segment | Includes support services such as legal, IT, financial, engineering, and customer operations. |
Exelon’s portfolio centers on regulated electric and gas utilities across multiple U.S. regions. It also incorporates a corporate segment providing essential operational support, reflecting a diversified revenue base within regulated energy markets.
Main Competitors
There are 23 competitors in total, with the table below showing the top 10 leaders by market capitalization:
| Competitor | Market Cap. |
|---|---|
| NextEra Energy, Inc. | 169B |
| The Southern Company | 96B |
| Duke Energy Corporation | 91B |
| American Electric Power Company, Inc. | 62B |
| Dominion Energy, Inc. | 51B |
| Exelon Corporation | 44B |
| Xcel Energy Inc. | 44B |
| Entergy Corporation | 42B |
| Public Service Enterprise Group Incorporated | 40B |
| Consolidated Edison, Inc. | 36B |
Exelon ranks 6th among 23 competitors in the regulated electric sector. Its market cap equals 29.06% of the leader, NextEra Energy. Exelon sits below the average market cap of the top 10 competitors (67.5B) but above the sector median (34B). It maintains a 3.28% gap from the 5th-ranked Dominion Energy.
Comparisons with competitors
Check out how we compare the company to its competitors:
Does Exelon have a competitive advantage?
Exelon does not present a competitive advantage, as its ROIC significantly underperforms its WACC, indicating persistent value destruction and declining profitability. This unfavorable moat profile contrasts with typical industry benchmarks where positive spread signals value creation.
Looking ahead, Exelon’s diverse energy portfolio spanning nuclear, fossil, wind, and solar offers opportunities to capitalize on evolving energy markets and regulatory shifts. The company’s expansion in renewable energy and comprehensive service offerings could drive future growth despite current profitability challenges.
SWOT Analysis
This SWOT analysis highlights key internal and external factors shaping Exelon Corporation’s strategic position in 2026.
Strengths
- diversified energy mix across nuclear, fossil, and renewables
- stable net margin of 11.4%
- attractive dividend yield of 3.7%
Weaknesses
- negative ROIC at -54% signals value destruction
- high debt-to-equity ratio of 3.2
- poor liquidity ratios raise short-term risk
Opportunities
- growing demand for clean energy and renewables
- regulatory support for carbon reduction
- potential expansion in wholesale and retail markets
Threats
- regulatory changes increasing compliance costs
- volatile commodity prices impacting margins
- rising interest rates raising debt servicing costs
Exelon’s diversified portfolio and steady net margin provide a solid base. However, its negative ROIC and leverage pose material risks. Strategic focus should prioritize improving capital efficiency and managing debt while leveraging renewable growth trends.
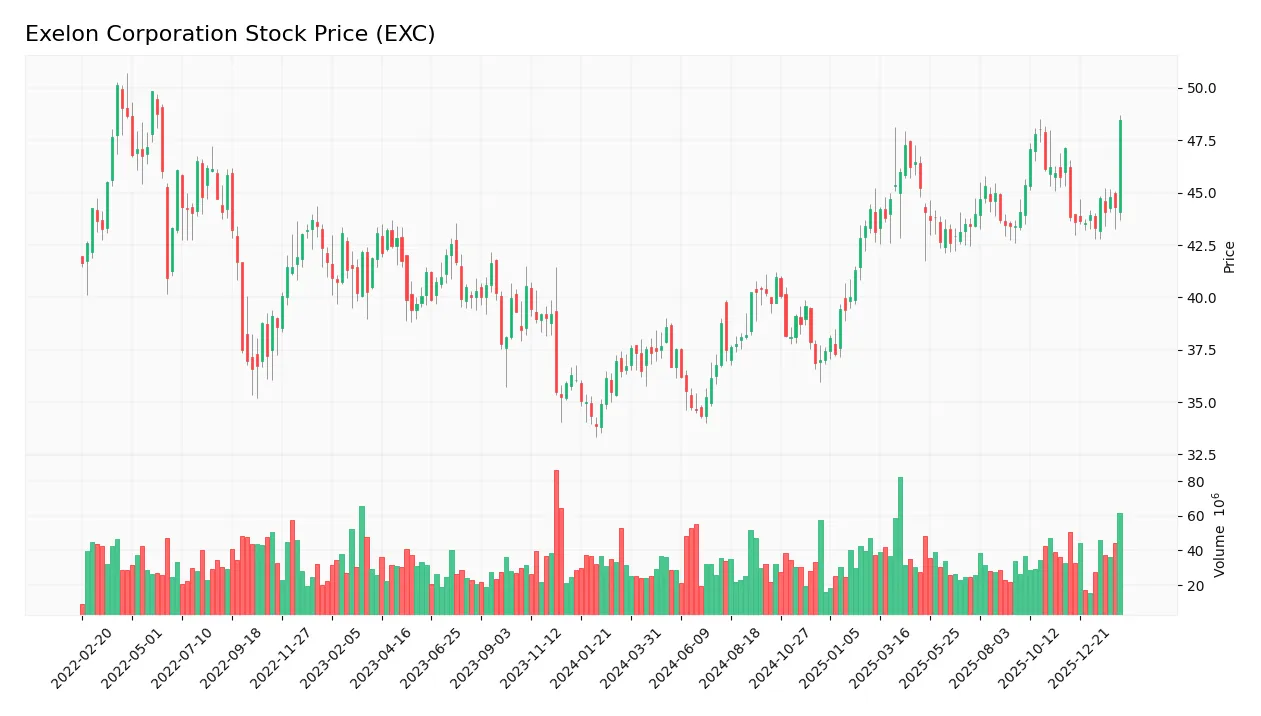
Stock Price Action Analysis
The weekly chart illustrates Exelon Corporation’s stock price movement over the past 12 months, highlighting key levels and trend dynamics:
Trend Analysis
Over the past 12 months, EXC’s stock price increased by 32.1%, indicating a strong bullish trend with acceleration. The price ranged from a low of 34.31 to a high of 48.48, showing meaningful upside momentum. Volatility is moderate with a 3.69 standard deviation.
Volume Analysis
In the last three months, trading volume shows a slight increase, with buyer volume representing 53% of activity. Buyer behavior remains neutral, suggesting balanced market participation without strong directional conviction. This points to steady investor interest amid stable sentiment.
Target Prices
Analysts set a clear target consensus for Exelon Corporation, indicating measured optimism.
| Target Low | Target High | Consensus |
|---|---|---|
| 39 | 57 | 50.27 |
The target range from 39 to 57 shows moderate confidence in upside potential. The consensus near 50 suggests a balanced outlook among analysts.

Don’t Let Luck Decide Your Entry Point
Optimize your entry points with our advanced ProRealTime indicators. You’ll get efficient buy signals with precise price targets for maximum performance. Start outperforming now!
Analyst & Consumer Opinions
This section examines the latest analyst ratings and consumer feedback on Exelon Corporation’s performance and reputation.
Stock Grades
Here is the latest verified grading summary from leading financial institutions for Exelon Corporation (EXC):
| Grading Company | Action | New Grade | Date |
|---|---|---|---|
| Wells Fargo | Maintain | Overweight | 2026-02-13 |
| Scotiabank | Maintain | Sector Perform | 2026-02-13 |
| Mizuho | Maintain | Outperform | 2026-02-13 |
| BMO Capital | Maintain | Outperform | 2026-02-13 |
| Jefferies | Maintain | Buy | 2026-01-27 |
| Barclays | Maintain | Overweight | 2026-01-22 |
| Wells Fargo | Maintain | Overweight | 2026-01-20 |
| UBS | Maintain | Neutral | 2025-12-17 |
| JP Morgan | Maintain | Neutral | 2025-12-12 |
| Morgan Stanley | Maintain | Equal Weight | 2025-10-22 |
The consensus exhibits stability with most analysts maintaining positions between neutral and outperform. Buy-side support is solid but balanced by a comparable number of hold ratings, reflecting cautious optimism.
Consumer Opinions
Exelon Corporation sparks mixed reactions from its consumer base, reflecting both strong operational performance and areas needing improvement.
| Positive Reviews | Negative Reviews |
|---|---|
| Reliable energy supply with minimal outages. | Customer service response times can be slow. |
| Competitive pricing compared to regional peers. | Billing system occasionally confusing. |
| Commitment to renewable energy initiatives praised. | Limited communication about service disruptions. |
Overall, consumers appreciate Exelon’s reliability and green energy focus. However, issues with customer service and billing transparency recur as notable concerns.
Risk Analysis
The table below summarizes key risks facing Exelon Corporation, assessing their likelihood and potential impact on the company:
| Category | Description | Probability | Impact |
|---|---|---|---|
| Financial Health | Negative ROIC (-53.76%) signals poor capital efficiency. | Medium | High |
| Liquidity | Current and quick ratios at 0 indicate critical short-term risk. | High | High |
| Leverage | Debt-to-equity ratio of 3.18 is significantly above industry norms. | High | Medium |
| Profitability | Favorable net margin (11.41%) supports earnings stability. | Medium | Medium |
| Interest Coverage | Negative interest coverage points to potential difficulties servicing debt. | Medium | High |
| Market Volatility | Low beta (0.44) reduces stock price sensitivity to market swings. | Low | Low |
I see liquidity risk as the most urgent concern due to zero current and quick ratios—this is a red flag for solvency. High leverage amplifies vulnerability to rising interest rates. Despite solid margins, negative ROIC undermines value creation, suggesting inefficient asset use. Investors should weigh these risks carefully against industry benchmarks before committing capital.
Should You Buy Exelon Corporation?
Exelon appears to be facing a very unfavorable moat with declining profitability and value destruction. Despite manageable leverage concerns, its profitability profile remains weak, reflecting average operational efficiency. The overall rating is a cautious C, suggesting a challenging investment outlook.
Strength & Efficiency Pillars
Exelon Corporation posts a favorable net margin of 11.41% and a solid return on equity of 17.74%, signaling competent operational profit generation. However, its return on invested capital (ROIC) is deeply negative at -53.76%, well below the weighted average cost of capital (WACC) of 4.47%. This indicates the company is currently destroying value rather than creating it. Despite decent earnings efficiency, Exelon struggles to convert capital investments into sustainable returns, reflecting significant operational challenges.
Weaknesses and Drawbacks
Exelon faces notable headwinds with a debt-to-equity ratio of 3.18, signaling heavy leverage that could strain financial flexibility. The company’s liquidity ratios are critically weak, with both current and quick ratios at 0, raising red flags about short-term solvency. Additionally, interest coverage is negative, implying difficulty meeting debt expenses. Price multiples remain neutral, but these leverage and liquidity concerns elevate risk. The company’s financial structure may hinder resilience against market shocks or economic downturns.
Our Final Verdict about Exelon Corporation
Exelon demonstrates operational profitability but suffers from severe capital inefficiency and financial leverage risks. The lack of an available Altman Z-Score prevents a definitive solvency assessment, yet the combination of negative ROIC and poor liquidity suggests caution. Despite a bullish stock trend and moderate buyer dominance, these fundamental weaknesses may warrant a wait-and-see stance. The profile might appear speculative and too risky for conservative capital deployment.
Disclaimer: This content is for informational purposes only and does not constitute financial, investment, or other professional advice. Investing in financial markets involves a significant risk of loss, and past performance is not indicative of future results.
Additional Resources
- Exelon Corporation $EXC Shares Purchased by ING Groep NV – MarketBeat (Feb 13, 2026)
- Exelon: Not Just A Bet On AI Data Center Tailwinds, But On Electrification Overall (EXC) – Seeking Alpha (Feb 13, 2026)
- PJM backs 220-mile power line to keep electricity affordable in WV and PA – Stock Titan (Feb 13, 2026)
- Exelon Corporation (NASDAQ:EXC) Q4 2025 Earnings Call Transcript – Insider Monkey (Feb 13, 2026)
- Exelon Corporation (NASDAQ:EXC) Q4 2025 earnings call transcript – MSN (Feb 12, 2026)
For more information about Exelon Corporation, please visit the official website: exeloncorp.com