Home > Analyses > Utilities > Eversource Energy
Eversource Energy powers millions of homes and businesses across New England, quietly shaping daily life through reliable electric, gas, and water delivery. As a regulated utility giant, it combines traditional energy infrastructure with growing investments in solar power. Known for operational excellence and steady dividends, Eversource stands as a pillar in a stable yet evolving industry. The key question: can its solid fundamentals sustain growth amid shifting energy demands and market pressures?

Table of contents
Business Model & Company Overview
Eversource Energy, founded in 1973 and based in Springfield, Massachusetts, stands as a leading regulated electric utility holding company. It integrates electricity transmission, distribution, natural gas, and water services into a unified ecosystem serving 226K water customers alongside residential, commercial, and municipal clients across Connecticut, Massachusetts, and New Hampshire. The company’s evolution from Northeast Utilities to Eversource reflects its commitment to energy delivery and infrastructure.
Eversource generates revenue through a balanced mix of regulated electric distribution, transmission, natural gas, and water utilities, creating stable, recurring cash flows. Its strategic footprint in the Northeastern U.S. anchors its market position, supported by a diversified asset base and regulated pricing. This combination forms a robust economic moat, enabling Eversource to shape the future of energy delivery with reliability and scale.
Financial Performance & Fundamental Metrics
I analyze Eversource Energy’s income statement, key financial ratios, and dividend payout policy to gauge its operational strength and shareholder returns.
Income Statement
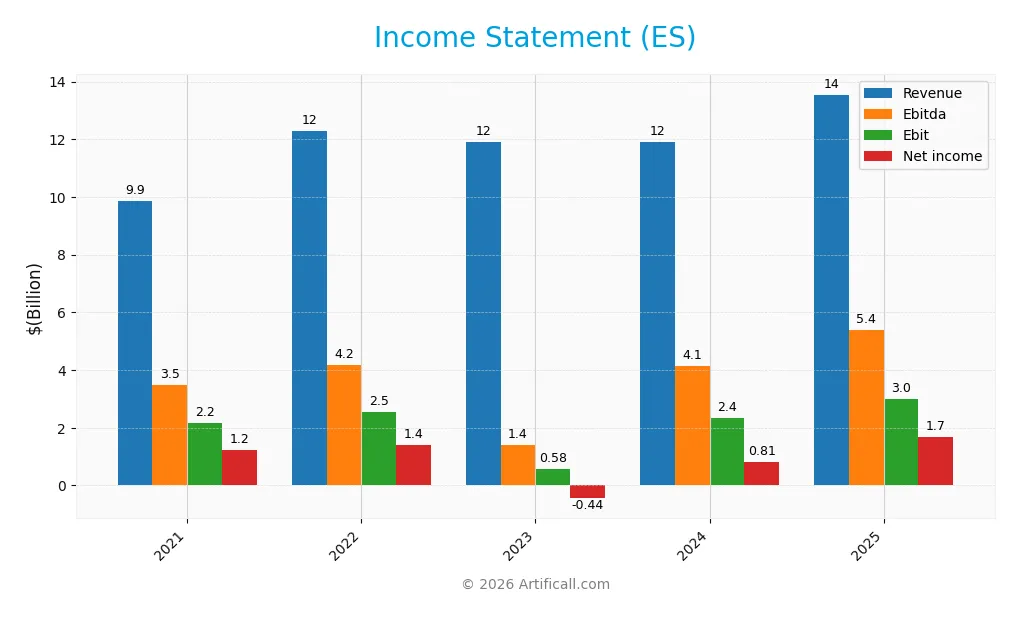
The table below summarizes Eversource Energy’s key income statement figures for fiscal years 2021 through 2025, illustrating revenue growth and profitability trends.
| 2021 | 2022 | 2023 | 2024 | 2025 | |
|---|---|---|---|---|---|
| Revenue | 9.86B | 12.29B | 11.91B | 11.90B | 13.55B |
| Cost of Revenue | 5.11B | 6.88B | 7.06B | 8.20B | 9.47B |
| Operating Expenses | 2.76B | 3.21B | 2.45B | 1.00B | 1.09B |
| Gross Profit | 4.75B | 5.41B | 4.85B | 3.70B | 4.08B |
| EBITDA | 3.49B | 4.19B | 1.40B | 4.13B | 5.39B |
| EBIT | 2.15B | 2.54B | 580M | 2.36B | 3.00B |
| Interest Expense | 582M | 678M | 855M | 1.11B | 1.24B |
| Net Income | 1.22B | 1.40B | -442M | 812M | 1.69B |
| EPS | 3.55 | 4.05 | -1.27 | 2.27 | 4.56 |
| Filing Date | 2022-02-17 | 2023-02-15 | 2024-02-14 | 2025-02-14 | 2026-02-17 |
Income Statement Evolution
Eversource Energy’s revenue rose steadily from 9.9B in 2021 to 13.5B in 2025, reflecting a 37% increase over five years. Net income recovered sharply from a loss in 2023 to 1.7B in 2025, doubling from 2024. Margins improved notably, with gross margin at 30.1% and net margin expanding to 12.5%, signaling operational efficiency gains.
Is the Income Statement Favorable?
The 2025 income statement reveals strong fundamentals: EBIT margin stands at a healthy 22.1%, supported by controlled operating expenses growing in line with revenue. Interest expense remains a moderate 9.2% of revenue, posing limited financial strain. Net income growth of 83% year-over-year and EPS doubling underscore robust profitability, confirming a broadly favorable income profile.
Financial Ratios
The table below presents key financial ratios for Eversource Energy (ES) from 2021 to 2025, illustrating profitability, valuation, liquidity, leverage, and operational efficiency:
| Ratios | 2021 | 2022 | 2023 | 2024 | 2025 |
|---|---|---|---|---|---|
| Net Margin | 12% | 11% | -4% | 7% | 12% |
| ROE | 8% | 9% | -3% | 5% | 0% |
| ROIC | 3% | 3% | 5% | 3% | 0% |
| P/E | 26 | 21 | -49 | 25 | 15 |
| P/B | 2.1 | 1.9 | 1.5 | 1.4 | 0.001 |
| Current Ratio | 0.56 | 0.62 | 0.67 | 0.76 | 0.65 |
| Quick Ratio | 0.51 | 0.57 | 0.59 | 0.67 | 0.59 |
| D/E | 1.38 | 1.48 | 1.89 | 1.94 | 1.27 |
| Debt-to-Assets | 42% | 43% | 48% | 49% | 47% |
| Interest Coverage | 3.4x | 3.2x | 2.8x | 2.4x | 2.4x |
| Asset Turnover | 0.20 | 0.23 | 0.21 | 0.20 | 0.0002 |
| Fixed Asset Turnover | 0.30 | 0.34 | 0.30 | 0.29 | 0.0003 |
| Dividend Yield | 2.6% | 3.0% | 4.3% | 4.9% | 54% |
Evolution of Financial Ratios
From 2021 to 2025, Eversource Energy’s Return on Equity (ROE) shows significant volatility, bottoming out negative before a modest recovery to near zero in 2025. The Current Ratio remained below 1.0, indicating persistent liquidity constraints with values fluctuating between 0.56 and 0.76. Debt-to-Equity ratio peaked above 1.9 in 2024 before easing to 1.27 in 2025, signaling some deleveraging but still elevated leverage.
Are the Financial Ratios Fovorable?
In 2025, profitability metrics like net margin (12.49%) and price-to-earnings ratio (14.75) are favorable, but ROE (0.01%) and ROIC (0.0%) are unfavorable, suggesting limited shareholder returns relative to equity and invested capital. Liquidity ratios (current ratio 0.65, quick ratio 0.59) remain unfavorable, reflecting tight short-term financial flexibility. Leverage is elevated (debt-to-equity 1.27) with neutral interest coverage (2.4), and asset turnover ratios are very low, all pointing to operational efficiency challenges. Overall, the ratio profile is slightly unfavorable.
Shareholder Return Policy
Eversource Energy maintains a dividend payout with a notably high ratio of 792% in 2025, supported by a strong dividend per share trend and an exceptional yield of 53.7%. The coverage by free cash flow appears solid, but the unusually elevated payout ratio signals potential sustainability risks.
The company also engages in share buybacks, complementing its cash returns to shareholders. While this aggressive distribution approach offers immediate returns, it raises concerns about long-term value creation given the payout’s scale relative to earnings.
Score analysis
The following radar chart visualizes key financial scores for Eversource Energy, highlighting strengths and weaknesses across valuation and profitability metrics:
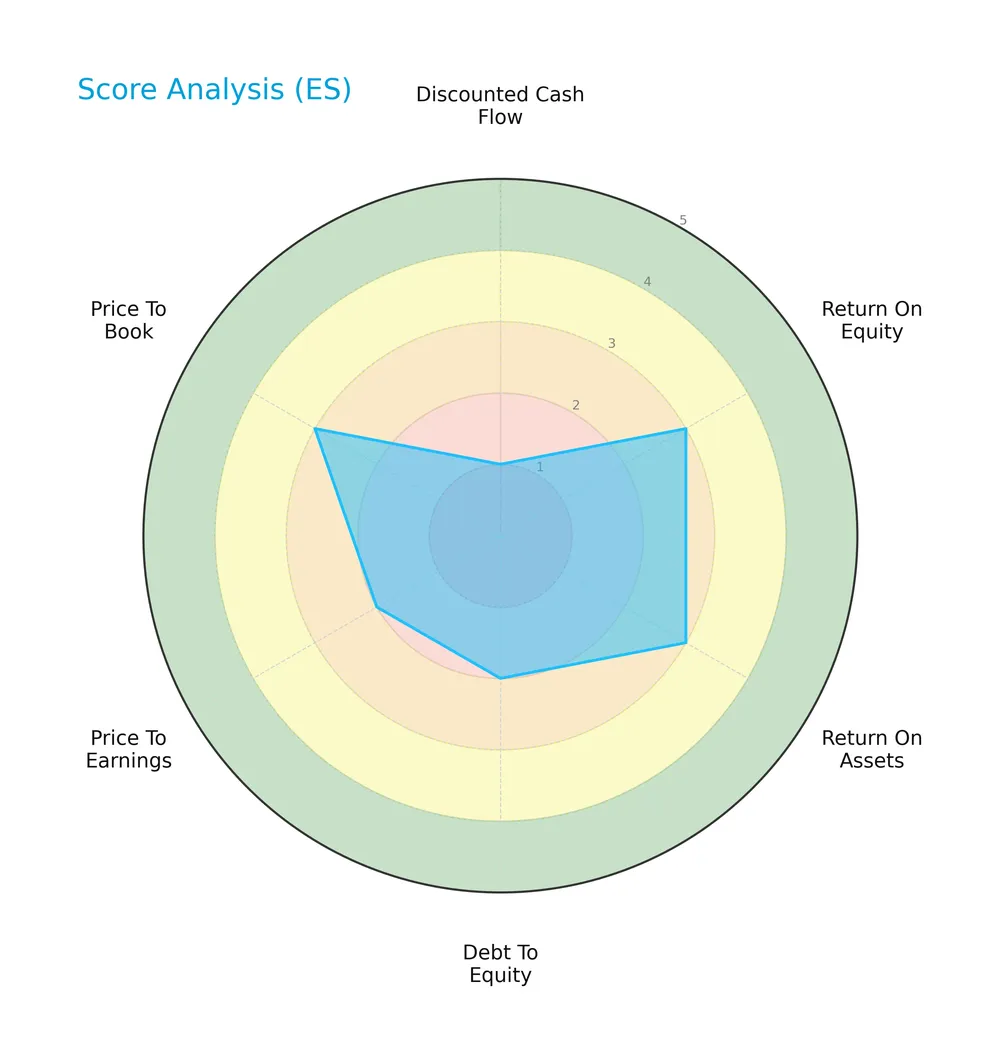
Eversource Energy scores low on discounted cash flow (1) and debt-to-equity (2), indicating valuation concerns and leverage risks. Return on equity and assets are moderate (3), while price-to-earnings is unfavorable (2). Price-to-book is moderate (3), reflecting mixed valuation signals.
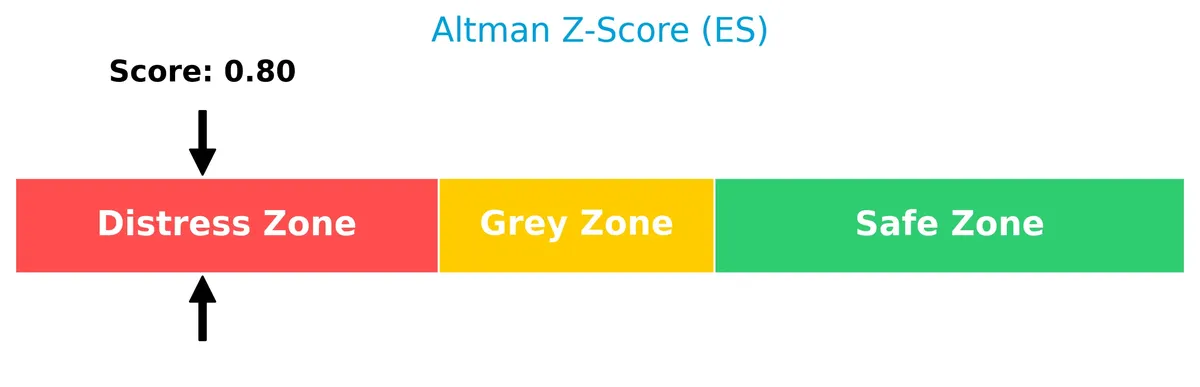
Analysis of the company’s bankruptcy risk
The Altman Z-Score places Eversource Energy firmly in the distress zone, signaling a significant risk of financial distress and potential bankruptcy:
Is the company in good financial health?
The Piotroski Score diagram illustrates Eversource Energy’s financial health based on nine fundamental criteria:

With a Piotroski Score of 4, the company exhibits average financial strength. This score suggests moderate operational efficiency and profitability but leaves room for improvement in financial robustness.
Competitive Landscape & Sector Positioning
This section examines Eversource Energy’s strategic positioning within the regulated electric sector. It covers revenue distribution, key products, and principal competitors. I will assess whether Eversource holds a competitive advantage over its peers.
Strategic Positioning
Eversource Energy maintains a diversified product portfolio across electric distribution (10B), transmission (2.5B), natural gas distribution (2.6B), and water services (250M). Its geographic exposure concentrates in Connecticut, Massachusetts, and New Hampshire, focusing on regulated utility markets in the US Northeast.
Revenue by Segment
This pie chart presents Eversource Energy’s revenue distribution by segment for the fiscal year 2025, illustrating the company’s business composition over the latest full year.
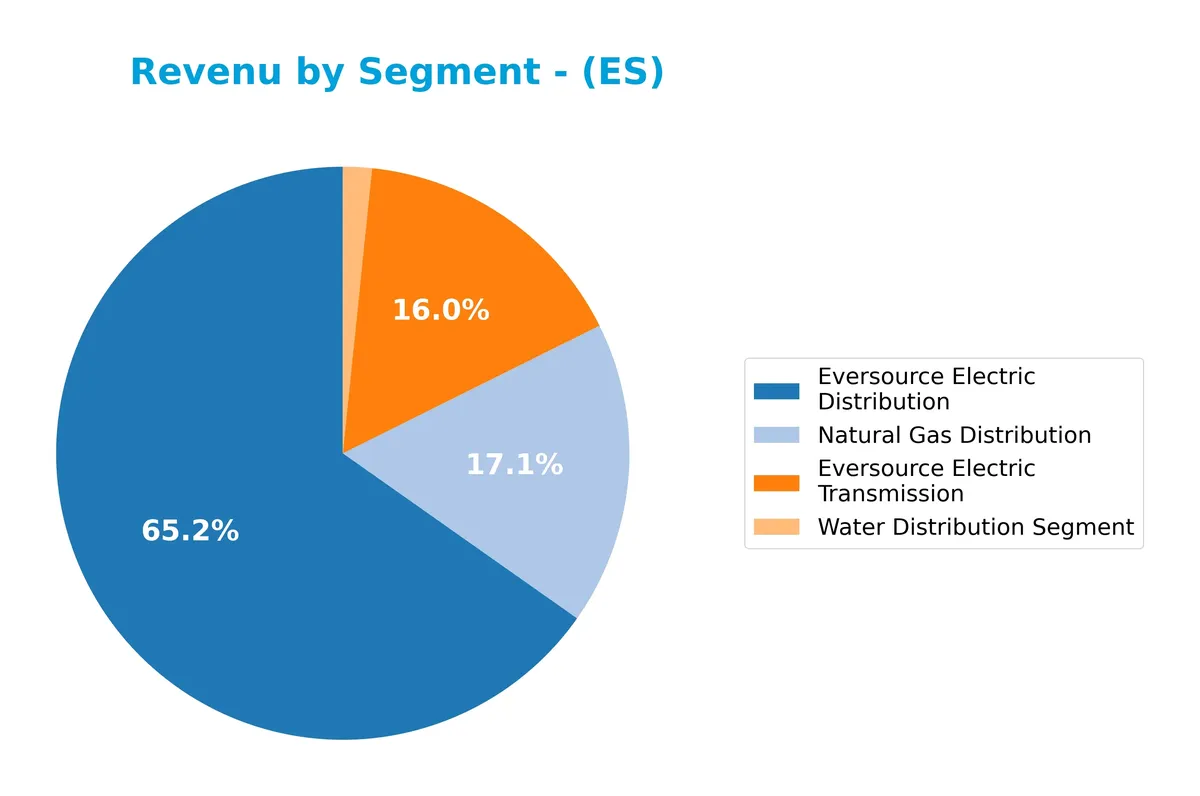
Electric Distribution dominates with $10B revenue, reflecting steady growth and the company’s core focus. Transmission and Natural Gas Distribution contribute $2.5B and $2.6B respectively, showing balanced diversification. Water Distribution remains a minor segment at $250M. The 2025 data suggest accelerating momentum in Electric Distribution, reinforcing its role as the primary revenue driver amid stable contributions from other segments.
Key Products & Brands
The table below outlines Eversource Energy’s primary business segments and their key offerings:
| Product | Description |
|---|---|
| Eversource Electric Distribution | Transmission and distribution of electricity to residential, commercial, and industrial customers in CT, MA, and NH. |
| Eversource Electric Transmission | High-voltage electric transmission services supporting regional power grid reliability and capacity. |
| Natural Gas Distribution | Distribution of natural gas to residential, commercial, and industrial users within regulated territories. |
| Water Distribution Segment | Provision of regulated water services to approximately 226,000 customers in the company’s service areas. |
Eversource Energy focuses on regulated utility services across electricity, natural gas, and water. Its product mix reflects a stable, essential-services portfolio concentrated in the Northeastern US.
Main Competitors
Eversource Energy faces 23 competitors in the Regulated Electric sector, with the table listing the top 10 leaders by market capitalization:
| Competitor | Market Cap. |
|---|---|
| NextEra Energy, Inc. | 169B |
| The Southern Company | 96B |
| Duke Energy Corporation | 91B |
| American Electric Power Company, Inc. | 62B |
| Dominion Energy, Inc. | 51B |
| Exelon Corporation | 44B |
| Xcel Energy Inc. | 44B |
| Entergy Corporation | 42B |
| Public Service Enterprise Group Incorporated | 40B |
| Consolidated Edison, Inc. | 36B |
Eversource Energy ranks 17th among 23 competitors. Its market cap is 16.3% of the leader, NextEra Energy. The company sits below both the average market cap of the top 10 competitors (67.5B) and the sector median (34B). The gap to the next competitor above is approximately +5.23%, indicating a modest distance from its closest rival.
Comparisons with competitors
Check out how we compare the company to its competitors:
Does Eversource Energy have a competitive advantage?
Eversource Energy operates in regulated electric and water utilities with stable revenues and favorable income margins, but its declining ROIC versus WACC signals value erosion. The company’s core segments benefit from regulatory protections, supporting steady cash flows despite competitive pressures.
Looking ahead, Eversource’s involvement in solar power and expanding natural gas distribution presents growth opportunities in clean energy markets. However, the deteriorating capital efficiency warrants caution as management seeks to leverage new infrastructure investments for future returns.
SWOT Analysis
This analysis highlights Eversource Energy’s core internal and external factors shaping its strategic position.
Strengths
- Regulated utility with stable cash flows
- Strong revenue and profit growth
- Favorable gross and EBIT margins
Weaknesses
- Low current and quick ratios signal liquidity risk
- Negative ROIC vs. WACC indicates value destruction
- High debt-to-equity ratio raises financial leverage concerns
Opportunities
- Expansion in renewable energy and solar facilities
- Growing demand for clean water services
- Regulatory incentives for green energy investments
Threats
- Regulatory and environmental compliance costs
- Rising interest expense pressure
- Competition from alternative energy providers
Eversource’s strengths in regulated markets and growth contrast with financial leverage and declining returns. The company must balance investment in renewables with prudent capital management to protect shareholder value.
Stock Price Action Analysis
The following weekly stock chart illustrates Eversource Energy’s price movements and volatility over the past 100 weeks:
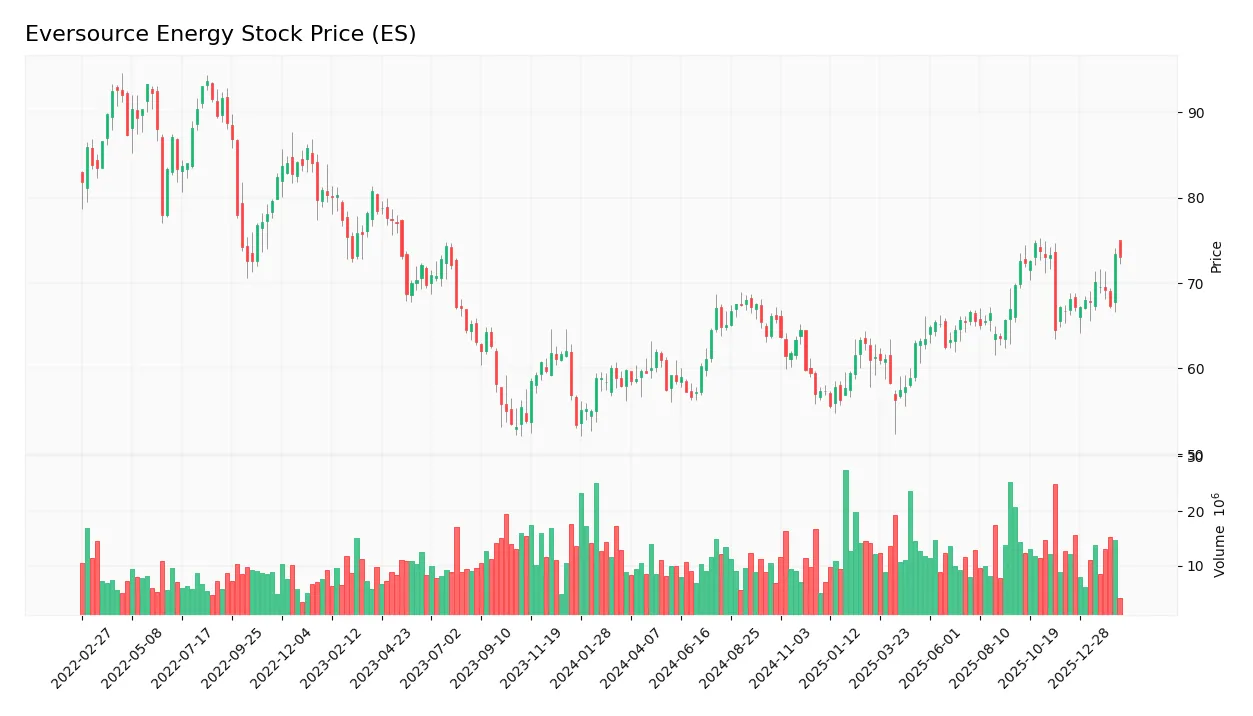
Trend Analysis
Over the past 12 months, Eversource Energy’s stock gained 22.19%, indicating a bullish trend with accelerating momentum. The price ranged between 55.63 and 74.67, showing solid upward movement with a 4.7% standard deviation, signaling moderate volatility in the rally.
Volume Analysis
Over the last three months, trading volume has increased but shifted toward seller dominance, with buyers accounting for 40.47%. This slight seller control suggests cautious investor sentiment despite rising volume, possibly reflecting profit-taking or hesitation amid recent price gains.
Target Prices
Analysts set a target price consensus that signals moderate upside potential for Eversource Energy.
| Target Low | Target High | Consensus |
|---|---|---|
| 60 | 80 | 72.5 |
The target range reflects cautious optimism, with a consensus price indicating roughly 10-15% upside from recent levels.

Don’t Let Luck Decide Your Entry Point
Optimize your entry points with our advanced ProRealTime indicators. You’ll get efficient buy signals with precise price targets for maximum performance. Start outperforming now!
Analyst & Consumer Opinions
This section reviews analyst ratings and consumer feedback to provide insights on Eversource Energy’s market perception.
Stock Grades
Here are the recent verified analyst grades for Eversource Energy from leading financial institutions:
| Grading Company | Action | New Grade | Date |
|---|---|---|---|
| UBS | Maintain | Neutral | 2025-12-17 |
| JP Morgan | Maintain | Underweight | 2025-12-12 |
| Janney Montgomery Scott | Upgrade | Buy | 2025-11-24 |
| Scotiabank | Maintain | Sector Underperform | 2025-11-20 |
| Mizuho | Downgrade | Neutral | 2025-11-20 |
| Wells Fargo | Downgrade | Equal Weight | 2025-11-20 |
| BMO Capital | Maintain | Market Perform | 2025-11-06 |
| UBS | Downgrade | Neutral | 2025-11-06 |
| Scotiabank | Maintain | Sector Underperform | 2025-11-06 |
| Mizuho | Maintain | Outperform | 2025-10-27 |
Grades show a cautious stance with multiple downgrades to neutral or equal weight. The consensus leans toward a hold, reflecting mixed views on near-term prospects.
Consumer Opinions
Eversource Energy garners mixed consumer sentiment, reflecting its critical utility role and service challenges.
| Positive Reviews | Negative Reviews |
|---|---|
| Reliable power supply with minimal outages | Customer service response times are slow |
| Transparent billing practices | Occasional billing errors and overcharges |
| Proactive communication during storms | Limited online account management features |
Overall, consumers praise Eversource Energy’s reliability and clear billing. However, slow customer service and billing issues remain persistent concerns. Addressing these could strengthen customer loyalty significantly.
Risk Analysis
Below is a summary of key risks facing Eversource Energy, highlighting their likelihood and potential impact:
| Category | Description | Probability | Impact |
|---|---|---|---|
| Financial Health | Altman Z-Score in distress zone signals bankruptcy risk | High | High |
| Liquidity | Low current ratio (0.65) and quick ratio (0.59) suggest weak short-term liquidity | Medium | Medium |
| Leverage | Elevated debt-to-equity ratio (1.27) increases financial risk | Medium | Medium |
| Profitability | Unfavorable ROE (0.01%) and ROIC (0.0%) indicate poor capital returns | Medium | High |
| Market Volatility | Beta of 0.79 shows moderate sensitivity to market swings | Low | Low |
| Regulatory | Exposure to regulated electric and gas sectors limits pricing flexibility | Medium | Medium |
Eversource’s bankruptcy risk stands out as the most alarming signal. The Altman Z-Score below 1.8 places it firmly in the distress zone, a red flag historically linked to financial distress in utilities. Liquidity strains and weak returns compound this risk. However, its regulated business model somewhat buffers against market volatility. Vigilance is essential given these headwinds.
Should You Buy Eversource Energy?
Eversource Energy appears to be grappling with declining profitability and a deteriorating competitive moat, suggesting value destruction. Despite a manageable leverage profile, its financial health signals caution, supported by a B- rating and distress-zone bankruptcy risk indicators.
Strength & Efficiency Pillars
Eversource Energy posts a robust net margin of 12.49%, demonstrating solid operational efficiency amid challenging conditions. The company’s gross margin stands at 30.13%, and EBIT margin at 22.06%, underscoring disciplined cost management. Revenue grew 13.83% in the past year, supporting favorable income dynamics. However, with a ROIC of 0.0% below the WACC of 2.98%, Eversource is currently a value destroyer, unable to generate returns above its capital costs. Operational margins remain the key strength despite broader value concerns.
Weaknesses and Drawbacks
Eversource is in financial distress, with an Altman Z-Score of 0.80 signaling a high bankruptcy risk. This undermines all profitability metrics and demands caution. The balance sheet reveals a high debt-to-equity ratio of 1.27 and weak liquidity, with a current ratio of 0.65 and quick ratio of 0.59, heightening solvency concerns. Valuation appears reasonable with a P/E of 14.75, but these positives are overshadowed by severe leverage and low returns. Recent slight seller dominance at 40.47% signals market caution.
Our Final Verdict about Eversource Energy
Despite operational margin strength and favorable revenue growth, Eversource’s Altman Z-Score in the distress zone makes its financial profile highly speculative. The solvency risk dominates, suggesting the company is too risky for conservative capital. Investors might consider waiting for signs of improved balance sheet stability before viewing it as a viable long-term opportunity.
Disclaimer: This content is for informational purposes only and does not constitute financial, investment, or other professional advice. Investing in financial markets involves a significant risk of loss, and past performance is not indicative of future results.
Additional Resources
- Wells Fargo Upgrades Eversource Energy (ES) – Nasdaq (Feb 17, 2026)
- Decoding Eversource Energy (ES): A Strategic SWOT Insight – GuruFocus (Feb 18, 2026)
- Eversource Energy (ES) Beats Q4 Earnings Estimates – Yahoo Finance (Feb 12, 2026)
- Eversource Energy (ES) Shares Climb Following 2025 Earnings Beat and New Long-Term Growth Targets – AlphaStreet News (Feb 14, 2026)
- What analyst projections for key metrics reveal about Eversource (ES) Q4 earnings – MSN (Feb 17, 2026)
For more information about Eversource Energy, please visit the official website: eversource.com