Home > Analyses > Utilities > Evergy, Inc.
Evergy, Inc. powers over 1.6 million homes and businesses across Kansas and Missouri, shaping daily life with reliable electricity. The company stands out in the regulated electric sector, blending traditional coal and natural gas plants with growing renewable assets like wind and solar. Known for its vast transmission network and steady dividend payouts, Evergy commands a critical role in regional energy supply. The key question: does Evergy’s current strategy and financial health support sustainable growth amid evolving energy markets?

Table of contents
Business Model & Company Overview
Evergy, Inc. operates as a regulated electric utility headquartered in Kansas City, Missouri. Since its 2017 incorporation, it has built a vast energy ecosystem serving 1.6M customers across Kansas and Missouri. Its integrated operations span generation, transmission, and distribution, leveraging diverse energy sources including coal, hydroelectric, renewables, and natural gas. This broad infrastructure underpins its dominant role in the regional utilities sector.
The company’s revenue engine balances steady cash flow from regulated electricity sales with a growing emphasis on renewable assets. Evergy manages 10,100 miles of transmission lines and nearly 53,000 miles of distribution lines, supporting residential, commercial, and industrial demand. Its foothold in crucial Midwest markets, combined with investments in sustainable energy, creates a durable economic moat that positions Evergy as a key player shaping the future of regulated electric utilities.
Financial Performance & Fundamental Metrics
I will analyze Evergy, Inc.’s income statement, key financial ratios, and dividend payout policy to assess its core financial health and shareholder value.
Income Statement
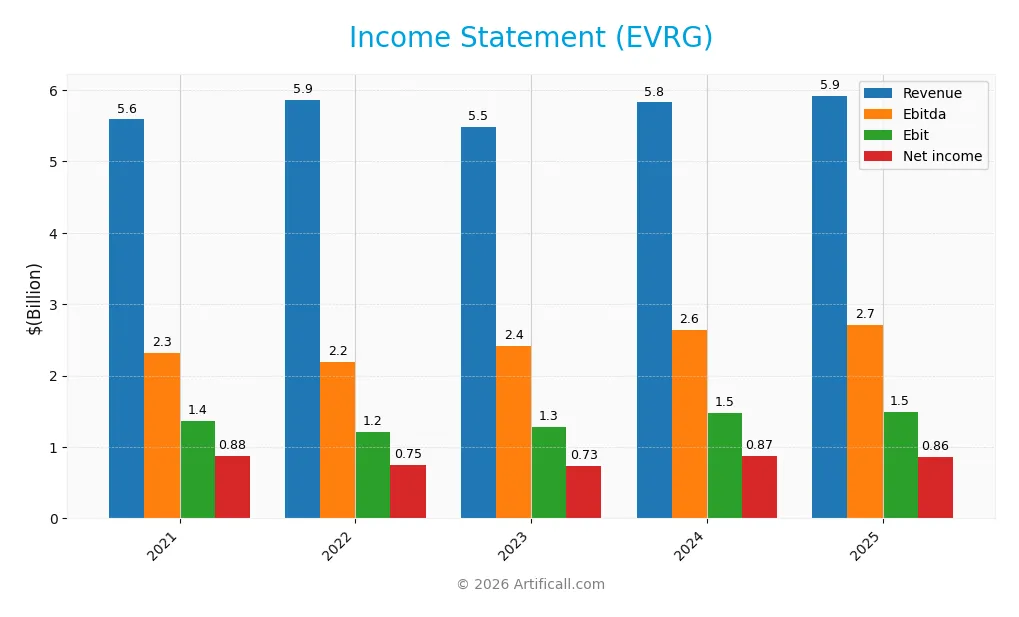
This table summarizes Evergy, Inc.’s key income statement figures for the fiscal years 2021 through 2025, highlighting revenue, expenses, and profitability metrics.
| 2021 | 2022 | 2023 | 2024 | 2025 | |
|---|---|---|---|---|---|
| Revenue | 5.59B | 5.86B | 5.49B | 5.82B | 5.92B |
| Cost of Revenue | 3.85B | 4.16B | 3.82B | 3.93B | 995M |
| Operating Expenses | 381M | 398M | 407M | 453M | 420M |
| Gross Profit | 1.74B | 1.70B | 1.67B | 1.90B | 4.97B |
| EBITDA | 2.32B | 2.19B | 2.42B | 2.64B | 2.71B |
| EBIT | 1.37B | 1.21B | 1.28B | 1.47B | 1.49B |
| Interest Expense | 373M | 404M | 526M | 563M | 616M |
| Net Income | 880M | 753M | 731M | 874M | 856M |
| EPS | 3.84 | 3.27 | 3.18 | 3.79 | 3.71 |
| Filing Date | 2022-02-25 | 2023-02-24 | 2023-12-31 | 2025-02-27 | 2026-02-19 |
Income Statement Evolution
Evergy’s revenue rose modestly by 1.65% in 2025 to $5.92B, continuing a neutral 5.96% growth trend since 2021. Gross profit surged 162%, lifting gross margins to a favorable 83.9%. EBIT increased slightly by 1.36%, supporting a stable EBIT margin near 25%. However, net income declined 3.6%, compressing net margins to 14.5%.
Is the Income Statement Favorable?
The 2025 income statement shows solid operational profitability with a robust gross margin and efficient expense control. Yet, interest expense at 10.4% of revenue weighs heavily on net income, causing a 3.6% net margin drop. Overall, the fundamentals appear mixed, as favorable margins coexist with weakening net income and earnings per share.
Financial Ratios
The table below presents key financial ratios for Evergy, Inc. from 2021 to 2025, providing insight into profitability, liquidity, leverage, and market valuation:
| Ratios | 2021 | 2022 | 2023 | 2024 | 2025 |
|---|---|---|---|---|---|
| Net Margin | 16% | 13% | 13% | 15% | 14% |
| ROE | 9.5% | 7.9% | 7.6% | 8.8% | 8.4% |
| ROIC | 4.4% | 4.4% | 4.2% | 4.5% | 11.3% |
| P/E | 17.9 | 19.2 | 16.8 | 16.2 | 19.5 |
| P/B | 1.7 | 1.5 | 1.3 | 1.4 | 1.6 |
| Current Ratio | 0.55 | 0.53 | 0.51 | 0.50 | 0.08 |
| Quick Ratio | 0.37 | 0.33 | 0.29 | 0.27 | 0.08 |
| D/E | 1.21 | 1.27 | 1.36 | 1.41 | 0.02 |
| Debt-to-Assets | 39% | 41% | 42% | 44% | 2% |
| Interest Coverage | 3.6x | 3.2x | 2.4x | 2.6x | 2.4x |
| Asset Turnover | 0.20 | 0.20 | 0.18 | 0.18 | 0.44 |
| Fixed Asset Turnover | 0.26 | 0.26 | 0.23 | 0.23 | 0.00 |
| Dividend Yield | 3.2% | 3.7% | 4.6% | 4.2% | 3.7% |
Evolution of Financial Ratios
Evergy’s Return on Equity (ROE) declined from 9.52% in 2021 to 8.37% in 2025, signaling slowing profitability. The Current Ratio sharply dropped from around 0.55 to 0.08, indicating deteriorating liquidity. Debt-to-Equity Ratio fell significantly from above 1.2 to 0.02, reflecting a strong deleveraging trend. Profit margins remained relatively stable, with a slight improvement in net margin.
Are the Financial Ratios Favorable?
In 2025, profitability shows mixed signals: a favorable net margin of 14.45% contrasts with an unfavorable ROE of 8.37%. Liquidity ratios, including Current and Quick, are unfavorable at 0.08, raising red flags. Low leverage ratios (Debt-to-Equity at 0.02) are favorable, while asset turnover is weak. Market valuation ratios remain neutral. Overall, the ratio profile is balanced between strengths and risks.
Shareholder Return Policy
Evergy, Inc. maintains a dividend payout ratio around 70%, with dividends steadily increasing from $2.17 to $2.66 per share over five years. The annual dividend yield ranges near 3.7%, supported by share buybacks; however, free cash flow coverage remains negative, signaling potential distribution risks.
This payout level, combined with moderate operating cash flow coverage, suggests a distribution strategy reliant on stable earnings rather than surplus cash. While consistent dividends and buybacks support shareholder returns, the negative free cash flow coverage warrants caution regarding sustainability over the long term.
Score analysis
The radar chart below illustrates Evergy, Inc.’s key financial metric scores for a comprehensive overview:
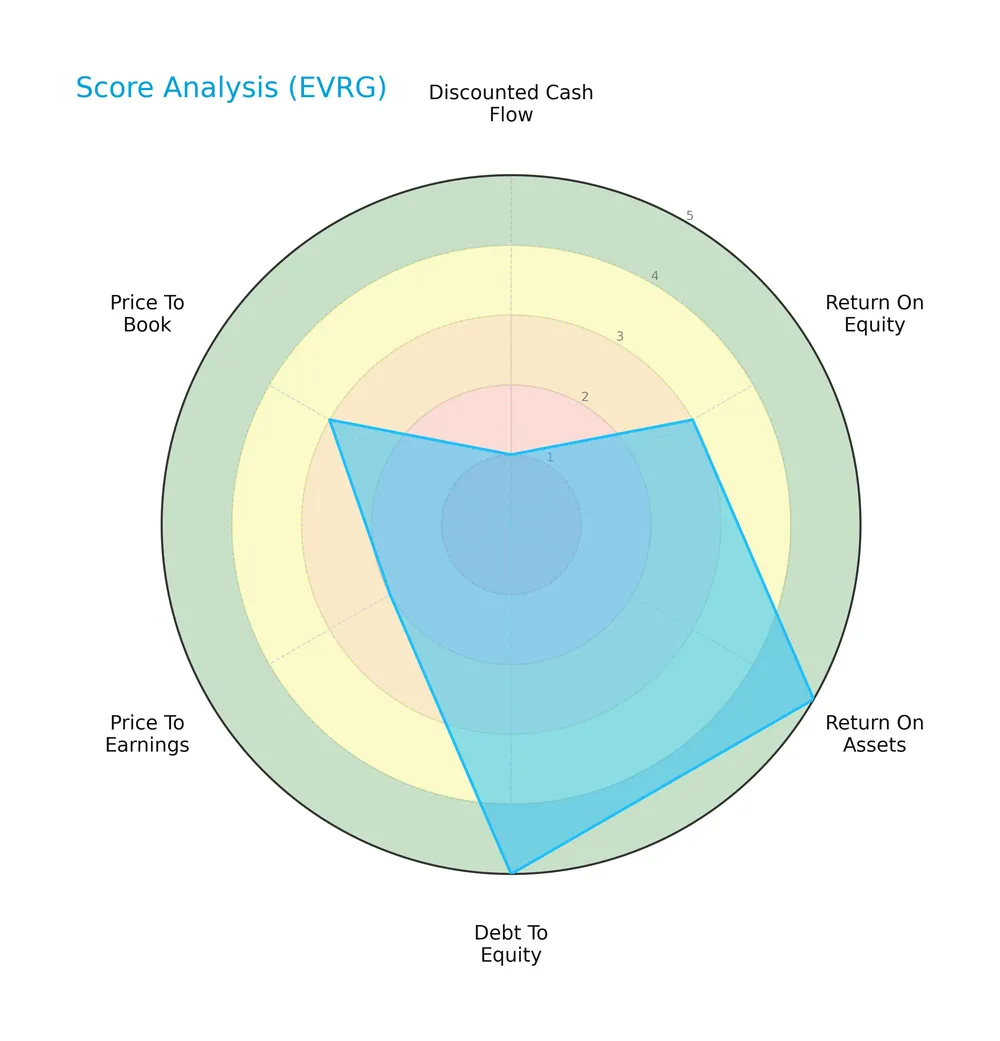
Evergy scores very favorably in return on assets and debt to equity, indicating operational efficiency and strong leverage control. However, discounted cash flow and price to earnings scores lag, suggesting valuation concerns. Other metrics remain moderate.
Analysis of the company’s bankruptcy risk
Evergy’s Altman Z-Score places it in the grey zone, signaling moderate bankruptcy risk with some financial uncertainty:

Is the company in good financial health?
The Piotroski Score diagram reflects Evergy’s financial health status as average:

With a score of 6, Evergy shows reasonable financial strength but leaves room for improvement in profitability, liquidity, and efficiency metrics.
Competitive Landscape & Sector Positioning
This sector analysis reviews Evergy, Inc.’s strategic positioning, revenue segments, key products, and main competitors. I will assess whether Evergy holds a competitive advantage over its industry peers.
Strategic Positioning
Evergy, Inc. concentrates exclusively on regulated electric utility services within Kansas and Missouri. Its product portfolio centers on diverse energy generation methods, including coal, natural gas, nuclear, and renewables. This focused regional and sector strategy supports operational scale but limits geographic diversification.
Revenue by Segment
This pie chart illustrates Evergy, Inc.’s revenue distribution specifically from its Electric Utility Segment, covering fiscal years 2014 through 2017.
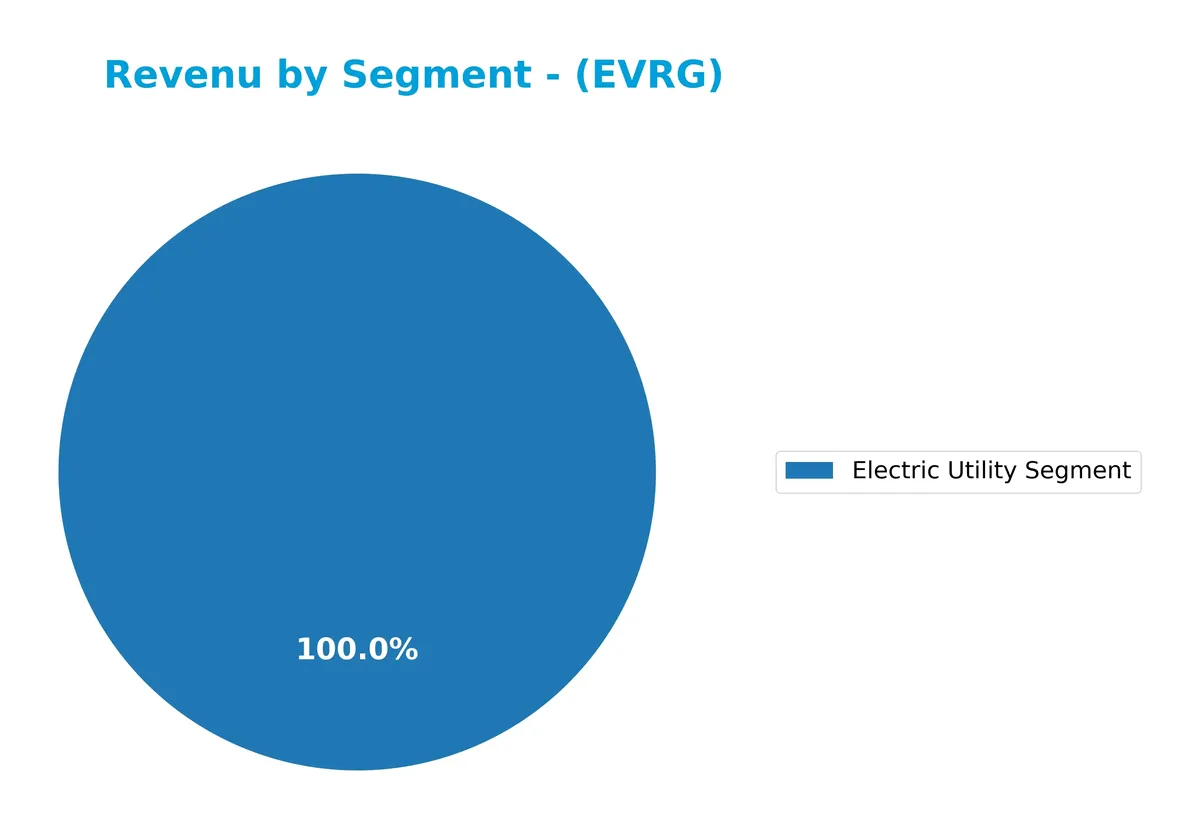
Evergy’s revenue derives almost exclusively from the Electric Utility Segment, showing steady growth from $2.5B in 2015 to $2.7B in 2017. This consistency highlights the segment’s dominant role and operational focus. There are no other reported segments contributing materially, indicating a concentrated business model with limited diversification risk but also potential exposure to sector-specific headwinds. Recent years show a gradual acceleration in revenue, reflecting stable demand and effective capital allocation within the utility space.
Key Products & Brands
Evergy’s primary offerings encompass electricity generation, transmission, and distribution across Kansas and Missouri:
| Product | Description |
|---|---|
| Electric Utility Segment | Generation, transmission, distribution, and sale of electricity using coal, hydro, gas, nuclear, solar, and wind. |
Evergy operates a regulated electric utility business serving over 1.6M customers. Its diversified energy mix spans fossil fuels and renewables, supported by extensive transmission and distribution infrastructure.
Main Competitors
There are 23 competitors in the Regulated Electric industry, with the table below listing the top 10 leaders by market capitalization:
| Competitor | Market Cap. |
|---|---|
| NextEra Energy, Inc. | 169B |
| The Southern Company | 96B |
| Duke Energy Corporation | 91B |
| American Electric Power Company, Inc. | 62B |
| Dominion Energy, Inc. | 51B |
| Exelon Corporation | 44B |
| Xcel Energy Inc. | 44B |
| Entergy Corporation | 42B |
| Public Service Enterprise Group Incorporated | 40B |
| Consolidated Edison, Inc. | 36B |
Evergy, Inc. ranks 21st among 23 competitors, with a market cap roughly 11% that of the leader, NextEra Energy. It sits below both the average market cap of the top 10 (67.5B) and the sector median (34B). The company is about 8.75% smaller than the next closest competitor above it, indicating a moderate gap in scale within the lower tier of this industry.
Comparisons with competitors
Check out how we compare the company to its competitors:
Does Evergy have a competitive advantage?
Evergy does not yet demonstrate a clear competitive advantage, as its ROIC remains below WACC, indicating value is being shed. However, the company’s profitability shows signs of improvement, with a growing ROIC trend.
Looking ahead, Evergy’s diverse generation mix—including renewables like solar and wind—and extensive transmission infrastructure offer opportunities. These assets position the company to leverage evolving energy markets and regulatory shifts in Kansas and Missouri.
SWOT Analysis
This SWOT analysis highlights Evergy, Inc.’s core strategic factors to guide informed investment decisions.
Strengths
- strong gross margin at 83.9%
- favorable EBIT margin of 25.2%
- low debt-to-equity ratio at 0.02
Weaknesses
- weak current and quick ratios at 0.08
- declining net margin and EPS growth
- below-average asset turnover
Opportunities
- expanding renewable energy sources
- regional utility demand stability
- potential operational efficiency gains
Threats
- regulatory risks in utilities sector
- rising interest expenses
- competition from alternative energy providers
Evergy’s solid profitability and low leverage underpin financial stability. However, liquidity concerns and shrinking earnings require cautious capital allocation. The firm must capitalize on renewable growth while managing regulatory and cost pressures.
Stock Price Action Analysis
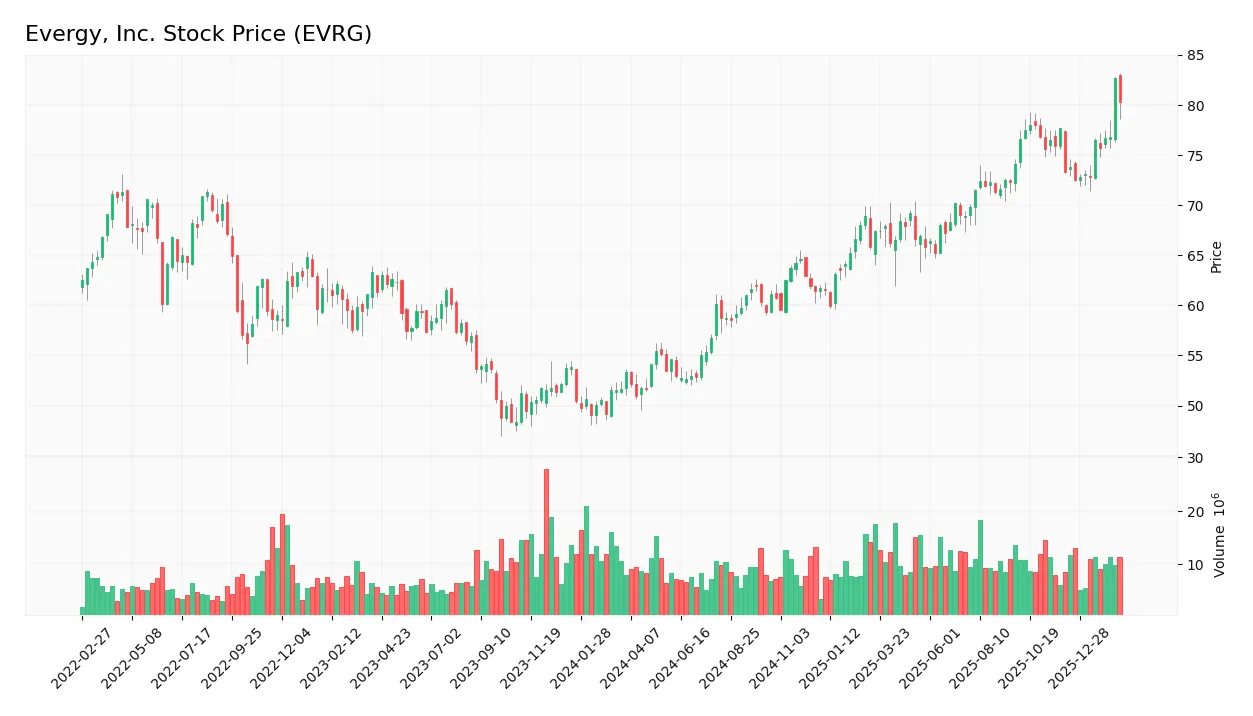
The weekly stock chart of Evergy, Inc. displays price movements and trends over the past 100 weeks for detailed technical insight:
Trend Analysis
Over the past two years, EVRG’s stock price rose by 50.36%, indicating a bullish trend. The trend shows acceleration with a standard deviation of 7.9. The highest price reached 82.69, and the lowest was 50.95, confirming strong upward momentum.
Volume Analysis
Trading volume totals 1.27B shares with buyers accounting for 58.8%, signaling a buyer-driven market. Volume is decreasing, suggesting reduced market participation but sustained buyer interest. Recent months show slight buyer dominance at 55.08%, indicating cautious optimism among investors.
Target Prices
Analysts set a clear target consensus for Evergy, Inc., reflecting cautious optimism.
| Target Low | Target High | Consensus |
|---|---|---|
| 76 | 91 | 83.5 |
The target range suggests moderate upside potential. Analysts expect steady performance within this band.

Don’t Let Luck Decide Your Entry Point
Optimize your entry points with our advanced ProRealTime indicators. You’ll get efficient buy signals with precise price targets for maximum performance. Start outperforming now!
Analyst & Consumer Opinions
I present an overview of analyst ratings and consumer feedback regarding Evergy, Inc. (EVRG) to inform evaluation.
Stock Grades
Here are the latest verified stock grades for Evergy, Inc. from leading financial institutions:
| Grading Company | Action | New Grade | Date |
|---|---|---|---|
| Wells Fargo | Maintain | Equal Weight | 2026-02-20 |
| Citigroup | Maintain | Buy | 2026-02-20 |
| UBS | Downgrade | Neutral | 2026-02-13 |
| BMO Capital | Maintain | Outperform | 2026-01-27 |
| Barclays | Maintain | Overweight | 2026-01-22 |
| Wells Fargo | Maintain | Equal Weight | 2026-01-20 |
| Mizuho | Downgrade | Neutral | 2025-12-18 |
| UBS | Maintain | Buy | 2025-12-17 |
| Citigroup | Maintain | Buy | 2025-11-10 |
| Jefferies | Maintain | Buy | 2025-10-09 |
The overall trend shows a mix of Buy and Hold ratings, with a few recent downgrades to Neutral. This signals cautious optimism but also some reservation among analysts.
Consumer Opinions
Evergy, Inc. sparks diverse reactions from its customer base, reflecting its operational strengths and areas needing improvement.
| Positive Reviews | Negative Reviews |
|---|---|
| Reliable electricity supply even during peak demand. | Occasional billing errors causing customer frustration. |
| Friendly and responsive customer service representatives. | Slow resolution times for service outages. |
| Competitive pricing compared to regional utilities. | Limited digital tools for account management. |
Overall, consumers appreciate Evergy’s dependable service and competitive rates. However, billing accuracy and digital platform enhancements remain persistent concerns.
Risk Analysis
Below is a table summarizing key risks facing Evergy, Inc. and their likelihood and impact on the company’s outlook:
| Category | Description | Probability | Impact |
|---|---|---|---|
| Liquidity Risk | Extremely low current and quick ratios (0.08) signal potential cash strain. | High | High |
| Operational Risk | Asset turnover is weak (0.44), indicating inefficient use of assets. | Medium | Medium |
| Financial Risk | Altman Z-Score of 2.79 places Evergy in a “grey zone” for bankruptcy risk. | Medium | High |
| Market Risk | Beta of 0.64 shows moderate sensitivity to market swings. | Low | Medium |
| Regulatory Risk | As a regulated electric utility, policy or rate changes could impact earnings. | Medium | Medium |
Evergy’s most concerning risk is its liquidity position, which is unusually tight for a utility. The grey zone Altman Z-score warns of moderate financial distress potential. However, strong debt metrics and a stable dividend offset some concerns. Operational inefficiencies and regulatory exposure remain ongoing challenges.
Should You Buy Evergy, Inc.?
Evergy, Inc. appears to exhibit improving profitability and a slightly favorable moat, reflecting growing operational efficiency despite shedding value relative to WACC. Supported by a manageable leverage profile and a B+ rating, the overall financial health suggests a moderate risk-return profile.
Strength & Efficiency Pillars
Evergy, Inc. maintains solid operational efficiency with a net margin of 14.45% and a robust gross margin of 83.89%. Its return on invested capital (ROIC) stands at 11.3%, comfortably above the weighted average cost of capital (WACC) at 9.63%, confirming that the company is a value creator. Despite a moderate return on equity of 8.37%, Evergy shows improving profitability trends, supported by a very favorable return on assets score and a consistent EBIT margin of 25.19%. These metrics highlight efficient capital deployment and strong earnings generation.
Weaknesses and Drawbacks
Evergy currently resides in the Altman Z-Score grey zone with a value of 2.79, signaling moderate financial risk but no immediate distress. The company faces valuation pressures, with a neutral P/E ratio of 19.53 and a price-to-book ratio of 1.63, implying fair market expectations. A critical red flag is its extremely low current ratio of 0.08, indicating weak short-term liquidity and potential difficulties meeting near-term obligations. Additionally, a relatively high interest expense ratio of 10.41% could constrain financial flexibility despite low debt-to-equity leverage at 0.02.
Our Final Verdict about Evergy, Inc.
Evergy, Inc. presents a fundamentally sound profile with positive profitability and value creation signals. However, the moderate solvency risk reflected by its Altman Z-Score in the grey zone advises caution. The bullish long-term stock trend and slight buyer dominance suggest potential upside, but liquidity concerns and valuation metrics suggest a wait-and-see approach. This profile might appear suitable for investors willing to tolerate moderate risk for possible gains.
Disclaimer: This content is for informational purposes only and does not constitute financial, investment, or other professional advice. Investing in financial markets involves a significant risk of loss, and past performance is not indicative of future results.
Additional Resources
- UBS Downgrades Evergy, Inc. (EVRG) to Neutral, Raises its Price Target to $88 – Yahoo Finance (Feb 21, 2026)
- Evergy Inc (EVRG) Q4 2025 Earnings Call Highlights: Strategic Investments and Growth Targets Amid Challenges – GuruFocus (Feb 19, 2026)
- Evergy Inc. (NASDAQ:EVRG) Plans Quarterly Dividend of $0.70 – MarketBeat (Feb 19, 2026)
- Evergy plans $21.6B grid buildout as big power users sign on – Stock Titan (Feb 19, 2026)
- Evergy: Q4 Earnings Snapshot – kens5.com (Feb 19, 2026)
For more information about Evergy, Inc., please visit the official website: evergyinc.com