Home > Analyses > Financial Services > Everest Re Group, Ltd.
Everest Group, Ltd. underwrites the unseen risks that underpin global commerce and daily life. This reinsurance and insurance heavyweight shapes markets across continents, offering tailored property, casualty, and specialty coverages. Its reputation for disciplined risk selection and innovative product design sets industry standards. As market volatility tests capital strength, I examine whether Everest’s robust fundamentals still support its premium valuation and future growth potential.

Table of contents
Business Model & Company Overview
Everest Group, Ltd., founded in 1973 and headquartered in Hamilton, Bermuda, stands as a dominant player in the reinsurance and insurance sectors. Its core mission weaves property and casualty coverage with specialty lines, creating an integrated ecosystem that serves clients worldwide. With over 3,000 employees, Everest blends direct underwriting and broker partnerships to deliver tailored risk solutions.
The company drives value through a balanced revenue engine combining treaty and facultative reinsurance with admitted and non-admitted insurance products. Its footprint spans key global markets including the Americas, Europe, and Asia, enhancing diversification and resilience. Everest’s competitive advantage lies in its comprehensive product suite and global reach, fortifying a durable economic moat that shapes the future of risk management.
Financial Performance & Fundamental Metrics
I analyze Everest Re Group, Ltd.’s income statement, key financial ratios, and dividend payout policy to assess its core financial health and shareholder value.
Income Statement
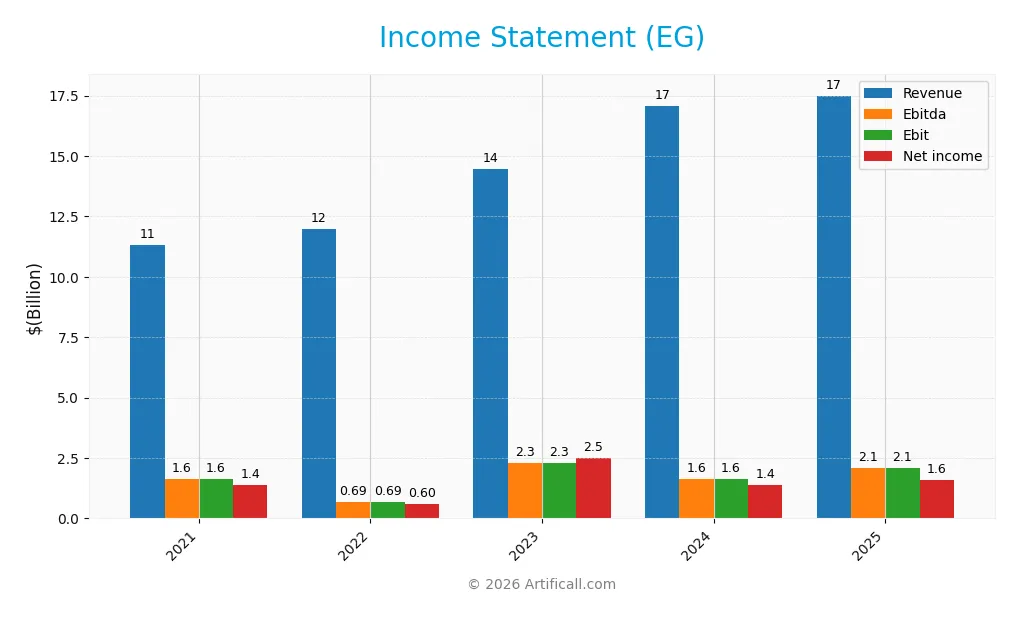
The following table summarizes Everest Re Group, Ltd.’s key income statement metrics for fiscal years 2021 through 2025, highlighting revenue, expenses, and profitability.
| 2021 | 2022 | 2023 | 2024 | 2025 | |
|---|---|---|---|---|---|
| Revenue | 11.3B | 11.9B | 14.5B | 17.1B | 17.3B |
| Cost of Revenue | 9.6B | 10.6B | 11.4B | 14.6B | 13.8B |
| Operating Expenses | 184M | 769M | 931M | 976M | 1.6B |
| Gross Profit | 1.7B | 1.4B | 3.1B | 2.5B | 3.6B |
| EBITDA | 1.6B | 689M | 2.3B | 1.6B | 2.1B |
| EBIT | 1.6B | 689M | 2.3B | 1.6B | 2.1B |
| Interest Expense | 70M | 101M | 134M | 149M | 139M |
| Net Income | 1.4B | 597M | 2.5B | 1.4B | 1.6B |
| EPS | 34.7 | 15.2 | 60.2 | 31.8 | 37.9 |
| Filing Date | 2021-12-31 | 2022-12-31 | 2024-02-28 | 2025-02-27 | 2026-02-26 |
Income Statement Evolution
Between 2021 and 2025, Everest Re Group’s revenue grew 53%, signaling robust top-line expansion. Net income increased 15%, but net margin declined 25%, indicating margin pressure despite higher profits. Gross profit surged notably in the last year, lifting gross margin to a favorable 20.5%. Operating expenses, however, grew alongside revenue, slightly restraining margin improvement.
Is the Income Statement Favorable?
In 2025, Everest Re posted $17.3B revenue with a 9.2% net margin, reflecting solid profitability. EBIT margin stood at 11.9%, supported by controlled interest expenses under 1% of revenue. Earnings per share rose 19% year-over-year, driven by a 26% EBIT increase. Overall, fundamentals appear favorable, with strong margin recovery and sustainable earnings growth.
Financial Ratios
The table below summarizes Everest Re Group, Ltd.’s key financial ratios for 2021 through 2025, providing insight into profitability, valuation, liquidity, leverage, efficiency, and dividend metrics:
| Ratios | 2021 | 2022 | 2023 | 2024 | 2025 |
|---|---|---|---|---|---|
| Net Margin | 12% | 5.0% | 17% | 8.0% | 9.2% |
| ROE | 14% | 7.1% | 19% | 9.9% | 10% |
| ROIC | 3.4% | 1.1% | 92% | 59% | 47% |
| P/E | 7.8 | 21.6 | 5.8 | 11.3 | 8.8 |
| P/B | 1.1 | 1.5 | 1.1 | 1.1 | 0.9 |
| Current Ratio | 0 | 10.6 | 0 | 0 | 1.5 |
| Quick Ratio | 0 | 10.6 | 0 | 0 | 1.5 |
| D/E | 0.54 | 0.37 | 0.43 | 0.43 | 0.23 |
| Debt-to-Assets | 14% | 7.7% | 12% | 11% | 5.7% |
| Interest Coverage | 22.1 | 5.8 | 16.1 | 10.0 | 14.1 |
| Asset Turnover | 0.30 | 0.30 | 0.29 | 0.30 | 0.28 |
| Fixed Asset Turnover | 0 | 94 | 0 | 0 | 0 |
| Dividend Yield | 2.3% | 2.0% | 2.0% | 2.2% | 2.4% |
Evolution of Financial Ratios
Between 2021 and 2025, Everest Re Group’s Return on Equity (ROE) showed variability, peaking in 2023 before settling at 10.3% in 2025. The Current Ratio improved notably by 2025, reaching 1.52 after fluctuating or missing data in prior years. The Debt-to-Equity Ratio declined steadily from 0.54 in 2021 to a more conservative 0.23 in 2025, indicating reduced leverage. Profitability margins stabilized around 9% net margin in 2025 after higher volatility earlier.
Are the Financial Ratios Favorable?
In 2025, Everest Re’s ratios mostly reflect strength. The company’s ROIC at 47.1% exceeds its WACC of 4.8%, signaling excellent capital efficiency. Liquidity metrics like the Current and Quick Ratios stand favorably above 1.5, supporting short-term obligations. Leverage remains moderate with a 0.23 Debt-to-Equity ratio. However, asset turnover at 0.28 is low, highlighting inefficiency in asset utilization. Market valuation multiples, including a P/E of 8.8 and P/B under 1, suggest undervaluation. Overall, 71% of ratios are favorable, supporting a positive financial profile with some operational caution.
Shareholder Return Policy
Everest Re Group, Ltd. maintains a consistent dividend payout ratio around 21%, with dividend per share rising from 6.29 in 2021 to 8.09 in 2025. The annual dividend yield stands near 2.4%, supported by free cash flow coverage and moderate share buybacks.
This balanced approach preserves capital while rewarding shareholders. The payout ratio and steady yield suggest a sustainable distribution policy. Buybacks complement dividends without risking financial flexibility, supporting long-term shareholder value creation.
Score analysis
The following radar chart illustrates Everest Re Group, Ltd.’s key financial scores across valuation, profitability, and leverage metrics:
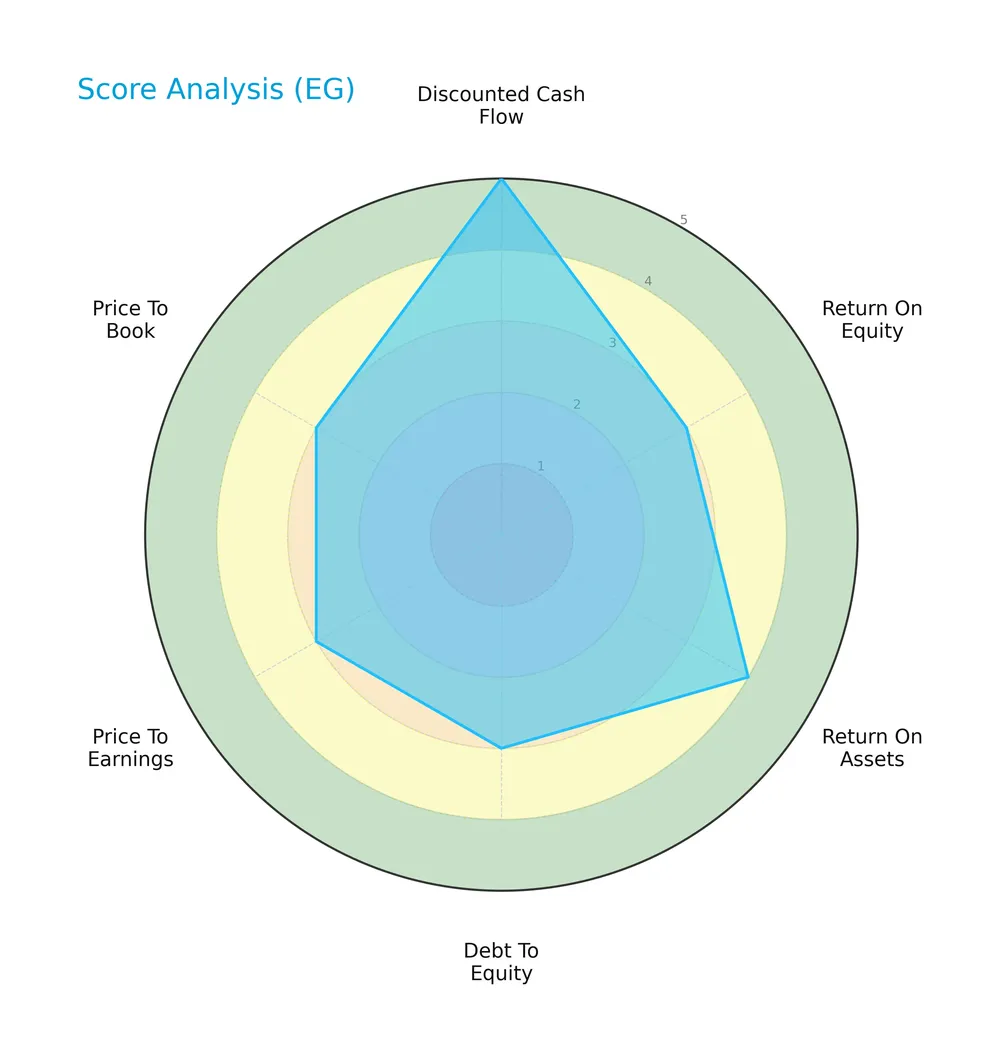
Everest Re Group scores very favorably on discounted cash flow (5) and return on assets (4). Return on equity, debt to equity, price to earnings, and price to book scores are moderate (3), indicating balanced but not exceptional performance.
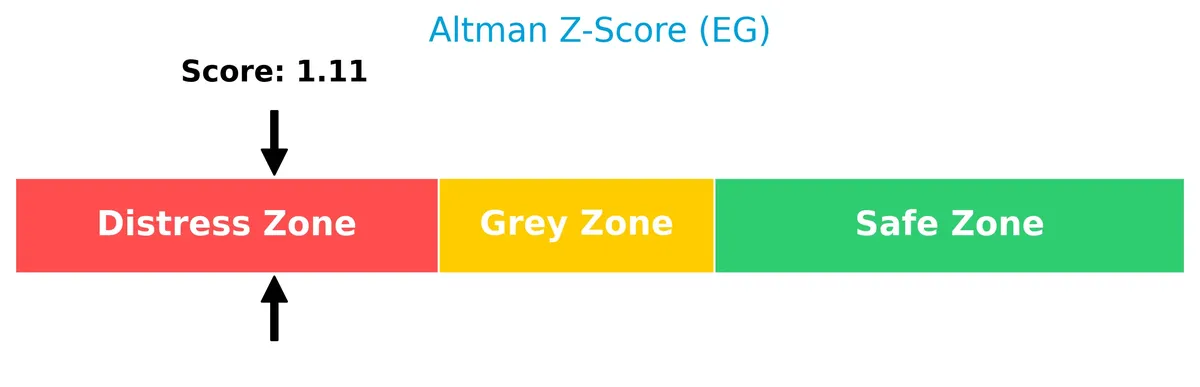
Analysis of the company’s bankruptcy risk
Everest Re Group’s Altman Z-Score of 1.00 places it in the distress zone, signaling a high risk of financial distress and possible bankruptcy:
Is the company in good financial health?
The Piotroski Score diagram highlights the company’s financial strength based on profitability, leverage, liquidity, and efficiency criteria:

With a Piotroski Score of 7, Everest Re Group demonstrates strong financial health, suggesting solid fundamentals despite the bankruptcy risk indicated by the Altman Z-Score.
Competitive Landscape & Sector Positioning
This section analyzes Everest Group, Ltd.’s positioning within the reinsurance and insurance sector. I will examine its strategic segments, key products, and main competitors. I aim to determine whether Everest Group holds a sustainable competitive advantage over its peers.
Strategic Positioning
Everest Group diversifies across reinsurance and insurance, with 77% of 2024 revenue from reinsurance and 23% from insurance and other segments. It operates globally, spanning North America, Europe, and Asia-Pacific, reflecting broad geographic exposure and product portfolio concentration in property and casualty lines.
Revenue by Segment
This pie chart illustrates Everest Re Group’s revenue distribution across its key business segments for the fiscal year 2024.
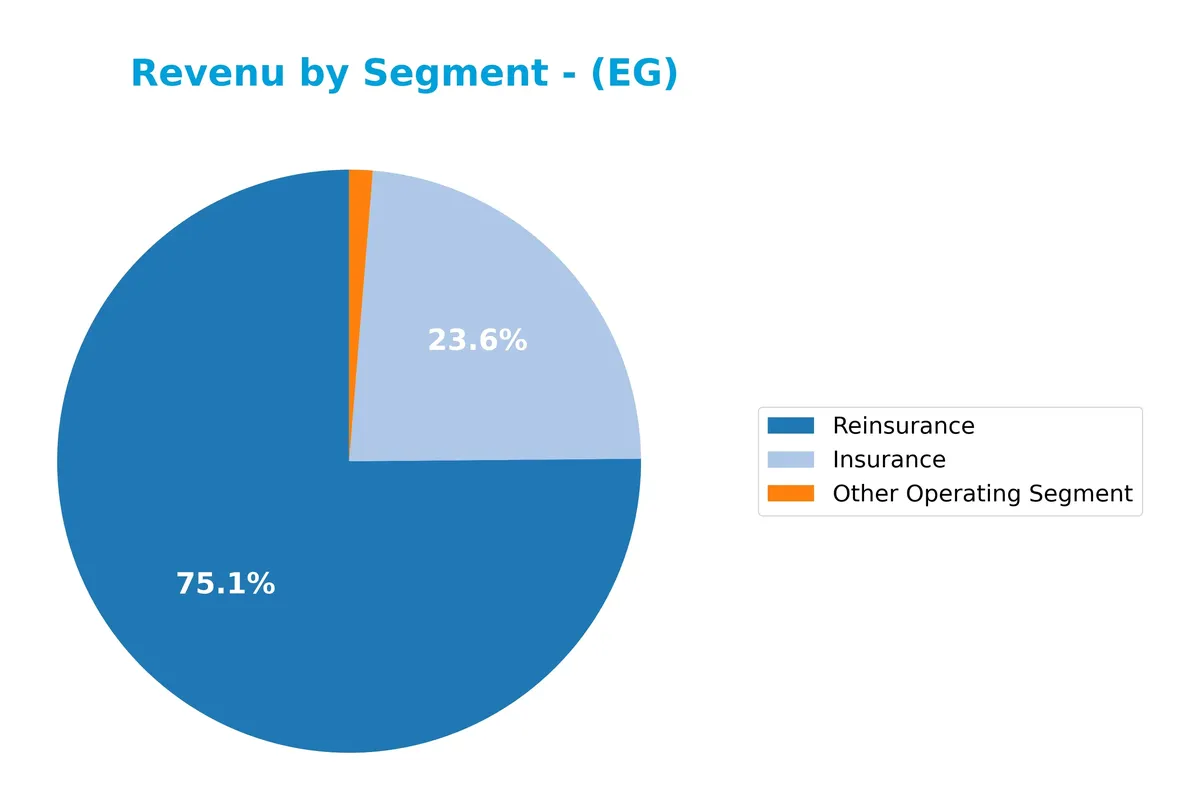
In 2024, the Reinsurance segment dominates Everest Re’s revenue with 11.4B, reflecting the core strength of its risk transfer business. Insurance contributes a solid 3.6B, supporting diversification but at a much smaller scale. The Other Operating Segment is marginal at 197M, indicating limited impact. The revenue concentration in Reinsurance signals potential exposure to market cycles and catastrophe risks, requiring careful monitoring.
Key Products & Brands
Everest Group, Ltd. operates through distinct insurance and reinsurance product lines as detailed below:
| Product | Description |
|---|---|
| Reinsurance Operations | Property and casualty reinsurance, specialty lines including marine, aviation, surety, and liability coverage. |
| Insurance Operations | Property and casualty insurance, commercial insurance via brokers and program administrators. |
| Other Operating Segment | Additional ancillary services supporting core insurance and reinsurance businesses. |
Everest’s core revenue drivers come from its comprehensive reinsurance and insurance products. Its specialization spans multiple risk types and geographies, reflecting a diversified portfolio within financial services.
Main Competitors
In the Financial Services sector, Everest Re Group, Ltd. faces 71 competitors; the table lists the top 10 leaders by market capitalization:
| Competitor | Market Cap. |
|---|---|
| Berkshire Hathaway Inc. | 1.07T |
| JPMorgan Chase & Co. | 886B |
| Visa Inc. | 672B |
| Mastercard Incorporated | 506B |
| Bank of America Corporation | 409B |
| Wells Fargo & Company | 310B |
| Morgan Stanley | 289B |
| The Goldman Sachs Group, Inc. | 287B |
| American Express Company | 260B |
| Citigroup Inc. | 221B |
Everest Re Group ranks 64th among 71 competitors, with a market cap just 1.32% of the sector leader. The company’s scale sits below both the average market cap of the top 10 (491B) and the sector median (55B). It holds a 41.85% gap from its nearest competitor above, highlighting a significant market capitalization distance.
Comparisons with competitors
Check out how we compare the company to its competitors:
Aucun article trouvé pour ces critères.
Does Everest Re Group have a competitive advantage?
Everest Re Group demonstrates a sustainable competitive advantage with a very favorable moat, driven by a ROIC exceeding WACC by 42%, indicating strong value creation and efficient capital use. The company’s profitability trend is sharply growing, confirming increasing returns on invested capital and enhancing its economic moat.
Looking ahead, Everest Re Group’s diversified reinsurance and insurance operations across multiple international markets position it to leverage growth opportunities. Its broad product portfolio, including specialty and commercial lines, supports expansion potential in established and emerging regions.
SWOT Analysis
This SWOT analysis highlights Everest Re Group, Ltd.’s key strategic factors that influence its market position and future growth.
Strengths
- strong ROIC well above WACC
- favorable income margins
- diversified international presence
Weaknesses
- low Altman Z-score signals financial distress risk
- asset turnover below industry average
- moderate debt-to-equity ratio
Opportunities
- expanding global insurance markets
- potential for margin improvement
- innovation in specialty lines
Threats
- intense reinsurance competition
- regulatory changes in multiple jurisdictions
- exposure to catastrophic losses
Everest Re boasts a robust competitive advantage with exceptional capital efficiency. However, its financial distress signals require cautious monitoring. The company should leverage growth opportunities while mitigating industry and regulatory risks.
Stock Price Action Analysis
The weekly stock chart below illustrates Everest Re Group, Ltd.’s price movements over the last 100 weeks:
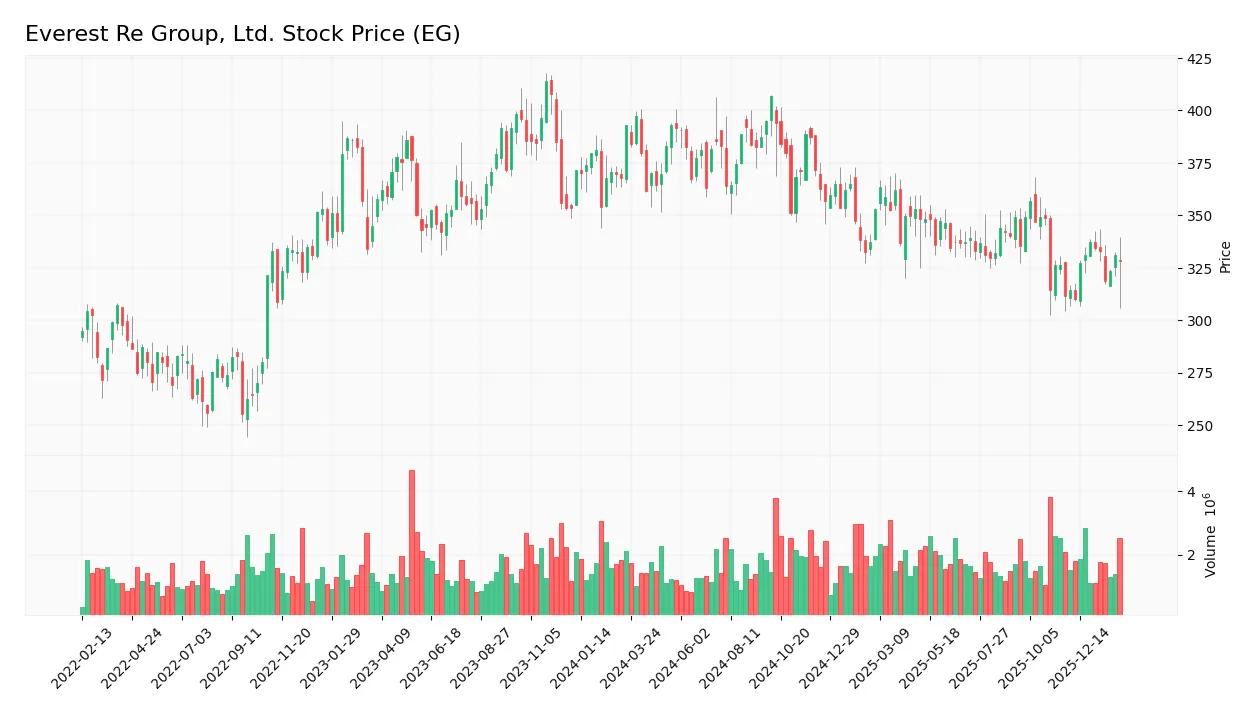
Trend Analysis
Over the past 12 months, EG’s stock declined by 11.07%, indicating a bearish trend with accelerating downward momentum. The price ranged between a high of 407.04 and a low of 309.97. Recent weeks show a mild recovery, gaining 3.26% since mid-December 2025, with reduced volatility at 6.46%.
Volume Analysis
Trading volume is increasing overall, totaling 217M shares with sellers slightly outnumbering buyers at 53%. However, in the last three months, buyer volume dominates at 59%, suggesting a shift toward buyer-driven activity and growing investor interest since December 2025.
Target Prices
Analysts project a solid growth range for Everest Re Group, Ltd., reflecting confident market expectations.
| Target Low | Target High | Consensus |
|---|---|---|
| 332 | 377 | 353.29 |
The target prices suggest a bullish outlook with a 13% upside potential from current levels, indicating strong investor confidence.

Don’t Let Luck Decide Your Entry Point
Optimize your entry points with our advanced ProRealTime indicators. You’ll get efficient buy signals with precise price targets for maximum performance. Start outperforming now!
Analyst & Consumer Opinions
This section examines Everest Re Group, Ltd.’s analyst ratings alongside consumer feedback to provide a balanced view.
Stock Grades
Here is a summary of recent analyst grades for Everest Re Group, Ltd., reflecting varied but steady sentiment:
| Grading Company | Action | New Grade | Date |
|---|---|---|---|
| Wells Fargo | Maintain | Equal Weight | 2026-02-06 |
| Cantor Fitzgerald | Maintain | Neutral | 2026-01-14 |
| Wells Fargo | Maintain | Equal Weight | 2026-01-13 |
| Barclays | Maintain | Overweight | 2026-01-08 |
| Keefe, Bruyette & Woods | Maintain | Outperform | 2026-01-06 |
| TD Cowen | Maintain | Hold | 2025-12-15 |
| Barclays | Maintain | Overweight | 2025-11-03 |
| Keefe, Bruyette & Woods | Maintain | Outperform | 2025-10-30 |
| Wolfe Research | Upgrade | Peer Perform | 2025-10-29 |
| Wells Fargo | Maintain | Equal Weight | 2025-10-29 |
The grades show a predominance of hold and moderate buy ratings with no strong buys or sells. Analysts generally maintain a cautious but positive stance, indicating balanced expectations.
Consumer Opinions
Everest Re Group, Ltd. receives mixed consumer sentiment, reflecting its complex role in the reinsurance market.
| Positive Reviews | Negative Reviews |
|---|---|
| Strong claims processing efficiency | Premiums are perceived as high |
| Responsive customer service | Communication delays in complex cases |
| Financial stability reassures clients | Limited digital tools for policyholders |
Overall, consumers appreciate Everest Re’s reliability and service responsiveness. However, pricing and occasional communication gaps remain common concerns, signaling areas for operational improvement.
Risk Analysis
Below is a summary table highlighting key risks associated with Everest Re Group, Ltd. (EG):
| Category | Description | Probability | Impact |
|---|---|---|---|
| Financial Health | Altman Z-Score at 1.00 signals high bankruptcy risk, indicating financial distress. | High | High |
| Market Exposure | Low beta (0.33) suggests limited market volatility sensitivity but potential growth constraints. | Medium | Medium |
| Operational Risk | Unfavorable asset turnover ratios may indicate inefficiencies in asset utilization. | Medium | Medium |
| Industry Risk | Exposure to catastrophic events in reinsurance increases claim volatility and loss severity. | Medium | High |
| Regulatory Risk | Operating internationally subjects the company to diverse regulatory environments and compliance costs. | Medium | Medium |
The most pressing risk is Everest’s Altman Z-Score, firmly in the distress zone, signaling a fragile financial condition despite strong operational scores. Additionally, the company’s exposure to unpredictable catastrophic losses in reinsurance poses high-impact risks. Investors must weigh these alongside favorable capital structure and profitability metrics.
Should You Buy Everest Re Group, Ltd.?
Everest Re Group appears to be a profitable company with a durable competitive moat supported by a significantly growing ROIC. While debt leverage seems moderate, the distress-level Altman Z-Score suggests caution. Overall, the firm’s rating is very favorable at A-.
Strength & Efficiency Pillars
Everest Re Group, Ltd. exhibits solid operational efficiency with a net margin of 9.19% and a return on equity (ROE) of 10.29%. Its return on invested capital (ROIC) stands at an impressive 47.14%, far exceeding the weighted average cost of capital (WACC) of 4.82%. This gap clearly marks the company as a value creator. Favorable interest coverage at 14.88 and a conservative debt-to-equity ratio of 0.23 further underpin operational resilience.
Weaknesses and Drawbacks
The company is in financial distress, evidenced by a low Altman Z-Score of 1.00, signaling a high bankruptcy risk. This solvency concern overshadows other metrics. Additionally, revenue growth is sluggish at 1.42%, and asset turnover remains weak at 0.28, suggesting inefficiencies in asset utilization. Despite favorable valuation multiples—P/E at 8.83 and P/B at 0.91—the distressed financial position and operational risks demand caution.
Our Final Verdict about Everest Re Group, Ltd.
Despite demonstrating operational strength and value creation, Everest Re Group’s Altman Z-Score in the distress zone (1.00) flags a severe solvency risk. This places the company’s investment profile in the highly speculative category. Conservative investors should approach with caution, as the risk of bankruptcy outweighs current profitability metrics and favorable valuation signals.
Disclaimer: This content is for informational purposes only and does not constitute financial, investment, or other professional advice. Investing in financial markets involves a significant risk of loss, and past performance is not indicative of future results.
Additional Resources
- Decoding Everest Group Ltd (EG): A Strategic SWOT Insight – GuruFocus (Feb 27, 2026)
- Everest Group (EG) Q4 Earnings: What To Expect – Finviz (Feb 02, 2026)
- It Might Not Be A Great Idea To Buy Everest Group, Ltd. (NYSE:EG) For Its Next Dividend – simplywall.st (Nov 21, 2025)
- Everest Announces Agreement to Sell Retail Commercial Insurance Renewal Rights to AIG – Business Wire (Oct 27, 2025)
- Why Everest Group (EG) Shares Are Plunging Today – Yahoo Finance (Oct 28, 2025)
For more information about Everest Re Group, Ltd., please visit the official website: everestglobal.com