Home > Analyses > Real Estate > Essex Property Trust, Inc.
Essex Property Trust transforms how thousands live on the West Coast through its expertly managed apartment communities. As a dominant REIT in residential real estate, Essex commands a portfolio of 60,000 homes across 246 properties, blending development prowess with operational excellence. Its reputation for quality and innovation sets the standard in multifamily housing. The key question now: does Essex’s robust foundation still justify its premium valuation and future growth prospects?

Table of contents
Business Model & Company Overview
Essex Property Trust, Inc. is a leading REIT – Residential headquartered in San Mateo, CA. Founded in 1994, it commands a dominant position on the West Coast by owning and managing 246 multifamily apartment communities, totaling 60K homes. Its vertically integrated approach spans acquisition, development, redevelopment, and property management, creating a seamless ecosystem focused on residential real estate excellence.
The company’s revenue engine balances rental income from a vast portfolio with growth from six properties actively developed. Essex’s strategic footprint in key West Coast markets taps into high-demand urban areas, fueling steady cash flow. Its strong economic moat arises from scale, market expertise, and operational efficiency, setting a high barrier for competitors and shaping the future of multifamily housing investment.
Financial Performance & Fundamental Metrics
I analyze Essex Property Trust’s income statement, key financial ratios, and dividend payout policy to assess its core profitability and capital allocation efficiency.
Income Statement
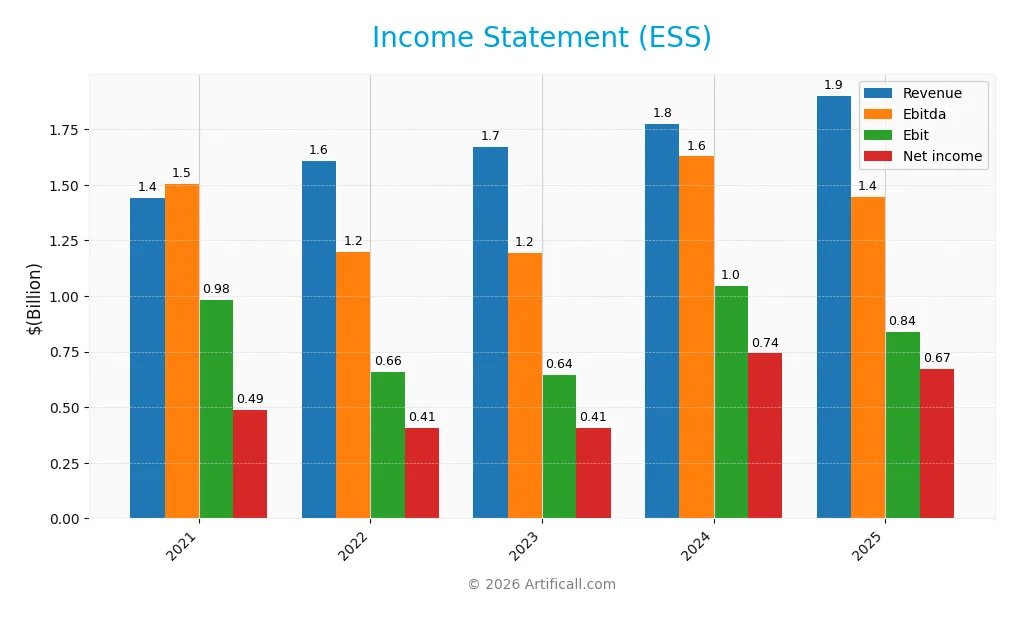
The table below presents Essex Property Trust, Inc.’s income statement data for fiscal years 2021 through 2025, showing key profitability and expense metrics.
| 2021 | 2022 | 2023 | 2024 | 2025 | |
|---|---|---|---|---|---|
| Revenue | 1.44B | 1.61B | 1.67B | 1.77B | 1.90B |
| Cost of Revenue | 232M | 498M | 532M | 567M | 593M |
| Operating Expenses | 678M | 514M | 553M | 505M | 474M |
| Gross Profit | 1.21B | 1.11B | 1.14B | 1.21B | 1.31B |
| EBITDA | 1.50B | 1.20B | 1.19B | 1.63B | 1.45B |
| EBIT | 984M | 657M | 644M | 1.05B | 838M |
| Interest Expense | 203M | 224M | 213M | 236M | 257M |
| Net Income | 489M | 408M | 406M | 742M | 672M |
| EPS | 7.51 | 6.27 | 6.32 | 11.55 | 10.41 |
| Filing Date | 2022-02-25 | 2023-02-23 | 2024-02-23 | 2025-02-21 | 2026-02-20 |
Income Statement Evolution
Essex Property Trust’s revenue rose 32% from 2021 to 2025, reaching $1.9B in 2025. Net income grew 38% over the same period, hitting $672M in 2025. Gross margin remained strong near 69%, while net margin held steady around 35%. However, EBIT fell nearly 20% in the last year, signaling margin pressure.
Is the Income Statement Favorable?
In 2025, Essex’s fundamentals show mixed signals. Revenue and gross profit increased modestly, reflecting stable demand. Operating expenses grew proportionally, preserving operating leverage. Yet, EBIT declined 20%, and interest expense rose to 13.5% of revenue, weighing on profitability. Overall, the income statement appears generally favorable but with caution on margin compression and financing costs.
Financial Ratios
The following table presents Essex Property Trust, Inc.’s key financial ratios for fiscal years 2021 through 2025:
| Ratios | 2021 | 2022 | 2023 | 2024 | 2025 |
|---|---|---|---|---|---|
| Net Margin | 34% | 25% | 24% | 42% | 35% |
| ROE | 8.2% | 7.1% | 7.5% | 13.4% | 12.1% |
| ROIC | 4.2% | 5.0% | 4.9% | 5.6% | 185% |
| P/E | 47 | 34 | 39 | 25 | 25 |
| P/B | 3.82 | 2.41 | 2.94 | 3.31 | 3.04 |
| Current Ratio | 0.85 | 0.66 | 1.88 | 0.66 | 0 |
| Quick Ratio | 0.85 | 0.66 | 1.88 | 0.66 | 0 |
| D/E | 1.06 | 1.05 | 1.16 | 1.20 | 1.25 |
| Debt-to-Assets | 49% | 49% | 51% | 51% | 52% |
| Interest Coverage | 2.61 | 2.66 | 2.74 | 2.99 | 3.24 |
| Asset Turnover | 0.11 | 0.13 | 0.14 | 0.14 | 0.14 |
| Fixed Asset Turnover | 20.9 | 23.9 | 26.2 | 34.4 | 37.4 |
| Dividend Yield | 2.4% | 4.1% | 3.7% | 3.4% | 3.9% |
Evolution of Financial Ratios
Essex Property Trust’s Return on Equity (ROE) rose from 7.14% in 2022 to 12.14% in 2025, showing gradual improvement. The Current Ratio declined sharply, hitting zero in 2025, indicating deteriorating liquidity. Meanwhile, the Debt-to-Equity Ratio increased steadily to 1.25, reflecting higher leverage. Profitability margins remained robust yet fluctuated, with net margins peaking in 2024 before softening in 2025.
Are the Financial Ratios Favorable?
In 2025, profitability metrics like net margin (35.38%) and return on invested capital (185.04%) are favorable, highlighting strong earnings efficiency. Liquidity ratios, including current and quick ratios at zero, represent a clear red flag. Leverage ratios, such as debt-to-equity (1.25) and debt-to-assets (52.46%), are unfavorable, indicating elevated financial risk. Market valuation ratios like P/E (25.08) and P/B (3.04) also lean unfavorable. Overall, the ratio profile is slightly unfavorable.
Shareholder Return Policy
Essex Property Trust, Inc. maintains a high dividend payout ratio near 97%, with a consistent dividend per share increase from $8.35 in 2021 to $10.16 in 2025. The annual dividend yield stands around 3.9%, supported by free cash flow coverage and complemented by share repurchases.
This payout approach aligns closely with sustainable value creation given the company’s solid cash flows and operating margins. However, the near-total payout ratio signals limited reinvestment capacity, posing risks if cash flow declines. Continuous monitoring of capital allocation balance remains essential.
Score analysis
The radar chart below displays Essex Property Trust’s key valuation and profitability scores:
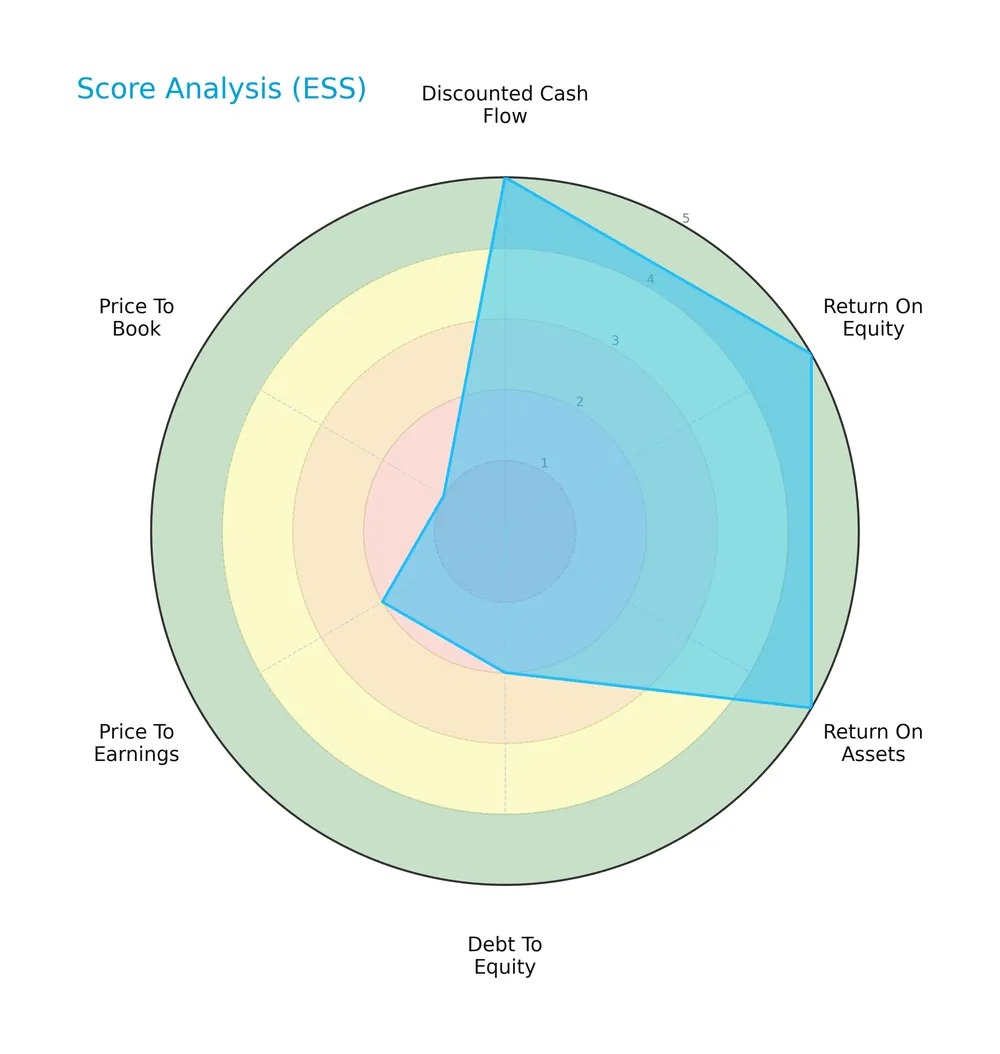
Essex shows very favorable discounted cash flow, ROE, and ROA scores at 5 each, signaling strong profitability and value creation. However, debt-to-equity, PE, and PB scores lag at 2, 2, and 1, indicating valuation and leverage concerns compared to sector norms.
Analysis of the company’s bankruptcy risk
Essex Property Trust’s Altman Z-Score places it in the distress zone, signaling elevated bankruptcy risk and financial vulnerability:

Is the company in good financial health?
The Piotroski Score diagram highlights Essex’s solid financial strength based on profitability, leverage, and efficiency metrics:

With a score of 7, Essex exhibits strong financial health, suggesting robust fundamentals despite some balance sheet caution points.
Competitive Landscape & Sector Positioning
This analysis explores Essex Property Trust’s strategic positioning within the residential REIT sector. It examines revenue streams, key products, and principal competitors shaping its market stance. I will assess whether Essex Property Trust holds a sustainable competitive advantage over its peers.
Strategic Positioning
Essex Property Trust concentrates its portfolio on multifamily residential properties primarily in Northern and Southern California. It owns 246 communities with 60K homes and focuses on select West Coast markets, reflecting a geographically concentrated, specialized REIT strategy.
Revenue by Segment
This pie chart illustrates Essex Property Trust’s revenue breakdown by segment for fiscal year 2018, highlighting the proportional contribution of rental and management fees.
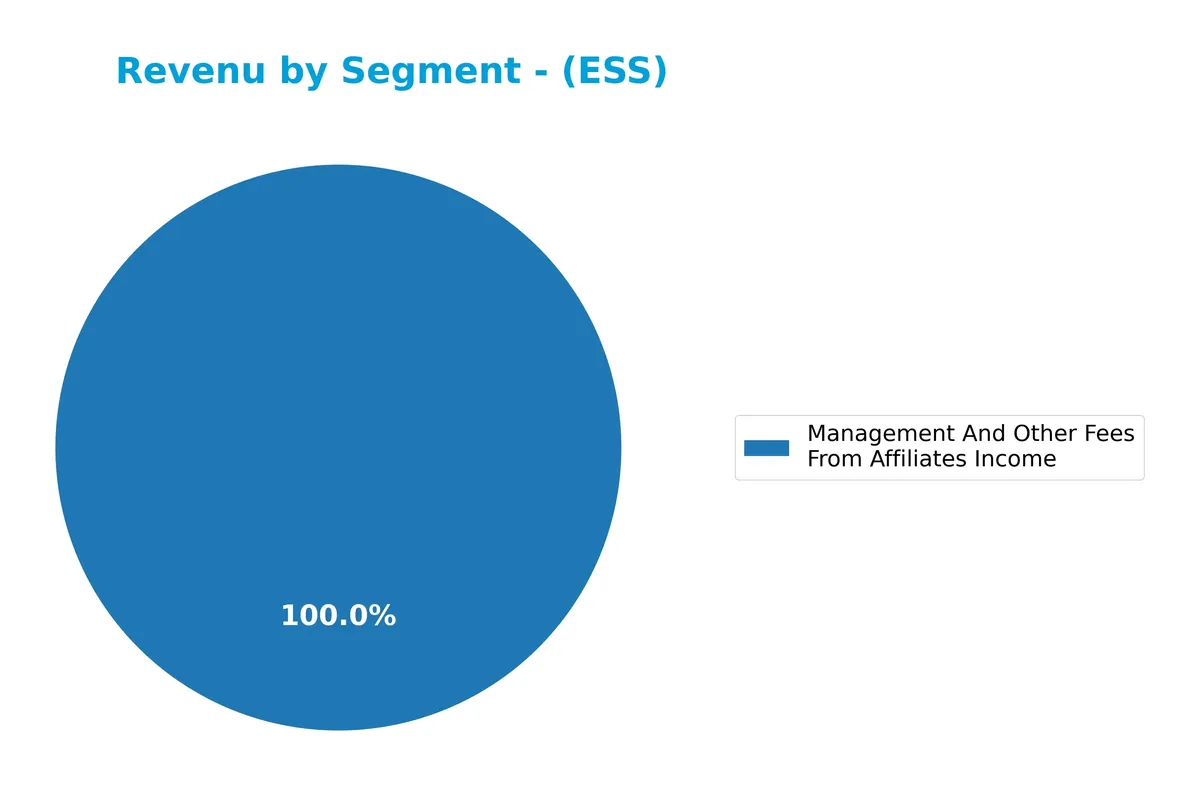
In 2018, rental and other property revenues dominated Essex’s income at 1.28B, dwarfing management and other fees at 9.2M. This concentration reflects the core property leasing business’s strength and scale. The management fee segment showed modest growth over recent years but remains a minor revenue source. Investors should note the heavy reliance on rental income, which introduces concentration risk if market conditions weaken.
Key Products & Brands
Essex Property Trust generates revenue primarily from residential property operations and affiliated management services:
| Product | Description |
|---|---|
| Multifamily Residential Properties | Owns and manages 246 apartment communities with about 60,000 apartment homes on the U.S. West Coast. |
| Rental and Other Property Revenues | Income derived from leasing and operating residential properties, totaling approximately $1.28B in 2018. |
| Management and Other Fees from Affiliates | Fees earned from providing management services to affiliated entities, around $11M annually since 2021. |
Essex’s core business centers on high-quality multifamily housing and stable rental income streams. Management fees from affiliates provide supplementary revenue but remain a small portion of total income.
Main Competitors
There are 7 competitors in total in the Real Estate sector, with the table listing the top 7 leaders by market capitalization:
| Competitor | Market Cap. |
|---|---|
| AvalonBay Communities, Inc. | 25.6B |
| Equity Residential | 23.6B |
| Invitation Homes Inc. | 17.0B |
| Essex Property Trust, Inc. | 16.5B |
| Mid-America Apartment Communities, Inc. | 16.3B |
| UDR, Inc. | 12.1B |
| Camden Property Trust | 11.7B |
Essex Property Trust ranks 4th among its peers. Its market cap is 64% of the leader, AvalonBay Communities. Essex sits below both the average market cap of the top 10 (17.6B) and the median sector market cap (16.5B). It maintains a 3.67% gap from the next competitor above, indicating a tight cluster in the mid-tier range.
Comparisons with competitors
Check out how we compare the company to its competitors:
Does ESS have a competitive advantage?
Essex Property Trust, Inc. presents a very favorable competitive advantage. Its ROIC exceeds WACC by nearly 179%, indicating strong value creation and efficient capital allocation in its residential REIT sector.
Looking ahead, Essex is actively developing six new properties, expanding its 60,000-home portfolio on the West Coast. This pipeline supports growth opportunities in attractive California markets, enhancing its long-term profitability potential.
SWOT Analysis
This SWOT analysis highlights Essex Property Trust’s core advantages and risks to guide strategic decisions.
Strengths
- strong ROIC well above WACC
- robust dividend yield at 3.88%
- integrated West Coast market presence
Weaknesses
- high debt-to-equity ratio of 1.25
- low current and quick ratios signal liquidity risks
- high valuation multiples (PE 25x, PB 3x)
Opportunities
- expanding multifamily developments
- growing demand for West Coast housing
- potential for margin improvement via operational efficiency
Threats
- rising interest expenses pressure margins
- regulatory risks in California real estate
- economic downturn could reduce rental demand
Essex demonstrates a durable competitive advantage with solid profitability and growth prospects. However, elevated leverage and liquidity constraints require cautious capital management amid economic uncertainties.
Stock Price Action Analysis
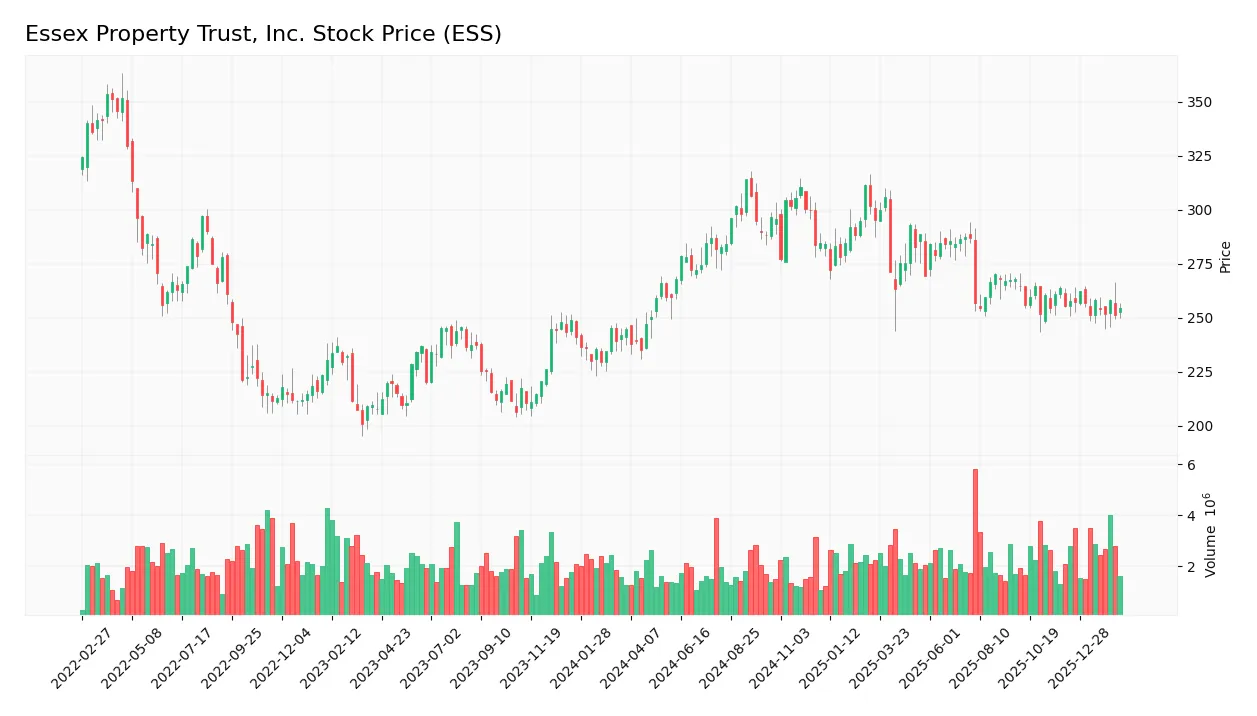
The weekly price chart for Essex Property Trust, Inc. (ESS) illustrates the stock’s performance over the last 100 weeks:
Trend Analysis
Over the past two years, ESS’s stock price rose 3.97%, indicating a bullish trend. The trend shows deceleration despite reaching a high of 314.05 and a low of 235.17. The price volatility is significant, with a standard deviation of 18.42, reflecting notable price swings.
Volume Analysis
Trading volume totals 250M shares, with a slight buyer majority at 50.95%. Volume trends upward, signaling growing market participation. However, recent three-month data show seller dominance at 59%, suggesting cautious or profit-taking sentiment among investors.
Target Prices
Analysts present a solid target consensus for Essex Property Trust, reflecting confidence in its valuation.
| Target Low | Target High | Consensus |
|---|---|---|
| 271 | 292 | 280.4 |
The target range from 271 to 292 indicates moderate upside potential. The consensus near 280 suggests steady investor confidence.

Don’t Let Luck Decide Your Entry Point
Optimize your entry points with our advanced ProRealTime indicators. You’ll get efficient buy signals with precise price targets for maximum performance. Start outperforming now!
Analyst & Consumer Opinions
This section examines the latest analyst ratings and consumer feedback concerning Essex Property Trust, Inc. (ESS).
Stock Grades
Here are the latest verified stock grades from leading financial institutions for Essex Property Trust, Inc.:
| Grading Company | Action | New Grade | Date |
|---|---|---|---|
| Cantor Fitzgerald | Maintain | Overweight | 2026-02-09 |
| BMO Capital | Downgrade | Market Perform | 2026-01-09 |
| UBS | Maintain | Neutral | 2026-01-08 |
| Jefferies | Downgrade | Hold | 2025-12-16 |
| Truist Securities | Maintain | Hold | 2025-12-16 |
| Barclays | Maintain | Equal Weight | 2025-11-25 |
| Mizuho | Maintain | Outperform | 2025-11-24 |
| UBS | Maintain | Neutral | 2025-11-10 |
| Wells Fargo | Maintain | Equal Weight | 2025-11-10 |
| Scotiabank | Maintain | Sector Outperform | 2025-11-04 |
The consensus indicates a cautious stance with multiple downgrades and a predominant “Hold” or equivalent rating. Analysts generally maintain stable views, reflecting balanced risk and opportunity perceptions.
Consumer Opinions
Consumer sentiment around Essex Property Trust, Inc. (ESS) reflects a blend of appreciation and concern.
| Positive Reviews | Negative Reviews |
|---|---|
| “Exceptional property management and maintenance.” | “Rent increases have outpaced local market averages.” |
| “Community amenities are well-kept and enhance living.” | “Customer service response times can be slow during peak seasons.” |
| “Prime locations with convenient access to urban centers.” | “Limited availability of affordable units in key markets.” |
Overall, tenants praise Essex’s strong property upkeep and prime locations. However, rising rents and occasional service delays remain recurring concerns, signaling areas for management to address.
Risk Analysis
Below is a table summarizing key risks facing Essex Property Trust, Inc., along with their likelihood and potential impact:
| Category | Description | Probability | Impact |
|---|---|---|---|
| Financial Leverage | High debt-to-equity ratio (1.25) increases financial risk | High | High |
| Liquidity | Zero current and quick ratios signal poor short-term liquidity | Medium | High |
| Valuation | Elevated P/E (25.08) and P/B (3.04) ratios may limit upside | Medium | Medium |
| Bankruptcy Risk | Altman Z-Score in distress zone (1.55) implies financial stress | Medium | High |
| Market Exposure | Concentration in West Coast multifamily residential REITs | Medium | Medium |
| Interest Coverage | Moderate interest coverage ratio (3.26) limits debt safety | Medium | Medium |
The most pressing risks for Essex are its high financial leverage and distress-level Altman Z-Score, which historically predict vulnerability during economic downturns. Its zero liquidity ratios pose a red flag for meeting short-term obligations. While valuation multiples are elevated relative to sector averages, they reflect growth expectations but limit margin for error. Prudence dictates monitoring debt levels closely amid rising interest rates.
Should You Buy Essex Property Trust, Inc.?
Essex Property Trust, Inc. appears to be delivering improving profitability with a durable competitive moat supported by a growing ROIC well above WACC. Despite a manageable leverage profile presenting some caution, the overall rating suggests a favorable investment profile.
Strength & Efficiency Pillars
Essex Property Trust, Inc. exhibits robust operational efficiency with a net margin of 35.38% and an EBIT margin of 44.07%, reflecting strong profitability. Its return on invested capital (ROIC) soars at 185.04%, vastly exceeding the weighted average cost of capital (WACC) of 6.06%, confirming the company as a clear value creator. Despite a modest return on equity of 12.14%, the company sustains a favorable gross margin of 68.82%, signaling effective cost management and competitive positioning.
Weaknesses and Drawbacks
The company is currently in financial distress, as indicated by an Altman Z-Score of 1.55, placing Essex in the distress zone with heightened bankruptcy risk. This solvency concern eclipses its strong operational metrics. Additionally, Essex faces valuation pressures with a price-to-earnings ratio of 25.08 and a price-to-book ratio of 3.04, both unfavorable and suggesting a premium valuation. Its debt-to-equity ratio stands at 1.25, heightening financial leverage risk, while liquidity ratios are critically low at zero, posing short-term liquidity challenges.
Our Final Verdict about Essex Property Trust, Inc.
Despite impressive operational margins and clear value creation, Essex’s distressed Altman Z-Score signals significant solvency risk. This risk overshadows profitability strengths, rendering the investment profile highly speculative and too risky for conservative capital. Investors should approach with caution, prioritizing risk management until financial health shows marked improvement.
Disclaimer: This content is for informational purposes only and does not constitute financial, investment, or other professional advice. Investing in financial markets involves a significant risk of loss, and past performance is not indicative of future results.
Additional Resources
- Decoding Essex Property Trust Inc (ESS): A Strategic SWOT Insigh – GuruFocus (Feb 21, 2026)
- Is Wall Street Bullish or Bearish on Essex Property Trust Stock? – Yahoo Finance (Feb 20, 2026)
- Essex Property Rewards Investors With Another Annual Dividend Hike – The Globe and Mail (Feb 21, 2026)
- Vanguard Group Inc. Has $2.77 Billion Stock Holdings in Essex Property Trust, Inc. $ESS – MarketBeat (Feb 19, 2026)
- REITs in the Community: Rep. Young Kim visits Essex Property Trust – Nareit (Feb 16, 2026)
For more information about Essex Property Trust, Inc., please visit the official website: essexapartmenthomes.com