Home > Analyses > Industrials > ESAB Corporation
ESAB Corporation powers the backbone of modern industry by enabling precise cutting and welding across countless applications. Its advanced consumables and automated welding systems set the standard in metal fabrication, driving innovation in sectors from infrastructure to renewable energy. Known for integrating digital solutions that boost productivity, ESAB shapes how factories and construction sites operate worldwide. The critical question remains: does ESAB’s robust foundation justify its current valuation and growth prospects in today’s evolving industrial landscape?

Table of contents
Business Model & Company Overview
ESAB Corporation, founded in 2021 and headquartered in Wilmington, Delaware, stands as a dominant player in metal fabrication manufacturing. It delivers an integrated ecosystem of cutting, joining, and automated welding solutions. The company’s portfolio spans consumables like electrodes and wires, advanced fabrication machines, and digital software that enhances productivity and operational monitoring across diverse industries.
Its revenue engine balances hardware sales with growing software and service offerings, driving recurring value. ESAB leverages a robust global footprint with strong presence in the Americas, Europe, and Asia. The company’s competitive advantage lies in combining advanced equipment with digital innovation, cementing its role as a key shaper of the industrial welding sector’s future.
Financial Performance & Fundamental Metrics
I analyze ESAB Corporation’s income statement, key financial ratios, and dividend payout policy to assess its profitability and capital allocation effectiveness.
Income Statement
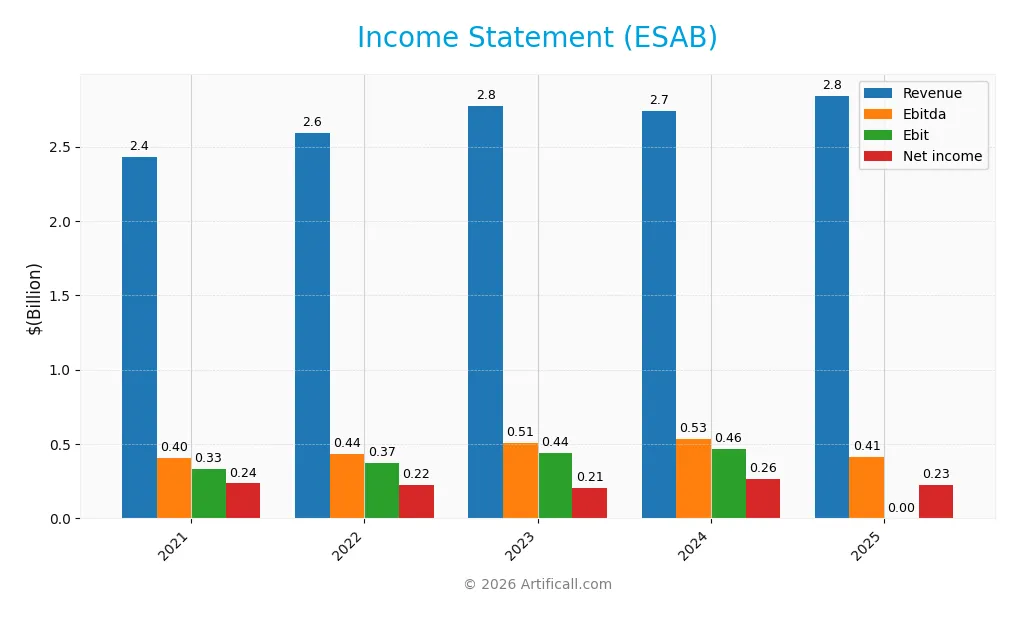
The table below presents ESAB Corporation’s key income statement figures for the fiscal years 2021 through 2025, reflecting revenue, profits, and earnings per share trends.
| 2021 | 2022 | 2023 | 2024 | 2025 | |
|---|---|---|---|---|---|
| Revenue | 2.43B | 2.59B | 2.77B | 2.74B | 2.84B |
| Cost of Revenue | 1.59B | 1.71B | 1.76B | 1.70B | 1.79B |
| Operating Expenses | 532M | 556M | 612M | 590M | 608M |
| Gross Profit | 838M | 886M | 1.02B | 1.04B | 1.05B |
| EBITDA | 405M | 435M | 509M | 531M | 412M |
| EBIT | 330M | 370M | 440M | 465M | – |
| Interest Expense | 0 | 38M | 85M | 65M | 84M |
| Net Income | 235M | 224M | 205M | 265M | 227M |
| EPS | 3.92 | 3.73 | 3.38 | 4.36 | 3.72 |
| Filing Date | 2021-12-31 | 2023-03-07 | 2024-02-29 | 2025-02-20 | 2026-02-20 |
Income Statement Evolution
From 2021 to 2025, ESAB’s revenue rose 17.1%, showing steady top-line growth. Gross profit also increased moderately, maintaining a favorable 36.9% margin. However, net income declined 3.6%, with net margin contracting by 17.6%. The latest year saw revenue growth slow to 3.7%, while net income and EPS decreased, reflecting margin pressures.
Is the Income Statement Favorable?
In 2025, ESAB reported $2.84B revenue and $227M net income, yielding a 7.98% net margin, deemed favorable versus peers. Interest expense remained low at 2.95% of revenue. However, EBIT margin fell to zero, signaling operating profitability challenges. Overall, the fundamentals present a mixed picture, with solid revenue growth offset by weakening earnings quality.
Financial Ratios
The following table summarizes key financial ratios for ESAB Corporation over the last five fiscal years, providing a snapshot of profitability, liquidity, leverage, and efficiency:
| Ratios | 2021 | 2022 | 2023 | 2024 | 2025 |
|---|---|---|---|---|---|
| Net Margin | 9.7% | 8.6% | 7.4% | 9.7% | 8.0% |
| ROE | 9.6% | 16.6% | 12.8% | 15.0% | 10.5% |
| ROIC | 7.9% | 8.0% | 8.8% | 10.3% | 7.9% |
| P/E | 12.8 | 12.6 | 25.4 | 27.4 | 0 |
| P/B | 1.2 | 2.1 | 3.2 | 4.1 | 0 |
| Current Ratio | 1.6 | 1.6 | 1.6 | 1.8 | 1.9 |
| Quick Ratio | 0.9 | 1.0 | 1.0 | 1.2 | 1.2 |
| D/E | 0.04 | 0.97 | 0.70 | 0.66 | 0.57 |
| Debt-to-Assets | 3.2% | 35.0% | 29.2% | 28.8% | 25.9% |
| Interest Coverage | 0 | 8.7 | 4.8 | 6.9 | 4.9 |
| Asset Turnover | 0.70 | 0.69 | 0.72 | 0.68 | 0.60 |
| Fixed Asset Turnover | 6.2 | 6.9 | 7.1 | 7.1 | 5.7 |
| Dividend Yield | 0 | 0.2% | 0.3% | 0.2% | 0% |
Evolution of Financial Ratios
ESAB’s Return on Equity (ROE) showed a general decline from a peak of 16.57% in 2022 to 10.47% in 2025, indicating reduced profitability. The Current Ratio improved slightly, rising from 1.61 in 2021 to 1.90 in 2025, suggesting enhanced short-term liquidity. Meanwhile, the Debt-to-Equity Ratio declined significantly from 0.97 in 2022 to 0.57 in 2025, reflecting lower financial leverage and risk.
Are the Financial Ratios Favorable?
In 2025, ESAB’s profitability ratios remain neutral with a net margin of 7.98% and ROE at 10.47%, close to its WACC of 8.72%. Liquidity ratios are favorable, with a current ratio near 1.9 and quick ratio at 1.17. Debt levels show a neutral stance with a 0.57 debt-to-equity ratio but favorable debt-to-assets at 25.91%. However, interest coverage and dividend yield are unfavorable, signaling caution on earnings coverage and shareholder returns. Overall, the ratios paint a slightly favorable financial profile.
Shareholder Return Policy
ESAB Corporation does not pay dividends as of 2025, reflecting a strategic focus on reinvestment rather than shareholder payouts. The absence of dividend yield aligns with the company’s allocation of free cash flow towards capital expenditures and operational growth initiatives.
The company engages in share buybacks, supporting shareholder value through capital return without direct dividends. This approach appears sustainable, as ESAB maintains a moderate debt level and positive free cash flow coverage, balancing growth with prudent capital management.
Score analysis
The following radar chart illustrates ESAB Corporation’s key financial performance scores across multiple valuation and profitability metrics:
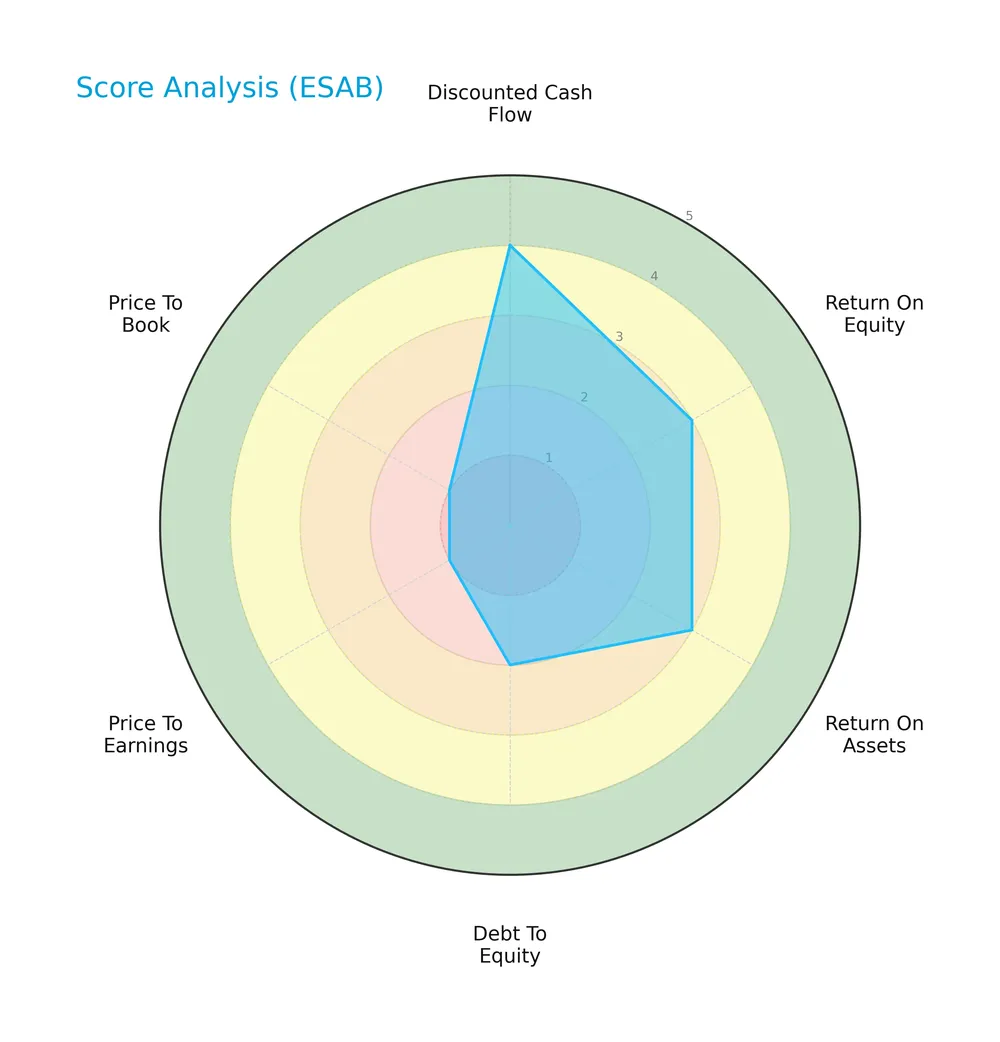
ESAB scores well on discounted cash flow with a favorable 4, while return on equity and assets register moderate scores of 3 each. However, debt-to-equity is unfavorable at 2, and valuation metrics price-to-earnings and price-to-book are very unfavorable with scores of 1 each.
Analysis of the company’s bankruptcy risk
ESAB’s Altman Z-Score stands at 3.12, placing it securely in the safe zone for bankruptcy risk:

Is the company in good financial health?
The Piotroski Score diagram provides insight into ESAB’s financial strength based on nine fundamental criteria:

With a Piotroski Score of 6, ESAB exhibits average financial health, indicating moderate strength but room for improvement in operational efficiency and profitability metrics.
Competitive Landscape & Sector Positioning
This sector analysis examines ESAB Corporation’s strategic positioning, revenue segments, key products, and main competitors. I will assess whether ESAB holds a competitive advantage within the industrial metal fabrication sector.
Strategic Positioning
ESAB Corporation concentrates on metal fabrication with a dual product portfolio: consumables (~1B in 2025) and equipment (~1.87B). Geographically, it balances exposure between Americas (~1.13B) and EMEA/APAC (~1.71B), reflecting targeted diversification across key industrial markets.
Revenue by Segment
This pie chart illustrates ESAB Corporation’s revenue distribution across Consumable and Equipment Products segments for fiscal year 2025.
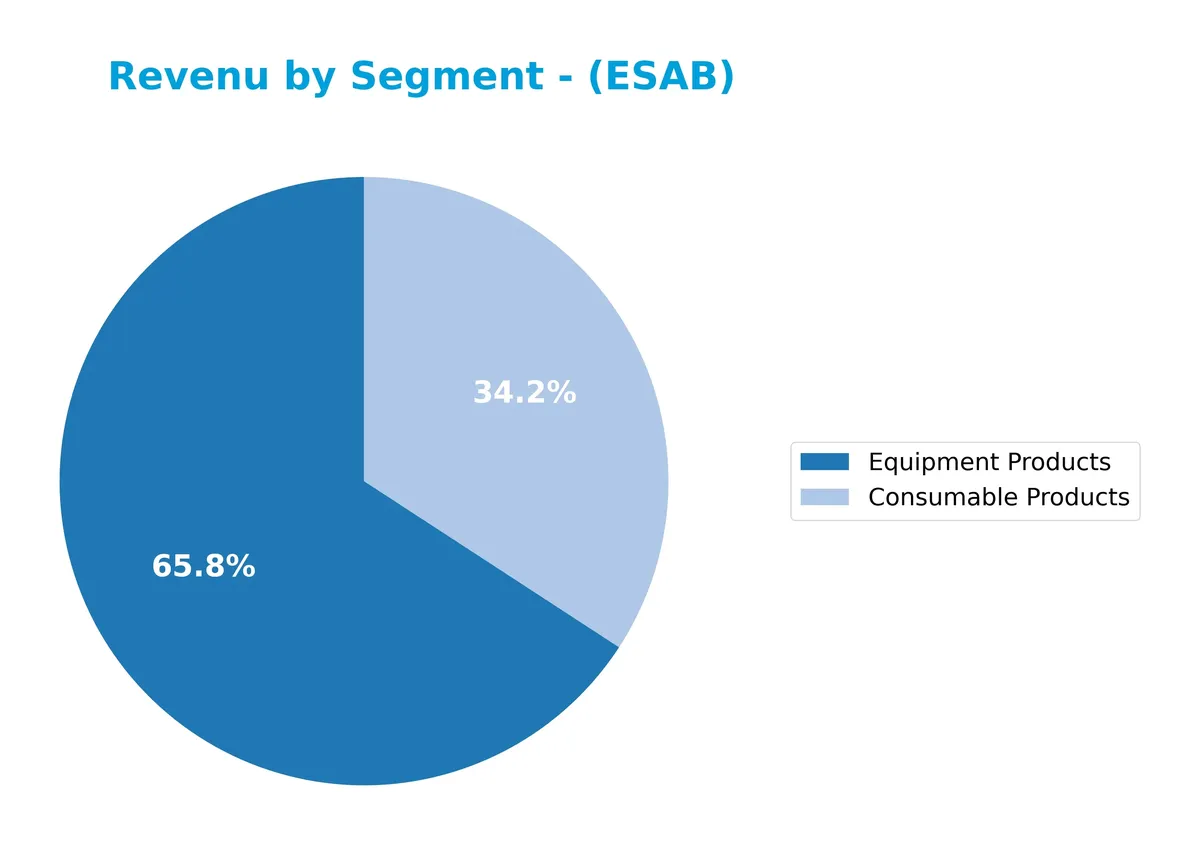
Equipment Products dominate ESAB’s revenue, generating $1.87B in 2025, slightly up from $1.85B in 2024. Consumable Products showed steady growth, reaching $972M, up from $893M the prior year. Historically, Equipment Products lead but with modest fluctuations, while Consumables steadily expand. The 2025 data suggests a balanced but Equipment-heavy portfolio, with Consumables gaining momentum, reducing concentration risk slightly.
Key Products & Brands
ESAB Corporation’s primary products and brands focus on welding and cutting consumables and equipment, detailed as follows:
| Product | Description |
|---|---|
| Consumable Products | Electrodes, cored and solid wires, fluxes, and cutting consumables like nozzles, shields, tips. |
| Equipment Products | Portable welding machines, large automated cutting and welding systems, and gas control equipment. |
ESAB’s product portfolio centers on consumables and equipment for cutting, joining, and automated welding. The company’s offerings serve diverse industries, including construction, transportation, and energy, supporting productivity and digital monitoring.
Main Competitors
There are 2 competitors in the Industrials sector; the table below lists the top 10 leaders by market capitalization:
| Competitor | Market Cap. |
|---|---|
| ESAB Corporation | 6.8B |
| Proto Labs, Inc. | 1.2B |
ESAB Corporation ranks 1st among its competitors with a market cap 15% above the top player benchmark. It stands above both the average market cap of the top 10 and the median for the sector. The company leads by a wide margin, with no competitor above and a -552% gap to the next rival.
Comparisons with competitors
Check out how we compare the company to its competitors:
Does ESAB have a competitive advantage?
ESAB does not currently present a competitive advantage. Its return on invested capital (ROIC) trails its weighted average cost of capital (WACC), indicating value destruction and declining profitability from 2021 to 2025.
Looking ahead, ESAB’s broad product range in welding and cutting, plus digital solutions, target diverse markets including renewable energy and medical sectors, suggesting potential growth opportunities.
SWOT Analysis
This SWOT analysis highlights ESAB Corporation’s key internal and external factors shaping its strategic position.
Strengths
- strong brand in welding and cutting technology
- broad product range including digital solutions
- solid market presence in Americas and EMEA/APAC
Weaknesses
- declining ROIC below WACC indicates value destruction
- shrinking net margin and EPS growth
- weak interest coverage ratio
Opportunities
- growing demand for automation and digital welding solutions
- expansion potential in renewable energy sector
- increasing infrastructure investments globally
Threats
- intense competition in metal fabrication
- raw material price volatility
- economic slowdown risks affecting industrial capex
ESAB’s strengths in technology and markets offer a solid base. However, persistent profitability declines and value destruction require urgent strategic shifts. Capitalizing on automation and green energy trends can restore growth and margin improvement.
Stock Price Action Analysis
The weekly stock chart of ESAB Corporation shows a clear upward momentum with notable price fluctuations over the recent months:
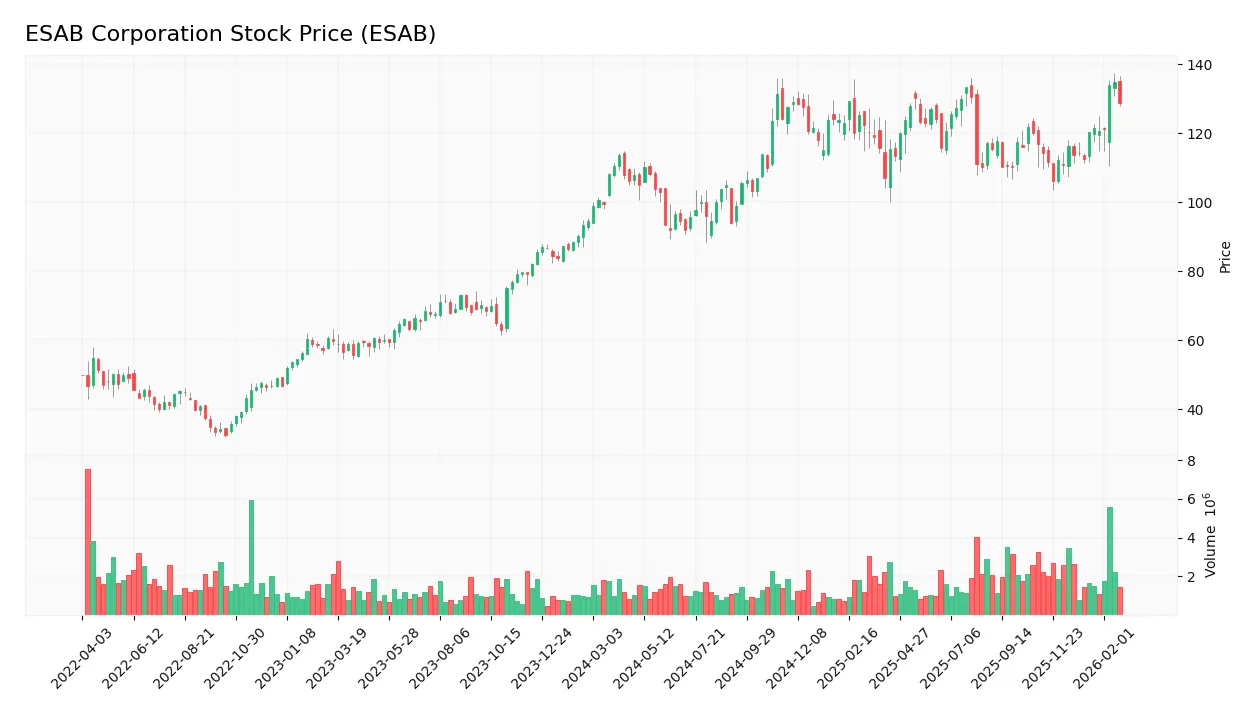
Trend Analysis
Over the past year, ESAB’s stock price increased by 16.33%, indicating a strong bullish trend. The trend shows acceleration, supported by a high standard deviation of 10.73, reflecting notable volatility. The stock hit a high of 134.82 and a low of 91.98, confirming dynamic upward movement.
Volume Analysis
Trading volume is increasing overall, with a buyer-driven pattern in the recent period. Buyers accounted for 65.09% of volume from December 2025 to February 2026, signaling strong market participation and positive investor sentiment. Sellers remain active but less dominant in this timeframe.
Target Prices
Analysts set a confident target consensus for ESAB Corporation, reflecting moderate upside potential.
| Target Low | Target High | Consensus |
|---|---|---|
| 140 | 149 | 145.4 |
The target range indicates steady confidence in ESAB’s valuation, with a consensus price suggesting slight appreciation from current levels.

Don’t Let Luck Decide Your Entry Point
Optimize your entry points with our advanced ProRealTime indicators. You’ll get efficient buy signals with precise price targets for maximum performance. Start outperforming now!
Analyst & Consumer Opinions
This section examines ESAB Corporation’s analyst ratings and consumer feedback to gauge market sentiment and satisfaction levels.
Stock Grades
Here are the latest verified analyst ratings for ESAB Corporation from leading financial institutions:
| Grading Company | Action | New Grade | Date |
|---|---|---|---|
| Roth Capital | Maintain | Buy | 2026-02-03 |
| JP Morgan | Maintain | Overweight | 2026-02-03 |
| Oppenheimer | Maintain | Outperform | 2026-01-23 |
| Stifel | Maintain | Buy | 2026-01-23 |
| JP Morgan | Maintain | Overweight | 2026-01-14 |
| Stifel | Maintain | Buy | 2025-12-16 |
| JP Morgan | Maintain | Overweight | 2025-10-30 |
| UBS | Maintain | Buy | 2025-10-20 |
| JP Morgan | Maintain | Overweight | 2025-10-14 |
| Loop Capital | Upgrade | Buy | 2025-08-22 |
The consensus clearly favors a buy stance, with dominant grades at Buy, Overweight, and Outperform. Analysts consistently maintain positive views, reflecting steady confidence in ESAB’s prospects.
Consumer Opinions
Consumer sentiment around ESAB Corporation reveals a mix of appreciation and concern, reflecting its operational strengths and areas needing improvement.
| Positive Reviews | Negative Reviews |
|---|---|
| High-quality welding equipment with durable build. | Customer service response times are slow. |
| Reliable performance even under heavy industrial use. | Some products are priced above competitors. |
| Strong product innovation and advanced technology. | Limited availability of certain replacement parts. |
Overall, consumers praise ESAB’s product durability and innovation, which align with its market leadership. However, recurring complaints about service speed and pricing suggest areas where the company could enhance customer satisfaction.
Risk Analysis
Below is a summary of key risks facing ESAB Corporation, highlighting their likelihood and potential impact:
| Category | Description | Probability | Impact |
|---|---|---|---|
| Market Volatility | ESAB’s beta of 1.20 indicates higher sensitivity to market swings. | Medium | Medium |
| Interest Coverage | Interest coverage ratio is 0.0, signaling potential difficulty servicing debt. | High | High |
| Valuation Risk | Price-to-earnings and price-to-book ratios are very unfavorable at zero. | High | Medium |
| Dividend Policy | No dividend yield may deter income-focused investors. | Medium | Low |
| Operational Risk | Asset turnover at 0.6 is neutral but below industry leaders, limiting efficiency gains. | Medium | Medium |
The most concerning risk is ESAB’s zero interest coverage ratio, which raises red flags about its ability to meet interest obligations. Combined with unfavorable valuation metrics, this could pressure the stock if market conditions worsen. Still, the Altman Z-Score places ESAB in the safe zone, suggesting bankruptcy risk remains low for now. Investors should monitor debt servicing closely.
Should You Buy ESAB Corporation?
ESAB appears to be in the safe zone per its Altman Z-Score, suggesting moderate financial stability. Despite an unfavorable and declining moat with value destruction, the firm shows manageable leverage but only average profitability. The overall B- rating reflects a mixed profile that could warrant cautious consideration.
Strength & Efficiency Pillars
ESAB Corporation maintains solid operational efficiency with a net margin of 7.98% and a return on equity of 10.47%, signaling moderate profitability. The company’s ROIC stands at 7.93%, slightly below its WACC of 8.72%, indicating it is currently not a value creator. However, ESAB’s gross margin of 36.88% and favorable interest expense ratio (2.95%) highlight cost control strengths. These metrics suggest a stable operational base despite challenges in delivering superior capital returns.
Weaknesses and Drawbacks
ESAB grapples with significant valuation and leverage concerns. The company posts very unfavorable scores for Price-to-Earnings and Price-to-Book ratios, reflecting potential overvaluation or market skepticism. While debt-to-equity remains moderate at 0.57, interest coverage is notably unfavorable, signaling difficulty in meeting interest obligations. This financial strain could pressure liquidity and increase refinancing risk. Additionally, declining net margin growth (-17.44%) and EPS contraction (-13.69%) highlight profitability erosion, raising caution for investors.
Our Final Verdict about ESAB Corporation
ESAB’s financial profile suggests moderate operational strength, but its inability to generate returns above cost of capital dampens value creation prospects. Despite a bullish overall stock trend and recent buyer dominance (65.09%), valuation and weakening profitability metrics advise caution. The company might appear suitable for investors with a higher risk tolerance but suggests a wait-and-see stance for those seeking more robust fundamentals and margin stability.
Disclaimer: This content is for informational purposes only and does not constitute financial, investment, or other professional advice. Investing in financial markets involves a significant risk of loss, and past performance is not indicative of future results.
Additional Resources
- ESAB Corporation (NYSE:ESAB) Given Average Recommendation of “Moderate Buy” by Brokerages – MarketBeat (Feb 18, 2026)
- Esab: Q4 Earnings Snapshot – KVUE (Feb 20, 2026)
- ESAB Corporation to Acquire Eddyfi Technologies, Creating an Unrivaled Provider of Complete Workflow Solutions – Business Wire (Feb 02, 2026)
- ESAB Corporation Confirms Fourth Quarter And Full Year 2025 Results – TradingView (Feb 20, 2026)
- Esab (ESAB) Q4 Earnings Surpass Estimates – Yahoo Finance (Feb 20, 2026)
For more information about ESAB Corporation, please visit the official website: esab.com