Home > Analyses > Real Estate > Equity Residential
Equity Residential transforms urban living by shaping vibrant communities across America’s most dynamic cities. As a dominant force in residential real estate, it manages nearly 79K apartment units in high-demand markets like New York and San Francisco. Renowned for strategic property development and tenant-centric management, the company blends innovation with quality. But in a shifting economic landscape, can Equity Residential’s fundamentals still support its premium valuation and future growth?

Table of contents
Business Model & Company Overview
Equity Residential, founded in 1993 and headquartered in Chicago, stands as a leader in the REIT – Residential sector. It operates a vast ecosystem of 305 properties with 78,568 apartment units across vibrant U.S. cities like Boston, New York, and San Francisco. The company’s mission centers on cultivating communities that attract and retain high-quality long-term renters, reinforcing its dominant position within dynamic urban markets.
The firm’s revenue engine balances property acquisition, development, and management, generating steady cash flow from rental income. Its portfolio spans key regions in the Americas, including major metropolitan hubs on both coasts and central U.S. cities. Equity Residential’s competitive advantage lies in its scale and strategic footprint, which create significant barriers to entry and position it to shape the future of urban residential living.
Financial Performance & Fundamental Metrics
I analyze Equity Residential’s income statement, key financial ratios, and dividend payout policy to assess its operational efficiency and shareholder returns.
Income Statement
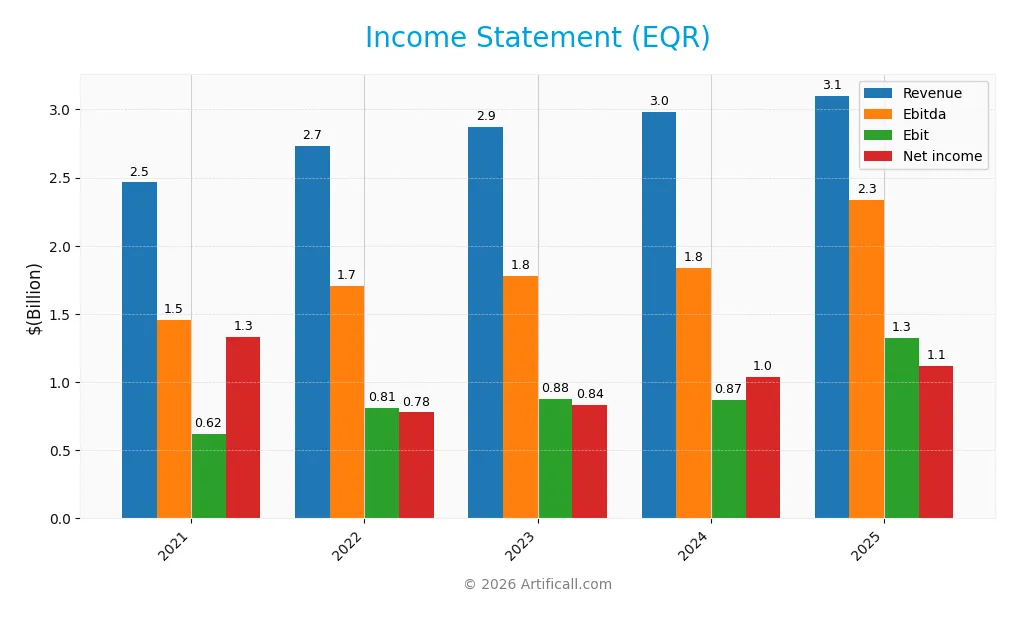
The table below presents Equity Residential’s key income statement figures for the fiscal years 2021 through 2025, reported in USD.
| 2021 | 2022 | 2023 | 2024 | 2025 | |
|---|---|---|---|---|---|
| Revenue | 2.46B | 2.74B | 2.87B | 2.98B | 3.10B |
| Cost of Revenue | 949M | 983M | 1.05B | 1.09B | 1.66B |
| Operating Expenses | -161M | 59M | 61M | 62M | 310M |
| Gross Profit | 1.52B | 1.75B | 1.83B | 1.89B | 1.44B |
| EBITDA | 1.46B | 1.71B | 1.78B | 1.84B | 2.34B |
| EBIT | 620M | 812M | 878M | 872M | 1.32B |
| Interest Expense | 0 | 0 | 0 | 286M | 237M |
| Net Income | 1.33B | 777M | 835M | 1.04B | 1.12B |
| EPS | 3.56 | 2.06 | 2.20 | 2.73 | 2.97 |
| Filing Date | 2022-02-17 | 2023-02-16 | 2024-02-15 | 2025-02-13 | 2026-02-13 |
Income Statement Evolution
From 2021 to 2025, Equity Residential’s revenue grew 25.9%, reflecting steady expansion. However, net income declined 16%, revealing margin pressure. Gross margin slipped from a peak in 2024, down 23.8% year-over-year in 2025. EBITDA and EBIT margins improved, with EBIT growing 52% in 2025, highlighting operational efficiency gains despite cost challenges.
Is the Income Statement Favorable?
In 2025, fundamentals appear generally favorable. The company posted a strong 36.1% net margin and 42.7% EBIT margin, both above industry norms. Revenue grew modestly 4.1%, while net income and EPS increased by approximately 4% and 7%, respectively. Interest expense remains neutral at 7.7% of revenue. Rising operating expenses and shrinking gross profit margin pose cautionary signals.
Financial Ratios
The following table summarizes key financial ratios for Equity Residential (EQR) over the past five fiscal years, providing a clear view of its profitability, valuation, liquidity, leverage, and efficiency metrics:
| Ratios | 2021 | 2022 | 2023 | 2024 | 2025 |
|---|---|---|---|---|---|
| Net Margin | 54.1% | 28.4% | 29.1% | 34.8% | 36.1% |
| ROE | 12.2% | 7.0% | 7.5% | 9.4% | 10.1% |
| ROIC | 8.1% | 8.5% | 9.0% | 8.9% | 2.2% |
| P/E | 25.4 | 28.6 | 27.7 | 26.2 | 21.3 |
| P/B | 3.1 | 2.0 | 2.1 | 2.5 | 2.2 |
| Current Ratio | 0.50 | 0.26 | 0.17 | 0.16 | 0.05 |
| Quick Ratio | 0.50 | 0.26 | 0.17 | 0.16 | 0.05 |
| D/E | 0.79 | 0.69 | 0.69 | 0.76 | 0.80 |
| Debt-to-Assets | 40.9% | 38.3% | 38.4% | 40.4% | 42.3% |
| Interest Coverage | N/A | N/A | 0.0 | 6.4 | 4.7 |
| Asset Turnover | 0.12 | 0.14 | 0.14 | 0.14 | 0.15 |
| Fixed Asset Turnover | 5.2 | 5.9 | 6.3 | 6.5 | 6.8 |
| Dividend Yield | 2.7% | 4.2% | 4.3% | 3.8% | 4.4% |
Evolution of Financial Ratios
Return on Equity (ROE) showed a gradual decline from 12.17% in 2021 to 10.14% in 2025, indicating slowed growth in shareholder returns. The Current Ratio dropped sharply from 0.50 in 2021 to 0.05 in 2025, signaling weakening liquidity. Debt-to-Equity remained relatively stable around 0.7 to 0.8, reflecting consistent leverage management. Profitability margins stayed strong and fairly stable.
Are the Financial Ratios Favorable?
In 2025, profitability metrics like net margin (36.12%) and ROIC (219.27%) are favorable, supported by a WACC of 6.22%. Liquidity ratios such as Current and Quick Ratios are unfavorable at 0.05, posing potential short-term risk. Leverage ratios including Debt-to-Equity (0.8) and Debt-to-Assets (42.34%) are neutral. Efficiency ratios show mixed signals: asset turnover is unfavorable at 0.15, but fixed asset turnover is favorable at 6.82. Dividend yield at 4.37% is also favorable. Overall, the ratios lean slightly favorable.
Shareholder Return Policy
Equity Residential maintains a high dividend payout ratio near 93%, with dividends per share steadily increasing to $2.75 in 2025. The annual dividend yield stands at 4.37%, supported by consistent free cash flow coverage, while share buybacks also form part of the capital return strategy.
This distribution approach appears sustainable, balancing income return and capital preservation. However, the elevated payout ratio warrants monitoring for potential stress in less favorable market conditions, underscoring the need for prudent risk management.
Score analysis
The following radar chart illustrates Equity Residential’s key financial scores and valuation metrics:

Equity Residential scores favorably on discounted cash flow (4) and return on equity (4). Return on assets is very strong at 5. Debt to equity is moderate at 3. Price-to-earnings and price-to-book ratios are unfavorable at 2 each.
Analysis of the company’s bankruptcy risk
The Altman Z-Score places Equity Residential in the grey zone, indicating a moderate risk of financial distress:

Is the company in good financial health?
The Piotroski Score diagram highlights key aspects of the company’s financial strength:

With a score of 7 classified as strong, Equity Residential demonstrates solid profitability, efficiency, and financial stability compared to weaker peers.
Competitive Landscape & Sector Positioning
This analysis explores Equity Residential’s strategic positioning within the residential REIT sector. I will examine revenue streams, key products, and main competitors. I aim to determine whether Equity Residential holds a competitive advantage over its peers.
Strategic Positioning
Equity Residential focuses on residential properties in major U.S. urban markets, owning 305 properties with 78.5K units. Its geographic exposure concentrates in high-demand cities like Boston, New York, and San Francisco, reflecting a targeted strategy rather than broad diversification.
Revenue by Segment
This pie chart presents Equity Residential’s revenue breakdown by segment for the fiscal year 2020, highlighting key income sources within the company’s rental operations.
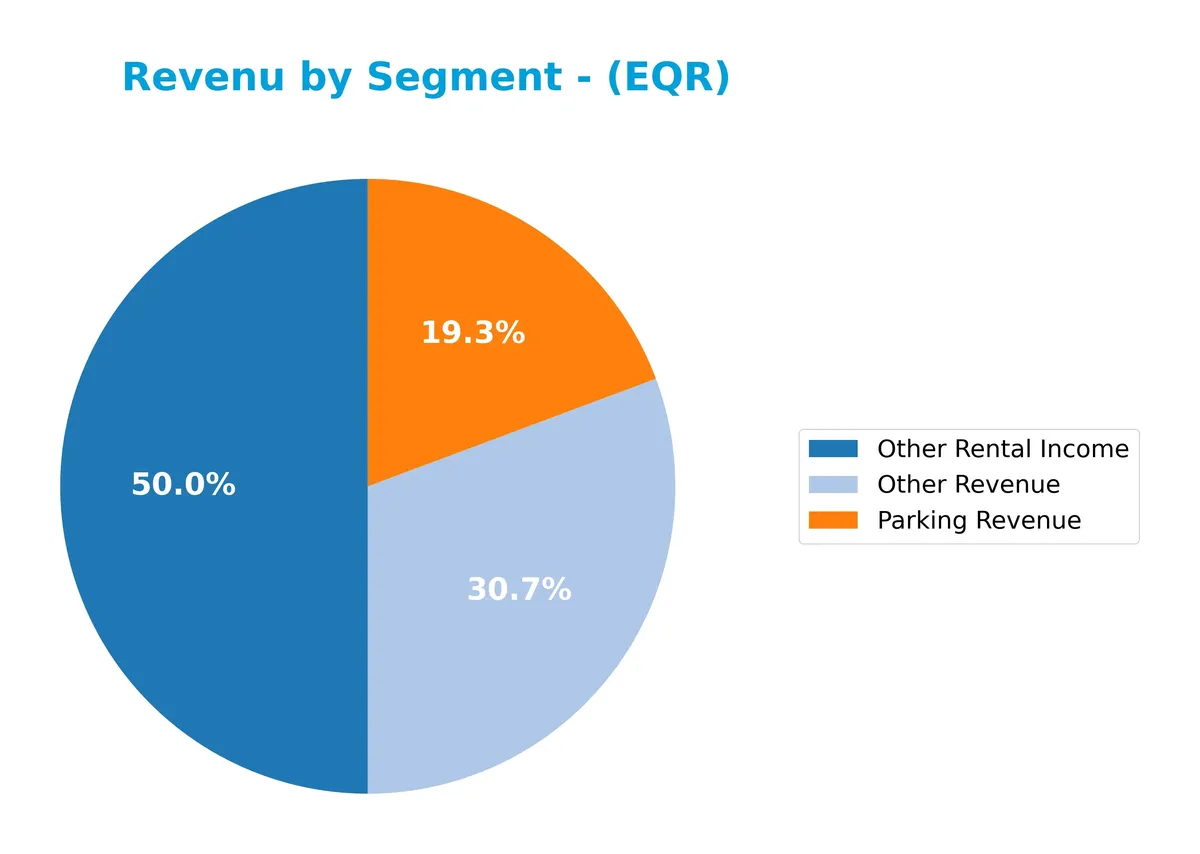
In 2020, Other Rental Income led with $57.5M, followed by Other Revenue at $35.3M and Parking Revenue at $22.2M. Compared to prior years, the composition shows a diversification away from geographic segments towards more specific revenue streams, signaling a shift in business focus. The drop in segment detail suggests rising concentration risk in miscellaneous rental and ancillary services.
Key Products & Brands
The following table outlines Equity Residential’s key revenue-generating products and brand segments:
| Product | Description |
|---|---|
| Apartment Rentals | Residential apartment units in 305 properties across major U.S. cities, generating primary income. |
| Other Rental Income | Ancillary rental fees contributing tens of millions annually, including varied lease-related charges. |
| Parking Revenue | Fees collected from parking facilities associated with residential properties. |
| Utility Recoveries | Reimbursements for utilities paid by tenants, recorded in certain fiscal years. |
| Geographic Segments | Revenue streams segmented by regions: Northeast, Northwest, Southeast, and Southwest, reflecting diversified market exposure. |
| Starwood Portfolio | Historical revenue from acquired Starwood residential properties, significant in past years. |
Equity Residential’s revenue streams center on large-scale residential apartment rentals, supplemented by parking and utility fees. Geographic diversification across U.S. urban hubs supports stable cash flow.
Main Competitors
There are 7 competitors in total, with the table below showing the top 7 leaders by market capitalization:
| Competitor | Market Cap. |
|---|---|
| AvalonBay Communities, Inc. | 25.6B |
| Equity Residential | 23.6B |
| Invitation Homes Inc. | 17.0B |
| Essex Property Trust, Inc. | 16.5B |
| Mid-America Apartment Communities, Inc. | 16.3B |
| UDR, Inc. | 12.1B |
| Camden Property Trust | 11.7B |
Equity Residential ranks 2nd among its 7 competitors. Its market cap stands at 94.7% of the leader, AvalonBay Communities. The company is above both the average market cap of the top 10 competitors (17.6B) and the sector median (16.5B). It maintains a 5.57% gap below the leader, showing a strong but not dominant position.
Comparisons with competitors
Check out how we compare the company to its competitors:
Does Equity Residential have a competitive advantage?
Equity Residential demonstrates a very favorable competitive advantage, consistently generating returns on invested capital (ROIC) well above its cost of capital (WACC). The company’s growing ROIC trend signals efficient capital use and sustainable value creation in the residential REIT sector.
Looking ahead, Equity Residential’s focus on high-quality urban properties in major U.S. cities positions it to capitalize on strong rental demand. Opportunities lie in strategic acquisitions and developments in dynamic markets like Boston, Seattle, and Southern California.
SWOT Analysis
This SWOT analysis highlights Equity Residential’s key strategic factors shaping its market position in 2026.
Strengths
- Strong ROIC far above WACC
- Favorable net margin at 36%
- Solid dividend yield of 4.37%
Weaknesses
- Very low current and quick ratios (0.05)
- Declining net income and margin over 5 years
- Asset turnover below industry average (0.15)
Opportunities
- Urban residential demand recovery
- Expansion in high-growth metro areas
- Potential for operational efficiency gains
Threats
- Rising interest rates increasing debt costs
- Market competition in top cities
- Economic downturn reducing rental demand
Equity Residential boasts a durable competitive advantage with strong profitability and shareholder returns. However, its liquidity constraints and recent earnings pressure require cautious capital management. Growth hinges on leveraging urban demand while mitigating rising debt risks.
Stock Price Action Analysis
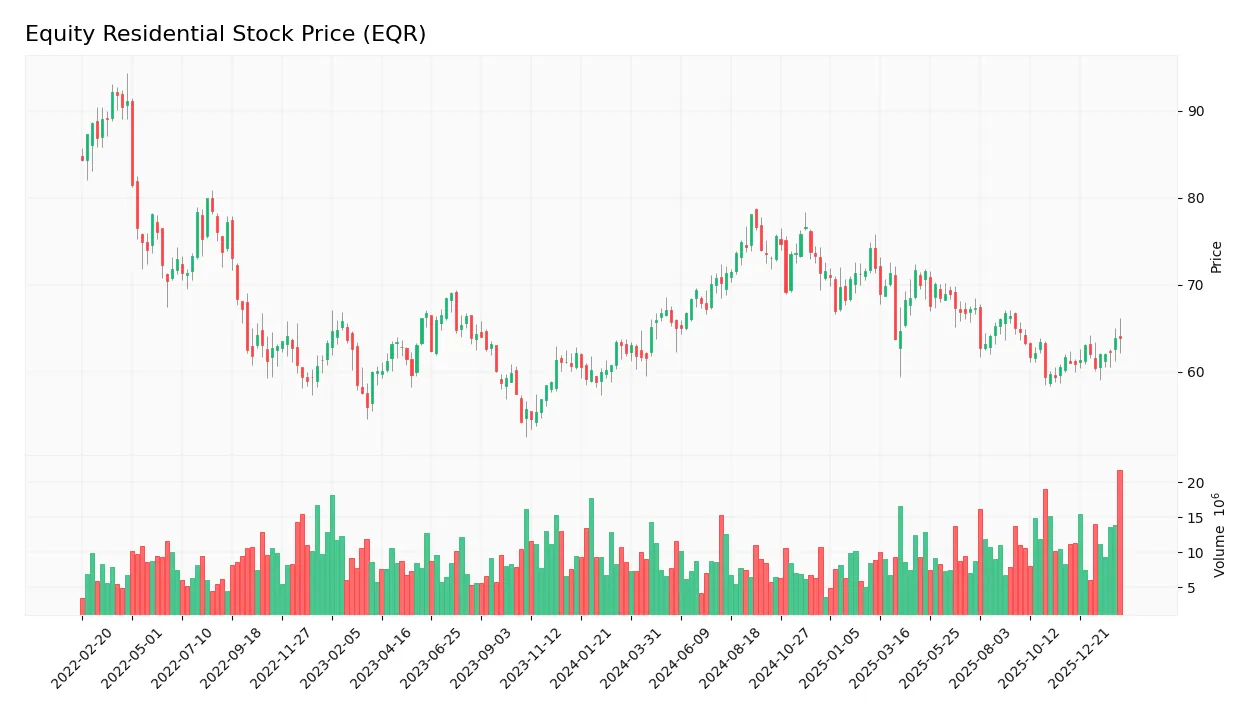
The following weekly chart displays Equity Residential’s stock price movements over the past 12 months:
Trend Analysis
Over the past 12 months, EQR’s stock price increased by 2.72%, indicating a bullish trend with accelerating momentum. The price ranged between 59.42 and 78.08, showing notable volatility with a 4.62 standard deviation. Recent weeks show a 3.42% rise and a positive slope of 0.2, confirming sustained upward acceleration.
Volume Analysis
Trading volume is increasing, with buyers accounting for 55.18% of activity from November 2025 to February 2026. Buyer volume slightly exceeds seller volume, suggesting mild buyer dominance and growing investor participation in this period.
Target Prices
Analysts show a clear target price consensus for Equity Residential.
| Target Low | Target High | Consensus |
|---|---|---|
| 63 | 78.5 | 70.85 |
The target range signals moderate upside potential. Analysts expect steady appreciation aligned with sector norms.

Don’t Let Luck Decide Your Entry Point
Optimize your entry points with our advanced ProRealTime indicators. You’ll get efficient buy signals with precise price targets for maximum performance. Start outperforming now!
Analyst & Consumer Opinions
This section examines recent analyst grades and consumer feedback related to Equity Residential’s market performance and reputation.
Stock Grades
Here are the latest verified analyst grades for Equity Residential from established financial firms:
| Grading Company | Action | New Grade | Date |
|---|---|---|---|
| Cantor Fitzgerald | Maintain | Neutral | 2026-02-09 |
| BMO Capital | Downgrade | Market Perform | 2026-01-09 |
| UBS | Maintain | Buy | 2026-01-08 |
| Barclays | Maintain | Overweight | 2025-11-25 |
| Mizuho | Maintain | Neutral | 2025-11-24 |
| Truist Securities | Maintain | Buy | 2025-11-17 |
| Morgan Stanley | Maintain | Equal Weight | 2025-11-13 |
| Wells Fargo | Maintain | Equal Weight | 2025-11-10 |
| UBS | Maintain | Buy | 2025-11-10 |
| Scotiabank | Maintain | Sector Perform | 2025-11-04 |
The consensus trend leans toward a cautious stance, with many firms maintaining neutral or equal weight grades. Notably, UBS and Truist continue to support a buy rating, while BMO recently downgraded to market perform.
Consumer Opinions
Consumers express mixed feelings about Equity Residential, reflecting both satisfaction with its core offerings and concerns over specific service aspects.
| Positive Reviews | Negative Reviews |
|---|---|
| “Well-maintained properties with modern amenities.” | “Maintenance requests take too long to resolve.” |
| “Responsive leasing staff and convenient online services.” | “Rent increases feel steep compared to local market.” |
| “Locations are prime for urban professionals.” | “Noise insulation between units could be better.” |
Overall, tenants appreciate Equity Residential’s quality housing and location advantages. However, slow maintenance responses and rising rents frequently dampen satisfaction. These factors warrant close monitoring for long-term tenant retention.
Risk Analysis
Below is a summary of key risks facing Equity Residential, highlighting their likelihood and potential impact:
| Category | Description | Probability | Impact |
|---|---|---|---|
| Liquidity | Extremely low current and quick ratios (0.05) signal tight liquidity. | High | High |
| Market Volatility | Beta of 0.76 suggests moderate sensitivity to market swings. | Medium | Medium |
| Leverage | Debt-to-assets at 42.3% and debt-to-equity moderate at 0.8. | Medium | Medium |
| Operational | Low asset turnover (0.15) may limit revenue growth potential. | Medium | Medium |
| Interest Rate | Rising rates could pressure financing costs despite strong coverage (5.58). | Medium | High |
| Bankruptcy Risk | Altman Z-Score in grey zone (1.94) indicates moderate financial distress risk. | Medium | High |
The most pressing risk is Equity Residential’s razor-thin liquidity, posing immediate operational challenges. The grey zone Altman Z-score combined with a moderate debt load demands caution. Interest rate hikes threaten to inflate costs despite solid interest coverage. I see these as critical factors for investors to monitor closely.
Should You Buy Equity Residential?
Equity Residential appears to be a profitable company with improving operational efficiency and a durable competitive moat supported by strong value creation. Despite a moderate leverage profile and some liquidity concerns, its overall rating could be seen as very favorable, suggesting a cautiously optimistic investment profile.
Strength & Efficiency Pillars
Equity Residential demonstrates robust operational efficiency, with a strong net margin of 36.12% and an EBIT margin of 42.73%. The company’s return on invested capital (ROIC) stands at an impressive 219.27%, significantly exceeding its weighted average cost of capital (WACC) of 6.22%, confirming it as a clear value creator. While return on equity (ROE) is moderate at 10.14%, the firm maintains a favorable interest coverage ratio of 5.58, underscoring disciplined capital management. These metrics highlight a sustainable competitive advantage with increasing profitability.
Weaknesses and Drawbacks
The Altman Z-Score of 1.94 places Equity Residential in the grey zone, signaling moderate bankruptcy risk that investors should monitor closely. Liquidity poses a critical challenge, as reflected in the severely low current and quick ratios of 0.05 each, raising concerns about short-term cash flow adequacy. Valuation metrics are neutral to slightly elevated, with a price-to-earnings ratio of 21.34 and a price-to-book ratio of 2.16, indicating the stock trades at a modest premium. Asset turnover at 0.15 is weak, suggesting inefficient asset utilization, which could pressure future earnings.
Our Final Verdict about Equity Residential
Equity Residential presents a fundamentally strong profile with exceptional value creation and operational margins. However, the moderate solvency risk indicated by the Altman Z-Score tempers enthusiasm, warranting caution. Despite a bullish long-term trend and buyer dominance at 55.18%, the company’s liquidity constraints and moderate leverage suggest this investment might appear attractive only to those comfortable with some financial risk. A wait-and-see approach could suit conservative investors seeking a clearer margin of safety.
Disclaimer: This content is for informational purposes only and does not constitute financial, investment, or other professional advice. Investing in financial markets involves a significant risk of loss, and past performance is not indicative of future results.
Additional Resources
- Aberdeen Group plc Boosts Holdings in Equity Residential $EQR – MarketBeat (Feb 17, 2026)
- Is Equity Residential (EQR) Pricing Reflect Recent REIT Sentiment Shift? – Yahoo Finance Singapore (Feb 15, 2026)
- Equity Residential saw AI, automation bump in 2025 – Multifamily Dive (Feb 10, 2026)
- Assessing Equity Residential (EQR) Valuation After Recent Share Price Recovery – simplywall.st (Feb 14, 2026)
- Equity Residential secures new $2.5 billion credit agreement – MSN (Feb 16, 2026)
For more information about Equity Residential, please visit the official website: equityapartments.com