Home > Analyses > Real Estate > Equinix, Inc.
Equinix powers the digital backbone connecting global businesses in real time. As a dominant data center REIT, it hosts critical infrastructure that fuels cloud computing, content delivery, and digital services worldwide. Known for its innovation and expansive global footprint, Equinix sets the standard for interconnection and reliability. The key question now: does Equinix’s robust platform and market position justify its premium valuation and promise sustained growth in 2026?
Table of contents
Business Model & Company Overview
Equinix, Inc., founded in 2000 and headquartered in Redwood City, CA, stands as a global leader in digital infrastructure. It operates a vast ecosystem connecting businesses to critical data centers and interconnection services. The company’s core mission focuses on enabling digital leaders to scale with agility and accelerate innovation through a trusted platform that integrates foundational infrastructure worldwide.
Equinix’s revenue engine balances premium data center hardware with recurring interconnection and cloud services. Its strategic footprint spans the Americas, Europe, and Asia, supporting clients in launching digital services rapidly and delivering superior experiences. This blend of physical assets and software-driven services builds a robust economic moat, positioning Equinix as a pivotal force shaping the future of global digital connectivity.
Financial Performance & Fundamental Metrics
I analyze Equinix’s income statement, key financial ratios, and dividend payout policy to uncover the company’s operational efficiency and shareholder value dynamics.
Income Statement
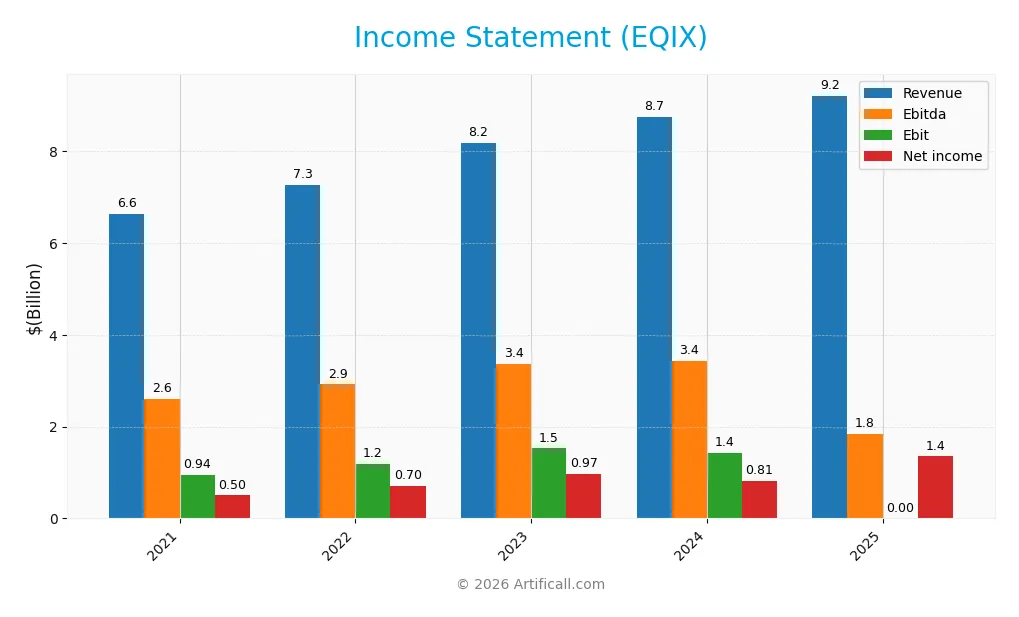
Below is Equinix, Inc.’s Income Statement summary for the fiscal years 2021 through 2025. It highlights key profitability metrics and EPS trends.
| 2021 | 2022 | 2023 | 2024 | 2025 | |
|---|---|---|---|---|---|
| Revenue | 6.64B | 7.26B | 8.19B | 8.75B | 9.22B |
| Cost of Revenue | 3.47B | 3.75B | 4.23B | 4.47B | 4.51B |
| Operating Expenses | 2.05B | 2.31B | 2.52B | 2.95B | 2.86B |
| Gross Profit | 3.16B | 3.51B | 3.96B | 4.28B | 4.71B |
| EBITDA | 2.60B | 2.92B | 3.37B | 3.44B | 1.85B |
| EBIT | 945M | 1.19B | 1.53B | 1.43B | 0 |
| Interest Expense | 336M | 356M | 402M | 457M | 527M |
| Net Income | 500M | 704M | 969M | 815M | 1.35B |
| EPS | 5.57 | 7.69 | 10.35 | 8.54 | 13.79 |
| Filing Date | 2022-02-18 | 2023-02-27 | 2024-02-16 | 2025-02-12 | 2026-02-11 |
Income Statement Evolution
Equinix’s revenue rose steadily from 6.6B in 2021 to 9.2B in 2025, marking a 39% growth over five years. Net income surged 170%, reflecting improved profitability. Gross margin remained strong near 51%, while net margin expanded significantly, indicating better cost control despite EBIT’s decline in the latest year.
Is the Income Statement Favorable?
In 2025, Equinix reported 9.2B revenue and 1.35B net income, with a net margin of 14.65%, signaling solid profitability. Interest expense at -5.72% supports financial leverage efficiency. However, EBIT dropped to zero, a notable weakness. Overall, 79% of income metrics are favorable, suggesting fundamentally sound but mixed operational performance.
Financial Ratios
The table below presents key financial ratios for Equinix, Inc. from 2021 to 2025, illustrating profitability, liquidity, leverage, efficiency, and dividend metrics:
| Ratios | 2021 | 2022 | 2023 | 2024 | 2025 |
|---|---|---|---|---|---|
| Net Margin | 7.5% | 9.7% | 11.8% | 9.3% | 14.6% |
| ROE | 4.6% | 6.1% | 7.8% | 6.0% | 9.5% |
| ROIC | 3.4% | 3.5% | 4.0% | 3.3% | 5.1% |
| P/E | 152 | 85 | 78 | 110 | 56 |
| P/B | 7.0 | 5.2 | 6.0 | 6.7 | 5.3 |
| Current Ratio | 1.84 | 1.80 | 1.13 | 1.63 | 1.32 |
| Quick Ratio | 1.84 | 1.80 | 1.13 | 1.63 | 1.32 |
| D/E | 1.38 | 1.43 | 1.40 | 1.40 | 1.47 |
| Debt-to-Assets | 54% | 54% | 53% | 54% | 52% |
| Interest Coverage | 3.3x | 3.4x | 3.6x | 2.9x | -3.5x |
| Asset Turnover | 0.24 | 0.24 | 0.25 | 0.25 | 0.23 |
| Fixed Asset Turnover | 0.40 | 0.40 | 0.41 | 0.42 | 0.37 |
| Dividend Yield | 1.4% | 1.9% | 1.8% | 1.8% | 2.5% |
Evolution of Financial Ratios
Return on Equity (ROE) showed a modest rise from 4.6% in 2021 to 9.5% in 2025, signaling some improvement in profitability. The Current Ratio declined steadily from 1.84 in 2021 to 1.32 in 2025, indicating reduced short-term liquidity. Debt-to-Equity Ratio increased slightly to 1.47 in 2025, reflecting higher leverage over the period.
Are the Financial Ratios Favorable?
In 2025, profitability measured by net margin at 14.65% is favorable, yet ROE at 9.54% remains below ideal benchmarks. Liquidity ratios are mixed: quick ratio is favorable at 1.32, but current ratio is neutral. Leverage is concerning with debt-to-equity at 1.47 and debt-to-assets over 51%, both unfavorable. Market multiples such as P/E at 55.55 and P/B at 5.3 also appear stretched, suggesting caution.
Shareholder Return Policy
Equinix, Inc. pays dividends, with a payout ratio exceeding 100% at 138% in 2025 and a dividend yield near 2.5%. The dividend per share has steadily increased over recent years, supported by free cash flow coverage, though payout above net income signals potential sustainability risks.
The company also engages in share buybacks, complementing its return strategy. While steady dividends and buybacks benefit shareholders, the high payout ratio calls for caution. This policy must balance distribution with reinvestment to ensure sustainable long-term value creation.
Score analysis
Here is a radar chart illustrating Equinix, Inc.’s fundamental scores across key financial metrics:
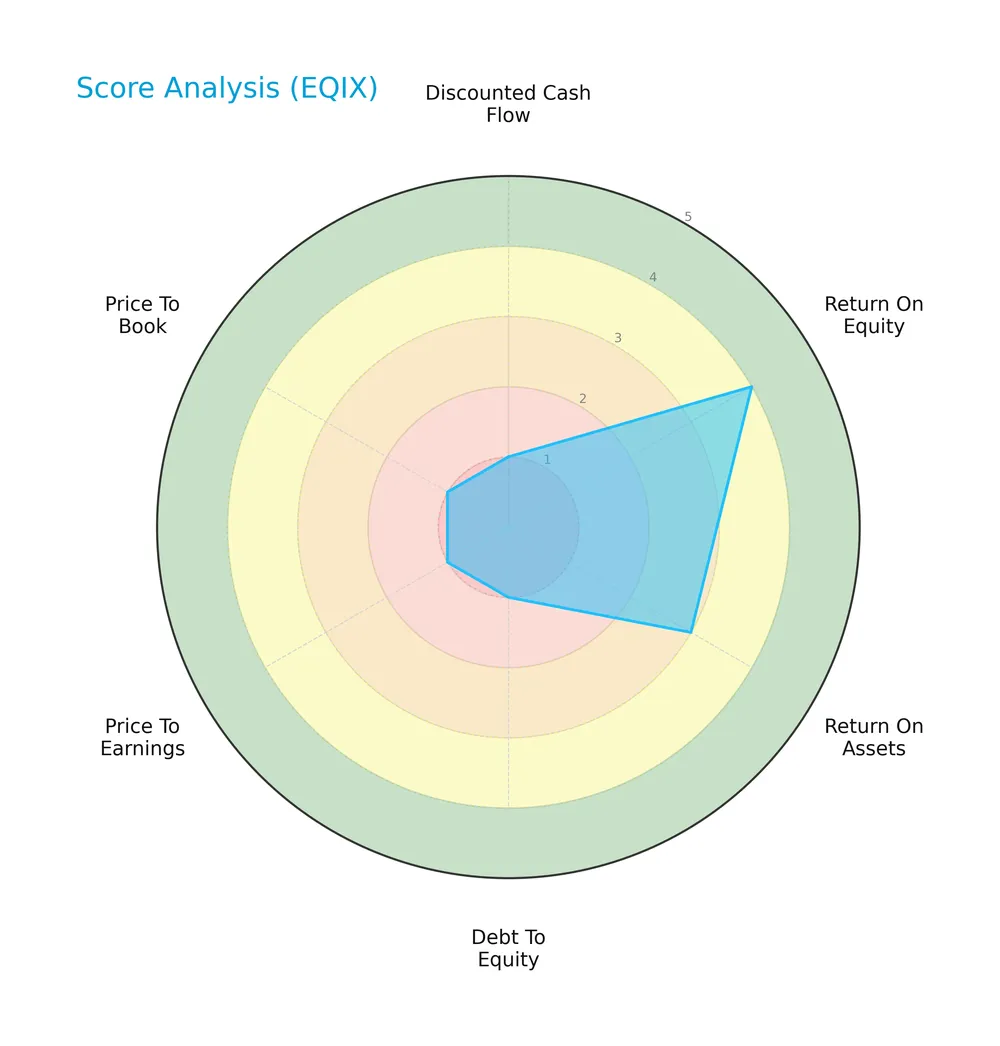
Equinix shows a favorable return on equity and moderate return on assets. However, debt-to-equity, price-to-earnings, price-to-book, and discounted cash flow scores are very unfavorable, reflecting valuation and leverage concerns.
Analysis of the company’s bankruptcy risk
The Altman Z-Score places Equinix in the grey zone, indicating moderate bankruptcy risk with some financial uncertainty:

Is the company in good financial health?
This Piotroski diagram highlights Equinix’s average financial health based on profitability and efficiency criteria:
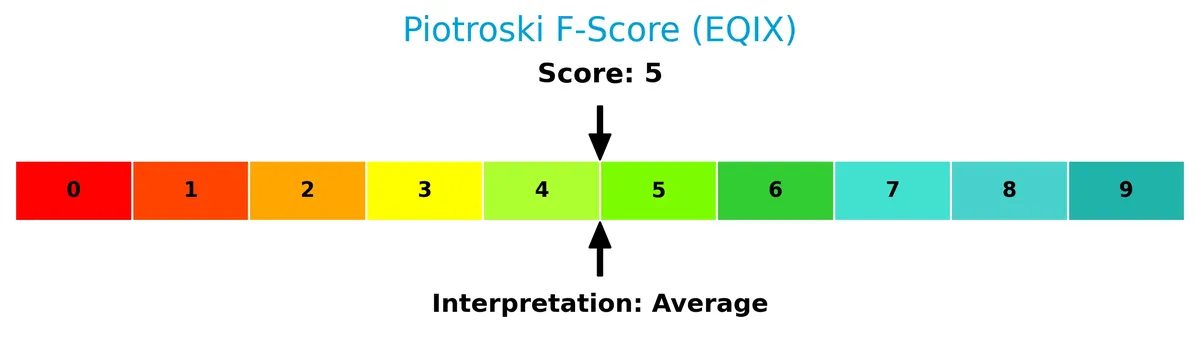
With a Piotroski Score of 5, Equinix demonstrates neither strong nor weak financial health, suggesting a balanced but cautious outlook for investors.
Competitive Landscape & Sector Positioning
This analysis examines Equinix, Inc.’s strategic position within the Real Estate sector, focusing on key operational metrics. I will assess the company’s revenue segments, product offerings, and main competitors. The goal is to determine whether Equinix holds a competitive advantage over its peers.
Strategic Positioning
Equinix focuses on a concentrated product portfolio centered on co-location, interconnection, and managed infrastructure, generating over $8B recurring revenue in 2024. Geographically, it maintains diverse exposure across Americas ($3.9B), EMEA ($3B), and Asia Pacific ($1.9B), reflecting a balanced global digital infrastructure presence.
Revenue by Segment
This pie chart presents Equinix’s revenue breakdown by segment for fiscal year 2024, highlighting recurring and non-recurring revenue streams.
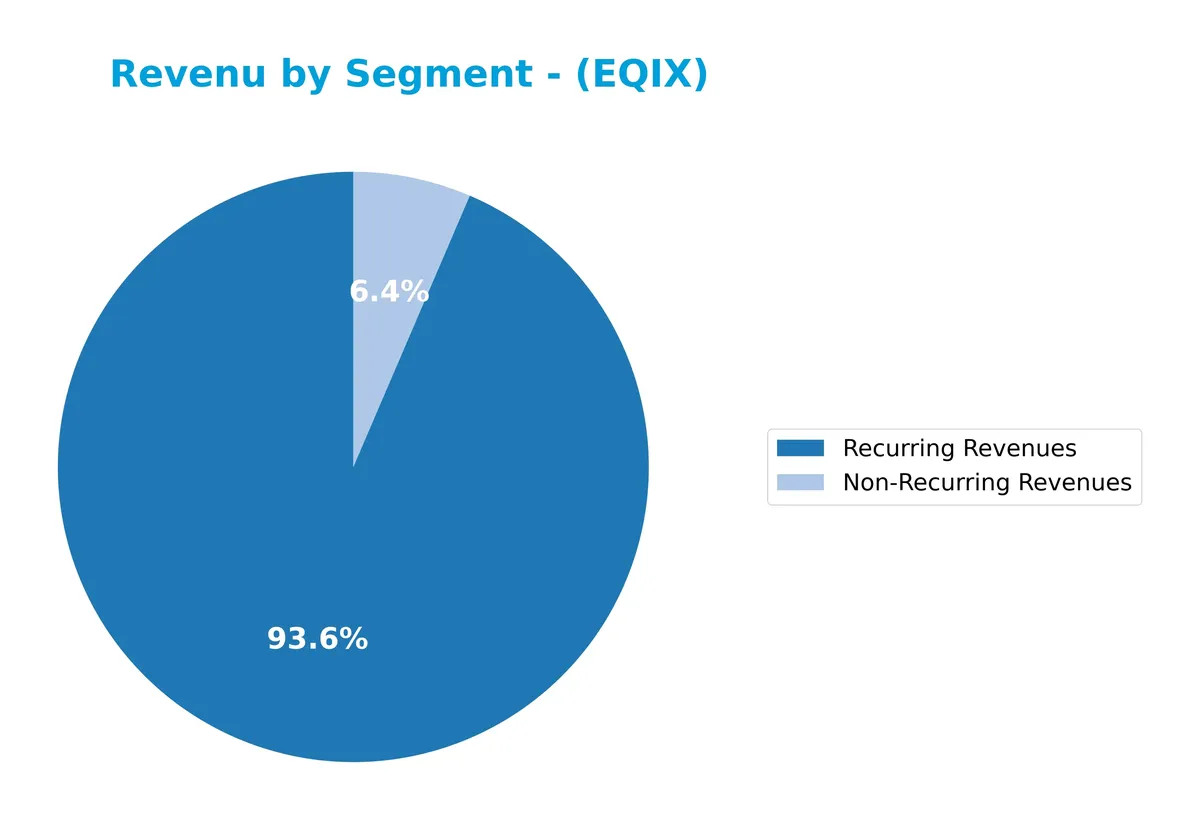
In 2024, recurring revenues dominate at $8.18B, underscoring the company’s stable cash flow from core services. Non-recurring revenues total $564M, reflecting one-time or project-based income. Historically, co-location and interconnection drove growth, but recent data bundles recurring revenues, signaling possible segment consolidation or reporting changes. The strong recurring base reduces concentration risk and supports predictable earnings, crucial in the capital-intensive data center sector.
Key Products & Brands
The table below outlines Equinix’s main products and brands with brief descriptions:
| Product | Description |
|---|---|
| Co-Location | Leasing data center space and infrastructure to customers for hosting their IT equipment. |
| Interconnection | Services enabling secure and direct data exchange between businesses within Equinix facilities. |
| Managed Infrastructure | Outsourced management of IT infrastructure including hardware and network services. |
| Non-Recurring Revenues | One-time or irregular revenue streams not part of ongoing contracts. |
| Other | Miscellaneous services and revenues not classified under main operating segments. |
| Rental | Income from leasing assets, recorded in earlier years but phased out in recent reports. |
Equinix’s revenue largely depends on Co-Location and Interconnection services, reflecting its core role as a global digital infrastructure provider. Managed Infrastructure complements recurring revenues, while Non-Recurring and Other revenues add modest diversification. Rental income has diminished over time.
Main Competitors
There are 6 main competitors in the Real Estate REIT – Specialty sector; the table below shows the top 6 leaders by market capitalization:
| Competitor | Market Cap. |
|---|---|
| American Tower Corporation | 81.8B |
| Equinix, Inc. | 74.5B |
| Crown Castle Inc. | 38.6B |
| Iron Mountain Incorporated | 24.6B |
| SBA Communications Corporation | 20.7B |
| Weyerhaeuser Company | 17.2B |
Equinix ranks 2nd among its 6 competitors. Its market cap stands at 104.1% of the leader, American Tower Corporation. Equinix is positioned above both the average market cap of the top 10 (43B) and the sector median (31.6B). It maintains a 3.93% market cap gap to the leader, underscoring its strong scale in the sector.
Comparisons with competitors
Check out how we compare the company to its competitors:
Does EQIX have a competitive advantage?
Equinix shows a competitive advantage through strong revenue growth and expanding geographic reach, despite a slightly unfavorable moat status. Its net margin and EPS growth are notably favorable, reflecting improving profitability.
Looking ahead, Equinix continues to capitalize on opportunities in the Americas, Asia Pacific, and EMEA markets. The company’s strategy to enable digital infrastructure leaders positions it well for scaling new services and accelerating digital transformation globally.
SWOT Analysis
This SWOT analysis highlights key internal and external factors shaping Equinix, Inc.’s strategic positioning.
Strengths
- Strong gross margin at 51%
- Robust net margin growth of 94% over 5 years
- Global digital infrastructure leader
Weaknesses
- High debt-to-equity ratio of 1.47
- Unfavorable EBIT margin at 0%
- Price multiples (PE 55.5, PB 5.3) suggest premium valuation
Opportunities
- Expanding demand for cloud and data center services
- Growth in Asia-Pacific and EMEA markets
- Increasing digital transformation worldwide
Threats
- Rising interest rates impacting financing costs
- Intense competition in REIT and data center sectors
- Economic slowdown affecting IT capital expenditure
Equinix benefits from strong profitability and a premium market position but struggles with leverage and valuation pressures. Strategic focus should prioritize debt management while capitalizing on global digital infrastructure growth.
Stock Price Action Analysis
The weekly stock chart below illustrates Equinix, Inc.’s price movements, highlighting key trends and fluctuations over the past year:
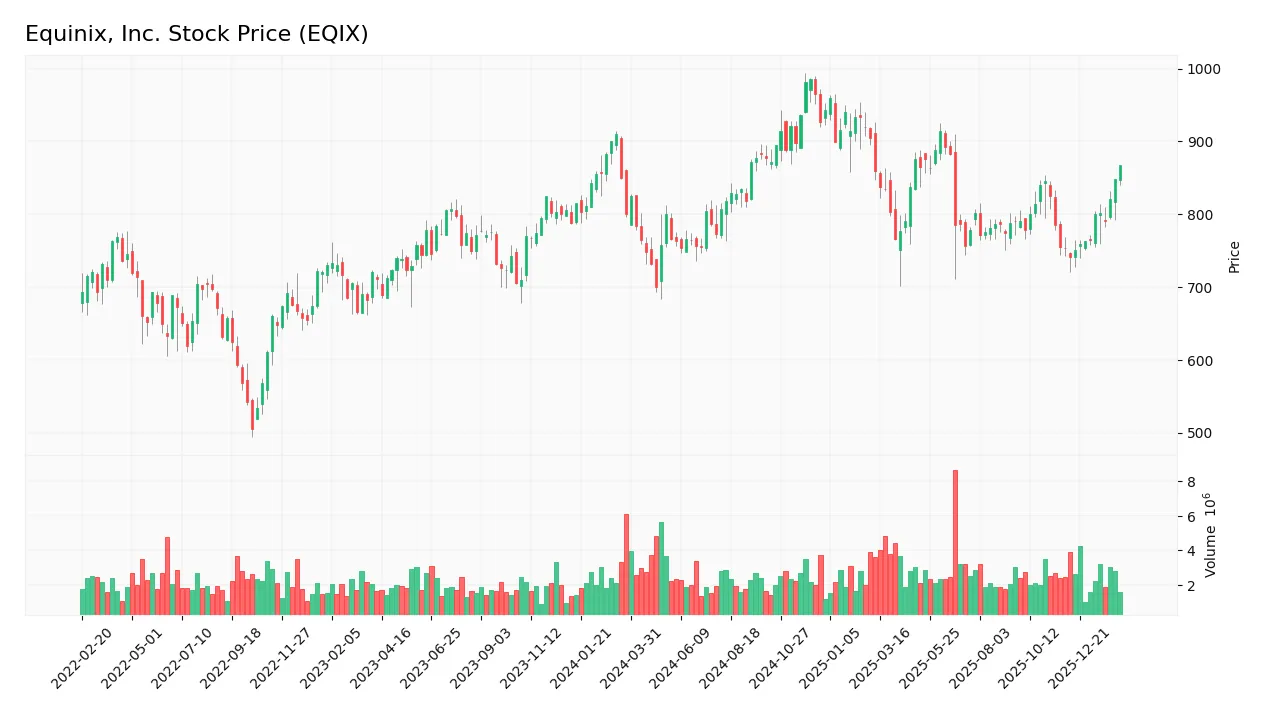
Trend Analysis
Over the past 12 months, EQIX’s stock price rose by 8.31%, indicating a bullish trend. The trend accelerated with a notable high of 985.0 and a low of 700.18. Volatility is significant, with a standard deviation of 65.22, reflecting dynamic price swings.
Volume Analysis
Trading volume totals 311M shares, with buyer volume slightly exceeding seller volume at 50.85%. Volume is increasing, signaling growing investor interest. Recent months show strong buyer dominance at 73%, indicating robust demand and positive market participation.
Target Prices
Analysts present a solid target consensus for Equinix, Inc., reflecting cautious optimism.
| Target Low | Target High | Consensus |
|---|---|---|
| 795 | 1050 | 922.38 |
The target range spans from 795 to 1050, with a consensus near 922, indicating moderate upside potential balanced by sector volatility.

Don’t Let Luck Decide Your Entry Point
Optimize your entry points with our advanced ProRealTime indicators. You’ll get efficient buy signals with precise price targets for maximum performance. Start outperforming now!
Analyst & Consumer Opinions
This section examines grades and consumer feedback to provide insights into Equinix, Inc.’s market perception and reputation.
Stock Grades
Below is the latest summary of Equinix, Inc. grades from respected financial institutions, reflecting current analyst sentiment:
| Grading Company | Action | New Grade | Date |
|---|---|---|---|
| Scotiabank | Maintain | Sector Outperform | 2026-01-14 |
| BMO Capital | Upgrade | Outperform | 2025-12-03 |
| Truist Securities | Maintain | Buy | 2025-11-18 |
| JP Morgan | Maintain | Overweight | 2025-10-30 |
| TD Cowen | Maintain | Buy | 2025-10-30 |
| Barclays | Maintain | Equal Weight | 2025-08-20 |
| Truist Securities | Maintain | Buy | 2025-08-07 |
| JP Morgan | Maintain | Overweight | 2025-07-31 |
| JMP Securities | Maintain | Market Outperform | 2025-07-22 |
| UBS | Maintain | Buy | 2025-07-11 |
The consensus leans decisively toward a “Buy” rating, with most firms maintaining positive outlooks and only one holding a neutral stance. Upgrades are infrequent but highlight growing confidence in the company’s prospects.
Consumer Opinions
Consumers express strong appreciation for Equinix’s reliable data center infrastructure and excellent customer support. However, some users point to pricing concerns and occasional service delays.
| Positive Reviews | Negative Reviews |
|---|---|
| “Equinix offers unmatched uptime and network quality.” | “Pricing feels steep compared to competitors.” |
| “Their customer service is responsive and knowledgeable.” | “Setup process took longer than expected.” |
| “The global footprint supports our expansion seamlessly.” | “Occasional maintenance causes brief disruptions.” |
Overall, customers praise Equinix’s robust service and global reach. Pricing and service speed appear as the main pain points, suggesting room for operational improvements.
Risk Analysis
Below is a summary of key risks facing Equinix, Inc., highlighting probability and potential impact:
| Category | Description | Probability | Impact |
|---|---|---|---|
| Leverage Risk | High debt-to-equity (1.47) and debt-to-assets (51.67%) increase financial risk. | High | High |
| Profitability Risk | ROE (9.54%) and asset turnover (0.23) are weak, limiting returns on equity. | Moderate | Moderate |
| Valuation Risk | Elevated P/E (55.55) and P/B (5.3) ratios suggest overvaluation concerns. | Moderate | Moderate |
| Liquidity Risk | Current ratio (1.32) is neutral; interest coverage near zero signals strain. | Moderate | High |
| Bankruptcy Risk | Altman Z-Score (2.61) in grey zone implies moderate financial distress risk. | Moderate | High |
Leverage stands out as the most critical risk for Equinix. The company’s debt load exceeds half its assets, pressuring interest coverage which is nearly zero. This raises concerns amid rising interest rates. Valuation remains stretched compared to industry norms, limiting margin of safety. The Altman Z-Score in the grey zone signals moderate bankruptcy risk. Investors should weigh these risks carefully against the firm’s favorable net margin and dividend yield.
Should You Buy Equinix, Inc.?
Equinix, Inc. appears to be improving profitability with growing ROIC, yet it is shedding value relative to WACC, suggesting a slightly unfavorable moat. Despite significant leverage and mixed financial strength, its overall rating stands at a cautious C.
Strength & Efficiency Pillars
Equinix, Inc. exhibits operational strength with a solid net margin of 14.65% and favorable gross margin at 51.09%. Despite a moderate ROIC of 5.05% slightly below its WACC of 5.24%, the company shows improving profitability trends. Its interest expense ratio at -5.72% underlines efficient cost management. While return on equity is modest at 9.54%, overall income growth remains robust, with net income surging nearly 170% over five years, reflecting solid operational momentum.
Weaknesses and Drawbacks
The company sits in the Altman Z-Score grey zone at 2.61, indicating moderate bankruptcy risk that warrants caution. Equinix faces valuation pressures with a high P/E of 55.55 and a P/B ratio of 5.3, suggesting overvaluation relative to peers. Leverage metrics are unfavorable, with a debt-to-equity ratio of 1.47 and debt-to-assets at 51.67%, raising solvency concerns. Asset turnover is weak at 0.23, pointing to inefficiencies in asset utilization that could limit growth potential.
Our Final Verdict about Equinix, Inc.
Equinix may appear attractive due to its bullish price trend and strong recent buyer dominance, reflecting market confidence. However, its moderate Altman Z-Score in the grey zone and stretched valuation metrics suggest investors should approach carefully. Despite operational improvements and accelerating stock momentum, the company’s financial leverage and valuation risk indicate a wait-and-see stance might better suit cautious capital.
Disclaimer: This content is for informational purposes only and does not constitute financial, investment, or other professional advice. Investing in financial markets involves a significant risk of loss, and past performance is not indicative of future results.
Additional Resources
- Equinix stock surges amid exceptionally strong guidance after Q4 miss (EQIX:NASDAQ) – Seeking Alpha (Feb 11, 2026)
- ProShare Advisors LLC Acquires 1,470 Shares of Equinix, Inc. $EQIX – MarketBeat (Feb 11, 2026)
- Equinix: Q4 Earnings Snapshot – kens5.com (Feb 11, 2026)
- (EQIX) Equinix, Inc. Expects Q1 Revenue Range $2.50B – $2.54B – marketscreener.com (Feb 11, 2026)
- Equinix (EQIX): Positioned for Growth in the Evolving Data Center Market – Yahoo Finance (Feb 10, 2026)
For more information about Equinix, Inc., please visit the official website: equinix.com