Home > Analyses > Industrials > Equifax Inc.
Equifax Inc. transforms how businesses and governments access and verify critical data, shaping credit and identity landscapes worldwide. As a dominant force in consumer and commercial information services, Equifax excels in credit scoring, fraud prevention, and workforce solutions. Its innovative technology powers smarter decisions across diverse industries, from finance to healthcare. Yet, in a fiercely competitive market, I ask: do Equifax’s fundamentals still justify its premium valuation and growth ambitions?
Table of contents
Business Model & Company Overview
Equifax Inc., founded in 1899 and headquartered in Atlanta, GA, leads the consulting services industry with a comprehensive ecosystem of information solutions and business process automation. Its core mission integrates credit, identity, and employment data to serve a diverse client base spanning financial services, government, and retail sectors. This deep data network forms the backbone of Equifax’s competitive advantage in credit and risk management.
Equifax drives revenue through a balanced mix of Workforce Solutions, U.S. Information Solutions, and International segments, blending recurring services and technology-enabled products. Its global footprint spans the Americas, Europe, and Asia, supporting clients with credit scoring, fraud prevention, identity verification, and mortgage services. This broad, data-rich platform underpins a robust economic moat, positioning Equifax as a pivotal player shaping the future of information-driven decision-making.
Financial Performance & Fundamental Metrics
I analyze Equifax Inc.’s income statement, key financial ratios, and dividend payout policy to assess its operational efficiency and shareholder returns.
Income Statement
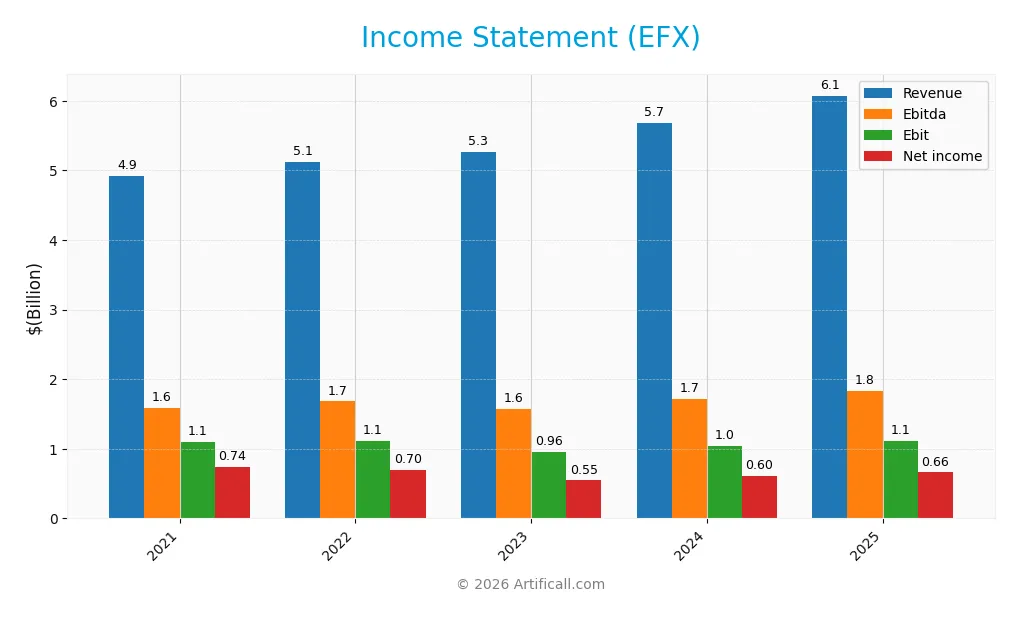
The table below presents Equifax Inc.’s key income statement figures for fiscal years 2021 through 2025, reflecting revenue growth and profitability trends.
| 2021 | 2022 | 2023 | 2024 | 2025 | |
|---|---|---|---|---|---|
| Revenue | 4.92B | 5.12B | 5.27B | 5.68B | 6.07B |
| Cost of Revenue | 1.98B | 2.18B | 2.34B | 2.52B | 3.37B |
| Operating Expenses | 1.81B | 1.89B | 2.00B | 2.12B | 1.61B |
| Gross Profit | 2.94B | 2.95B | 2.93B | 3.16B | 2.71B |
| EBITDA | 1.58B | 1.68B | 1.58B | 1.72B | 1.83B |
| EBIT | 1.09B | 1.11B | 0.96B | 1.04B | 1.11B |
| Interest Expense | 146.0M | 183.0M | 241.4M | 229.1M | 212.3M |
| Net Income | 744.2M | 696.2M | 545.3M | 604.1M | 660.3M |
| EPS | 6.11 | 5.69 | 4.44 | 4.88 | 5.36 |
| Filing Date | 2022-02-24 | 2023-02-23 | 2024-02-22 | 2025-02-20 | 2026-02-19 |
Income Statement Evolution
Equifax’s revenue rose 23.4% from 2021 to 2025, with a moderate 6.9% increase in 2025 alone. However, net income declined 11.3% over the period, reflecting margin pressure. Gross margin slipped from previous highs, while EBIT and net margins showed modest improvement, indicating some operational efficiency gains despite top-line growth slowing slightly.
Is the Income Statement Favorable?
In 2025, Equifax posted $6.07B revenue and $660M net income, yielding a 10.9% net margin, which is favorable compared to sector averages. EBIT margin of 18.2% and interest expense at 3.5% of revenue remain well controlled. Yet, a 14.3% decline in gross profit growth last year signals cost pressures. Overall, fundamentals appear generally favorable but warrant monitoring of margin sustainability.
Financial Ratios
The table below presents key financial ratios for Equifax Inc. from 2021 to 2025, illustrating profitability, liquidity, leverage, and valuation metrics:
| Ratios | 2021 | 2022 | 2023 | 2024 | 2025 |
|---|---|---|---|---|---|
| Net Margin | 15% | 14% | 10% | 11% | 11% |
| ROE | 21% | 18% | 12% | 13% | 14% |
| ROIC | 9% | 8% | 6% | 7% | 8% |
| P/E | 48.0 | 34.2 | 55.7 | 52.2 | 40.5 |
| P/B | 10.0 | 6.0 | 6.7 | 6.6 | 5.8 |
| Current Ratio | 0.49 | 0.68 | 0.67 | 0.75 | 0.60 |
| Quick Ratio | 0.49 | 0.68 | 0.67 | 0.75 | 0.60 |
| D/E | 1.48 | 1.46 | 1.26 | 1.04 | 1.11 |
| Debt-to-Assets | 48% | 50% | 47% | 43% | 43% |
| Interest Coverage | 7.8 | 5.8 | 3.9 | 4.5 | 5.2 |
| Asset Turnover | 0.45 | 0.44 | 0.43 | 0.48 | 0.51 |
| Fixed Asset Turnover | 3.74 | 3.23 | 2.87 | 3.00 | 3.14 |
| Dividend Yield | 0.53% | 0.80% | 0.63% | 0.61% | 0.87% |
Evolution of Financial Ratios
Return on Equity (ROE) showed a gradual decline from 20.76% in 2021 to 14.34% in 2025, indicating reduced profitability. The Current Ratio remained below 1.0 across the period, signaling persistent liquidity constraints. Debt-to-Equity Ratio decreased modestly from 1.48 to 1.11, reflecting a slight reduction in leverage but still at a relatively high level.
Are the Financial Ratios Favorable?
In 2025, profitability metrics like net margin (10.87%) and interest coverage (5.22x) are favorable, supporting operational strength. However, liquidity ratios (current and quick at 0.6) and leverage (debt-to-equity at 1.11) are unfavorable, suggesting financial risk. Market valuation ratios (PE at 40.48, PB at 5.81) also appear stretched. Overall, the ratio profile is slightly unfavorable.
Shareholder Return Policy
Equifax Inc. maintains a consistent dividend policy with a payout ratio near 35%, delivering approximately $1.89 per share in 2025 and an annual yield under 1%. The dividend is well covered by free cash flow, supported by a dividend and capex coverage ratio above 2.2.
The company also engages in share buybacks, complementing dividends in returning capital. This balanced approach aligns with sustainable long-term value creation, reflecting prudent capital allocation amid stable profitability and moderate leverage.
Score analysis
The radar chart below displays Equifax Inc.’s key financial scores for a quick performance overview:
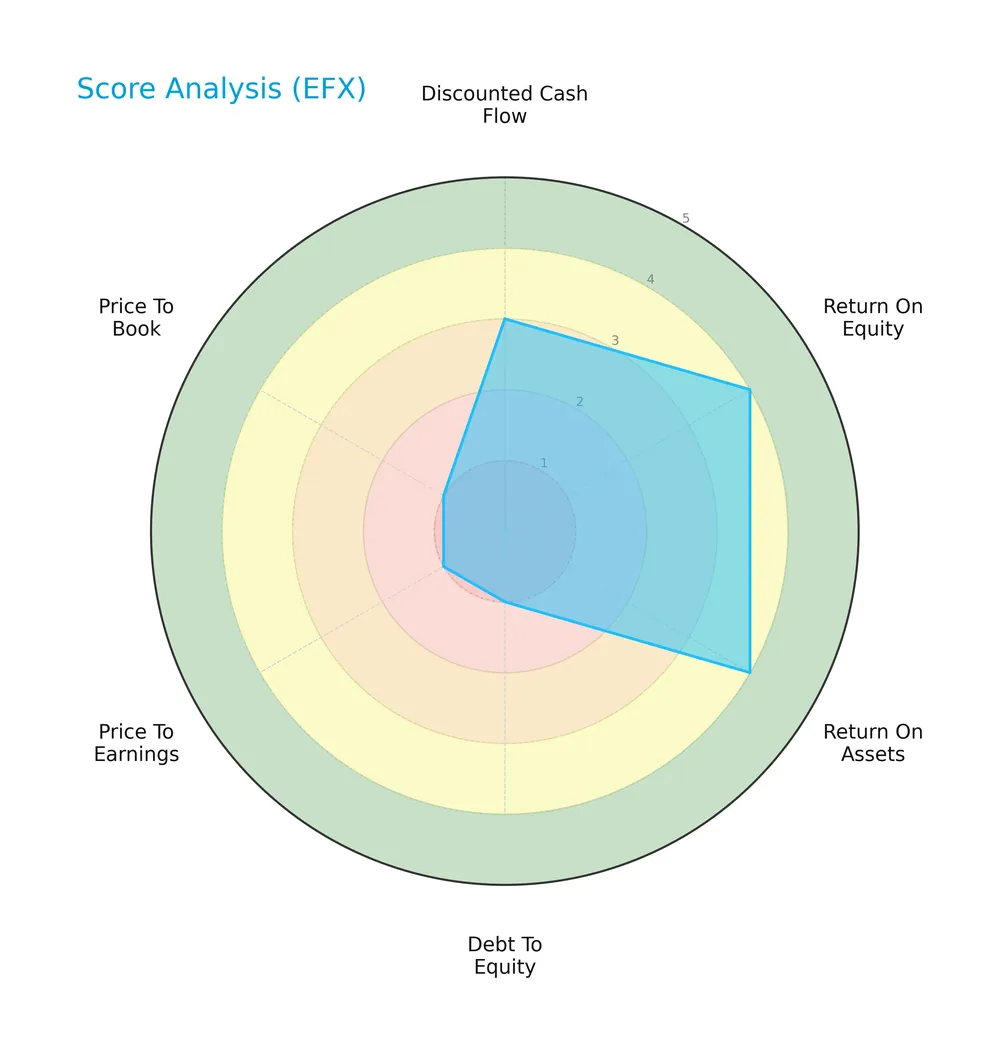
Equifax scores moderately on discounted cash flow and strongly on returns on equity and assets. However, debt-to-equity, price-to-earnings, and price-to-book ratios are very unfavorable, signaling valuation and leverage concerns.
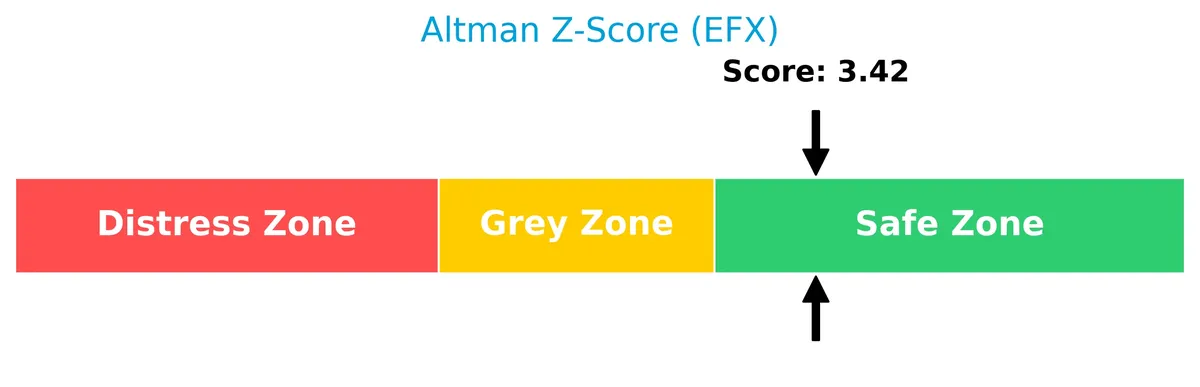
Analysis of the company’s bankruptcy risk
Equifax’s Altman Z-Score of 3.52 places it firmly in the safe zone, indicating low bankruptcy risk and financial stability:
Is the company in good financial health?
The Piotroski diagram reflects Equifax’s financial strength based on nine key criteria:
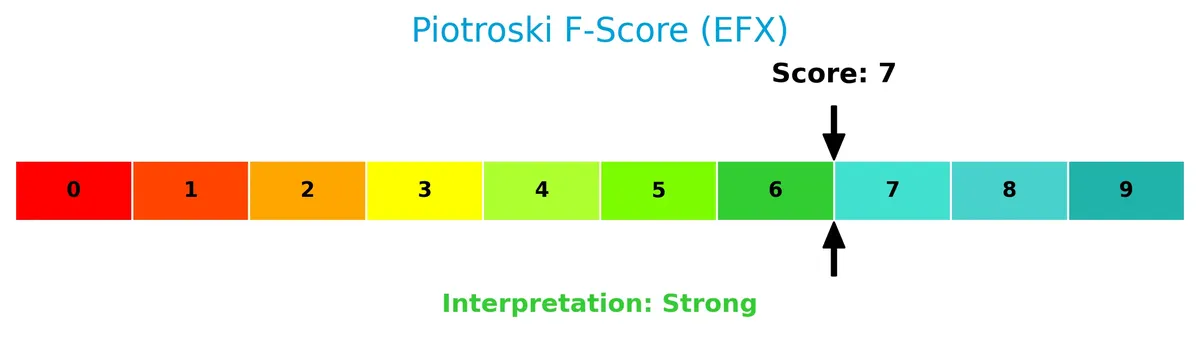
With a Piotroski Score of 7, Equifax demonstrates strong financial health, suggesting effective profitability, liquidity, and operational efficiency.
Competitive Landscape & Sector Positioning
This sector analysis explores Equifax Inc.’s strategic positioning, revenue segments, key products, and main competitors. I will assess whether Equifax holds a sustainable competitive advantage over its industry peers.
Strategic Positioning
Equifax maintains a diversified product portfolio across Workforce Solutions, U.S. Consumer Information, and International segments. Geographically, it balances significant U.S. exposure with expanding international revenues, notably in Australia and the UK, supporting global revenue growth and risk distribution.
Revenue by Segment
This pie chart breaks down Equifax Inc.’s revenue by segment for fiscal year 2025, highlighting contributions across its main business lines.
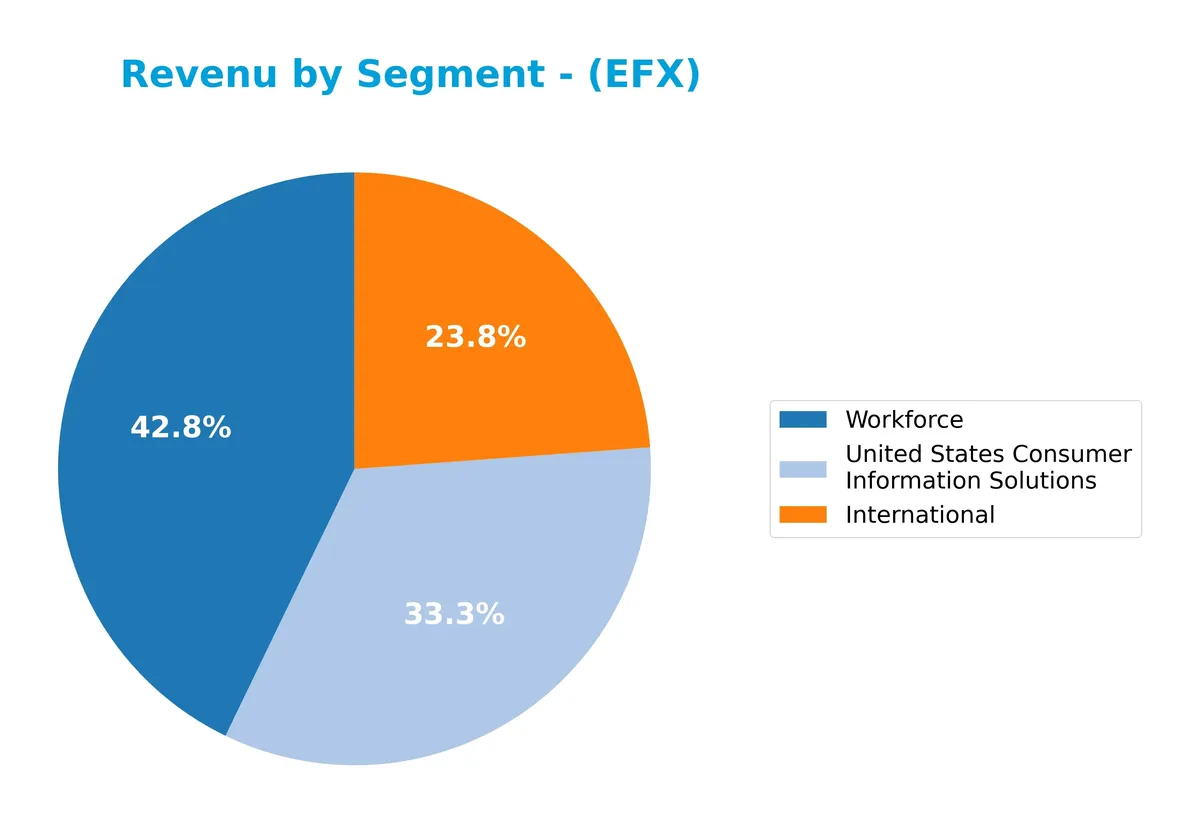
In 2025, United States Consumer Information Solutions leads with $4.16B, showing strong dominance and significant growth from prior years. Workforce follows at $2.58B, reflecting steady expansion and a solid second pillar. The International segment, generating $1.41B, continues its gradual rise but remains smaller by comparison. The business shows increasing concentration risk in the U.S. consumer segment, which now drives over half the total revenue.
Key Products & Brands
The table below outlines Equifax Inc.’s main product segments and their descriptions:
| Product | Description |
|---|---|
| Workforce Solutions | Employment, income, criminal history, and social security number verification; payroll and tax management; identity theft protection products. |
| U.S. Consumer Information Solutions | Consumer and commercial credit information services, credit scoring and modeling, fraud detection, mortgage and financial marketing services, identity management, and credit monitoring. |
| International | Consumer and commercial credit and financial information, credit scoring and marketing products, debt collection support, and recovery management services. |
Equifax operates through three core segments: Workforce Solutions, U.S. Consumer Information Solutions, and International. Each segment delivers specialized data and analytics services tailored to diverse industries and geographies.
Main Competitors
There are 3 competitors in the Industrials consulting services sector; the table lists the top 3 leaders by market capitalization:
| Competitor | Market Cap. |
|---|---|
| Verisk Analytics, Inc. | 30.8B |
| Equifax Inc. | 26.5B |
| Booz Allen Hamilton Holding Corporation | 10.5B |
Equifax ranks 2nd among its competitors with a market cap at 78.5% of the leader, Verisk Analytics. It sits above the average market cap of the top 10 but below the sector median. The company leads Booz Allen Hamilton by a substantial 129.2%, showing a significant gap with its closest rival below.
Comparisons with competitors
Check out how we compare the company to its competitors:
Does EFX have a competitive advantage?
Equifax Inc. currently lacks a competitive advantage, as its return on invested capital (ROIC) falls below its weighted average cost of capital (WACC), indicating value destruction. The company’s profitability and ROIC have declined significantly from 2021 to 2025, signaling weakening economic moat.
Looking ahead, Equifax’s broad geographic footprint and diverse information services present growth opportunities in international markets and product innovation. However, sustaining competitive strength will require reversing the downward ROIC trend and enhancing capital efficiency amid evolving industry demands.
SWOT Analysis
This analysis highlights Equifax Inc.’s core strengths, weaknesses, opportunities, and threats to guide strategic focus.
Strengths
- strong market position in credit reporting
- diversified global revenue streams
- favorable profit margins
Weaknesses
- declining ROIC signals value destruction
- high debt-to-equity ratio weakens balance sheet
- low liquidity ratios increase short-term risk
Opportunities
- growth in international markets
- expansion of identity management services
- increased demand for data analytics
Threats
- regulatory scrutiny in data privacy
- intense competition in credit services
- economic downturn impacting client creditworthiness
Equifax’s strengths in market presence and profitability contrast with financial structure weaknesses. Strategic emphasis on international growth and innovation is critical to offset regulatory and competitive threats.
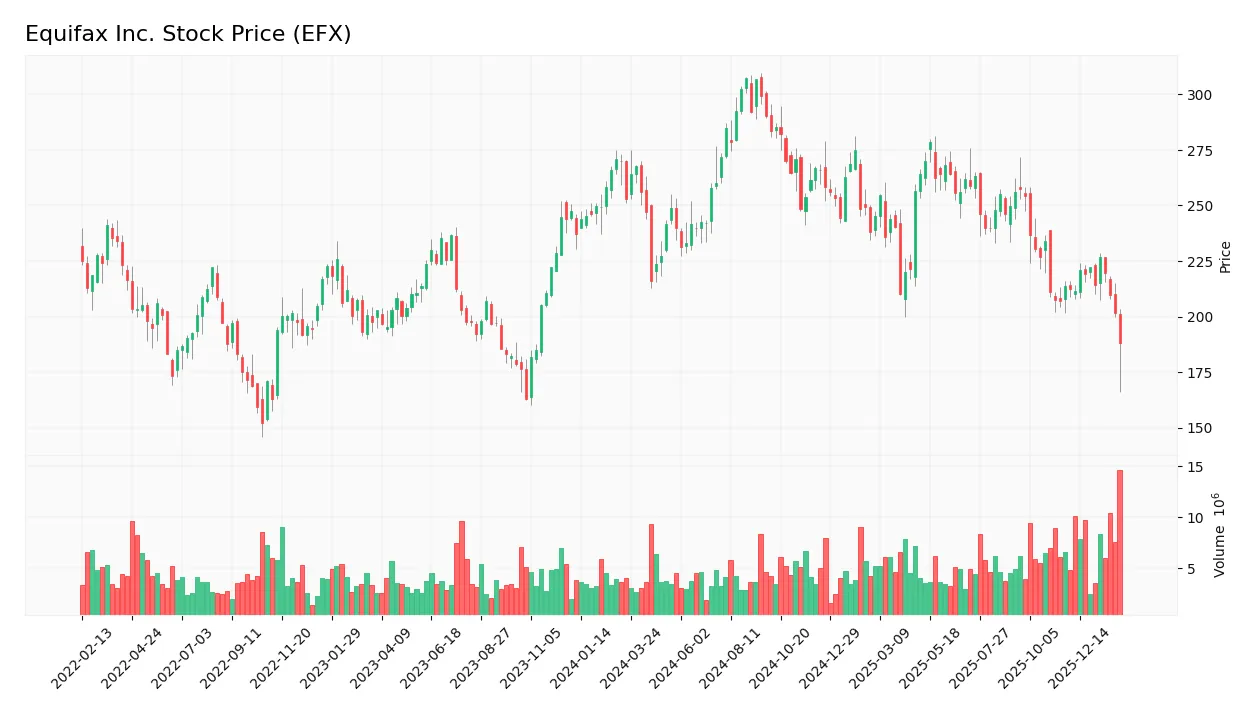
Stock Price Action Analysis
The weekly stock chart of Equifax Inc. (EFX) highlights notable price fluctuations and trend shifts over the recent period:
Trend Analysis
Over the past 12 months, EFX’s stock price declined by 26.19%, indicating a clear bearish trend with deceleration. The price ranged from a high of 307.13 to a low of 192.8, showing significant volatility with a standard deviation of 25.59. Recent months show a continued negative trend of -6.64%, confirming persistent downside momentum.
Volume Analysis
Trading volume increased recently, with total volume at 612M shares. Seller volume (323M) exceeded buyer volume (285M) overall, and the recent period saw seller dominance at 76.39%. This rising volume under seller control suggests cautious or bearish investor sentiment with higher market participation on the sell side.
Target Prices
Analysts project a target price consensus that reflects moderate upside potential for Equifax Inc.
| Target Low | Target High | Consensus |
|---|---|---|
| 195 | 285 | 238.18 |
The target range suggests cautious optimism, with a consensus price indicating a roughly 10-15% gain from current levels.

Don’t Let Luck Decide Your Entry Point
Optimize your entry points with our advanced ProRealTime indicators. You’ll get efficient buy signals with precise price targets for maximum performance. Start outperforming now!
Analyst & Consumer Opinions
This section examines Equifax Inc.’s recent analyst ratings alongside consumer feedback to gauge market and user sentiment.
Stock Grades
Here are the latest verified stock grades for Equifax Inc. from established financial institutions:
| Grading Company | Action | New Grade | Date |
|---|---|---|---|
| Goldman Sachs | Maintain | Neutral | 2026-02-09 |
| Morgan Stanley | Maintain | Overweight | 2026-02-05 |
| Needham | Maintain | Buy | 2026-02-05 |
| RBC Capital | Maintain | Outperform | 2026-02-05 |
| Wells Fargo | Maintain | Overweight | 2026-02-05 |
| Stifel | Maintain | Buy | 2026-02-05 |
| Barclays | Maintain | Equal Weight | 2026-02-05 |
| JP Morgan | Maintain | Overweight | 2026-02-05 |
| Wells Fargo | Maintain | Overweight | 2026-01-14 |
| Oppenheimer | Maintain | Outperform | 2026-01-12 |
The overall trend shows strong confidence with multiple “Buy,” “Overweight,” and “Outperform” ratings. Neutral and equal weight grades indicate some caution but no significant downgrade pressure.
Consumer Opinions
Consumer sentiment around Equifax Inc. (EFX) reveals a mix of trust in its services and concern over data security.
| Positive Reviews | Negative Reviews |
|---|---|
| Reliable credit reporting accuracy | Concerns over past data breaches |
| Helpful customer support | Lengthy dispute resolution process |
| Clear and detailed credit reports | High fees for premium services |
Overall, consumers appreciate Equifax’s accurate reporting and customer support. However, recurring concerns about data security and service costs temper enthusiasm.
Risk Analysis
Below is a summary of key risks facing Equifax Inc., including their likelihood and potential impact:
| Category | Description | Probability | Impact |
|---|---|---|---|
| Liquidity Risk | Current and quick ratios at 0.6 suggest difficulty covering short-term obligations. | High | High |
| Valuation Risk | Elevated P/E of 40.5 and P/B of 5.8 imply the stock is expensive versus peers. | High | Medium |
| Leverage Risk | Debt-to-equity ratio of 1.11 signals heavy reliance on debt financing. | Medium | Medium |
| Market Volatility | Beta of 1.56 indicates higher sensitivity to market swings. | Medium | Medium |
| Regulatory Risk | Operating in multiple jurisdictions exposes company to complex compliance issues. | Medium | High |
| Competitive Risk | Intense competition in information solutions could pressure margins. | Medium | Medium |
Liquidity risk stands out as the most urgent concern due to subpar current and quick ratios, which historically precede financial strain in this sector. Despite a strong Altman Z-Score of 3.52 indicating overall safety, the stretched liquidity and high valuation metrics warrant caution. Investors should weigh these risks against the company’s stable profitability and market position.
Should You Buy Equifax Inc.?
Equifax appears to be a company with improving profitability and operational efficiency, but its competitive moat seems very unfavorable due to declining ROIC versus WACC. Despite a manageable leverage profile, valuation metrics suggest risk, resulting in an overall B- rating.
Strength & Efficiency Pillars
Equifax Inc. delivers solid operational margins, with a gross margin of 44.6% and an EBIT margin of 18.23%, reflecting efficient core business activities. The net margin stands at a favorable 10.87%, while return on equity is a neutral 14.34%. However, the company’s return on invested capital (7.69%) trails its weighted average cost of capital (9.66%), indicating it is currently destroying value rather than creating it. Despite this, the Altman Z-Score of 3.52 places Equifax securely in the safe zone, supporting its financial stability.
Weaknesses and Drawbacks
Equifax faces significant valuation and leverage challenges that raise red flags. Its price-to-earnings ratio of 40.48 and price-to-book ratio of 5.81 suggest an expensive valuation relative to earnings and book value. The debt-to-equity ratio of 1.11 highlights a relatively high leverage position, while liquidity is concerning, with a current ratio of just 0.6 indicating potential short-term solvency risks. Recent market activity confirms seller dominance at 23.61%, reflecting downward pressure and investor caution.
Our Final Verdict about Equifax Inc.
Equifax presents a mixed profile. Its financial health is stable, supported by a safe Altman Z-Score and strong Piotroski score of 7. However, the company’s inability to generate returns above its cost of capital and its stretched valuation make it a challenging prospect. Despite long-term resilience, recent bearish price trends and seller dominance suggest a wait-and-see approach might be prudent to identify a better entry point.
Disclaimer: This content is for informational purposes only and does not constitute financial, investment, or other professional advice. Investing in financial markets involves a significant risk of loss, and past performance is not indicative of future results.
Additional Resources
- JPMorgan Chase & Co. Purchases 163,866 Shares of Equifax, Inc. $EFX – MarketBeat (Feb 21, 2026)
- Equifax Delivers Optimal Path™ Directly to U.S. Consumers via the myEquifax Mobile App – PR Newswire (Feb 17, 2026)
- Equifax, Inc. $EFX Shares Bought by JPMorgan Chase & Co. – MarketBeat (Feb 21, 2026)
- New Equifax app feature builds 30-day plan to raise your credit score – Stock Titan (Feb 17, 2026)
- Decoding Equifax Inc (EFX): A Strategic SWOT Insight – GuruFocus (Feb 20, 2026)
For more information about Equifax Inc., please visit the official website: equifax.com