Home > Analyses > Energy > EQT Corporation
EQT Corporation fuels millions of American homes and industries with its vast natural gas reserves. As a powerhouse in oil and gas exploration, EQT commands a leading position in the Marcellus shale, delivering high-quality natural gas and liquids. Its reputation for operational efficiency and innovation sets it apart in a fiercely competitive energy market. The key question now: does EQT’s solid asset base and strategic footprint justify its current valuation and growth prospects?

Table of contents
Business Model & Company Overview
EQT Corporation, founded in 1878 and headquartered in Pittsburgh, dominates the U.S. natural gas sector. It operates one of the largest ecosystems of proved reserves, with 25T cubic feet of natural gas and liquids across 2M gross acres, primarily in the Marcellus play. EQT’s core mission integrates natural gas production with a portfolio of NGLs like ethane and propane, creating a seamless energy supply chain that underpins its industry leadership.
The company’s revenue engine balances high-margin natural gas extraction with a diversified mix of natural gas liquids, driving stable cash flows. EQT leverages its strategic footprint in key U.S. basins to optimize production and market access. This integrated model builds a competitive advantage through scale, resource quality, and operational efficiency—fortifying its economic moat and shaping the future of U.S. energy supply.
Financial Performance & Fundamental Metrics
I analyze EQT Corporation’s income statement, key financial ratios, and dividend payout policy to assess its operational efficiency and shareholder value creation.
Income Statement
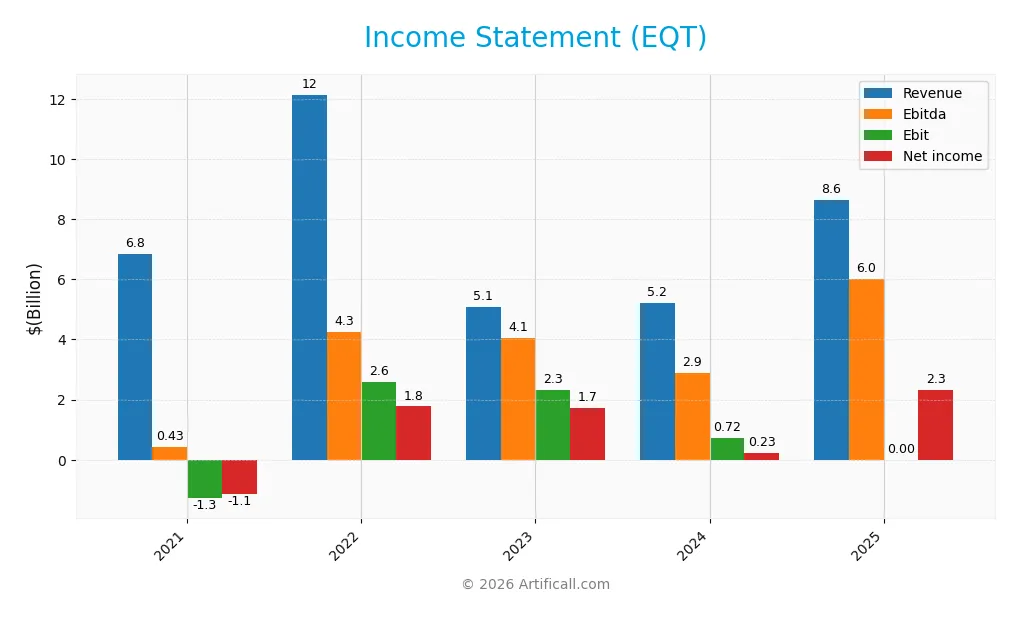
Below is EQT Corporation’s income statement for fiscal years 2021 through 2025, reflecting key profitability metrics and expense breakdowns.
| 2021 | 2022 | 2023 | 2024 | 2025 | |
|---|---|---|---|---|---|
| Revenue | 6.8B | 12.1B | 5.1B | 5.2B | 8.6B |
| Cost of Revenue | 3.8B | 4.1B | 4.1B | 4.5B | 225M |
| Operating Expenses | 4.4B | 5.3B | -1.4B | 82M | 5.2B |
| Gross Profit | 3.0B | 8.1B | 942M | 767M | 8.4B |
| EBITDA | 429M | 4.3B | 4.1B | 2.9B | 6.0B |
| EBIT | -1.3B | 2.6B | 2.3B | 719M | 0 |
| Interest Expense | 290M | 250M | 220M | 455M | 439M |
| Net Income | -1.1B | 1.8B | 1.7B | 231M | 2.3B |
| EPS | -3.57 | 4.79 | 4.56 | 0.45 | 3.8 |
| Filing Date | 2022-02-10 | 2023-02-16 | 2024-02-14 | 2025-02-19 | 2026-02-17 |
Income Statement Evolution
EQT Corporation’s revenue grew 26% from 2021 to 2025, with a sharp 65.5% increase in 2025 alone. Net income surged 304% over the period, driven by a 261% expansion in net margin. Gross margin remained strong at 97.4%, reflecting efficient cost control. However, EBIT margin declined to zero in 2025, signaling operational challenges despite revenue gains.
Is the Income Statement Favorable?
In 2025, EQT reported $8.64B revenue and $2.33B net income, yielding a favorable 26.9% net margin. While the EBIT margin was unfavorable at 0%, interest expense remained neutral at 5.08%. The company’s fundamentals appear generally favorable, supported by strong margin and earnings growth, though the zero EBIT margin suggests caution in operating efficiency.
Financial Ratios
The following table presents key financial ratios for EQT Corporation over the last five fiscal years, enabling a clear view of its profitability, liquidity, leverage, and market valuation metrics:
| Ratios | 2021 | 2022 | 2023 | 2024 | 2025 |
|---|---|---|---|---|---|
| Net Margin | -16.7% | 14.6% | 34.2% | 4.4% | 26.9% |
| ROE | -11.5% | 15.9% | 11.7% | 1.1% | 0% |
| ROIC | -5.3% | 10.7% | 8.1% | 1.7% | 0% |
| P/E | -6.2 | 7.1 | 8.5 | 101.9 | 14.1 |
| P/B | 0.71 | 1.12 | 1.00 | 1.14 | 0 |
| Current Ratio | 0.44 | 1.08 | 0.99 | 0.70 | 0 |
| Quick Ratio | 0.44 | 1.08 | 0.99 | 0.70 | 0 |
| D/E | 0.57 | 0.51 | 0.40 | 0.45 | 0 |
| Debt-to-Assets | 24.8% | 25.2% | 23.1% | 23.5% | 0% |
| Interest Coverage | -4.7 | 10.9 | 10.5 | 1.5 | 7.4 |
| Asset Turnover | 0.30 | 0.54 | 0.20 | 0.13 | 0 |
| Fixed Asset Turnover | 0.37 | 0.67 | 0.22 | 0.16 | 0 |
| Dividend Yield | 0.0% | 1.6% | 1.6% | 1.4% | 1.2% |
Evolution of Financial Ratios
EQT’s Return on Equity (ROE) remained at zero in 2025, indicating no improvement in shareholder returns. The Current Ratio dropped to zero, signaling deteriorated liquidity. Debt-to-Equity Ratio, however, showed a favorable stance by remaining low or stable. Profitability improved markedly, with net profit margin rising sharply to 26.9%.
Are the Financial Ratios Favorable?
In 2025, EQT’s profitability was strong, supported by a favorable net margin and price-to-earnings ratio of 14.1. Liquidity measures, including current and quick ratios, were unfavorable due to zero reported values. Leverage ratios were mostly favorable, reflecting controlled debt levels. Asset turnover and interest coverage ratios were unfavorable, suggesting operational inefficiencies and potential solvency risks. Dividend yield stood neutral at 1.19%. Overall, the financial ratios skew slightly unfavorable.
Shareholder Return Policy
EQT Corporation maintains a moderate dividend payout ratio around 16-17%, with dividends per share steadily rising from $0.55 in 2022 to $0.64 in 2025. The annual dividend yield hovers near 1.2%, supported by ample net income and free cash flow coverage, indicating a balanced approach to shareholder returns.
The company also engages in share buybacks, complementing dividends to return capital. This distribution strategy appears sustainable, aligning with EQT’s improving profitability margins and prudent capital allocation, thus supporting stable long-term shareholder value creation.
Score analysis
Here is a radar chart presenting EQT Corporation’s key financial metric scores for a comprehensive evaluation:
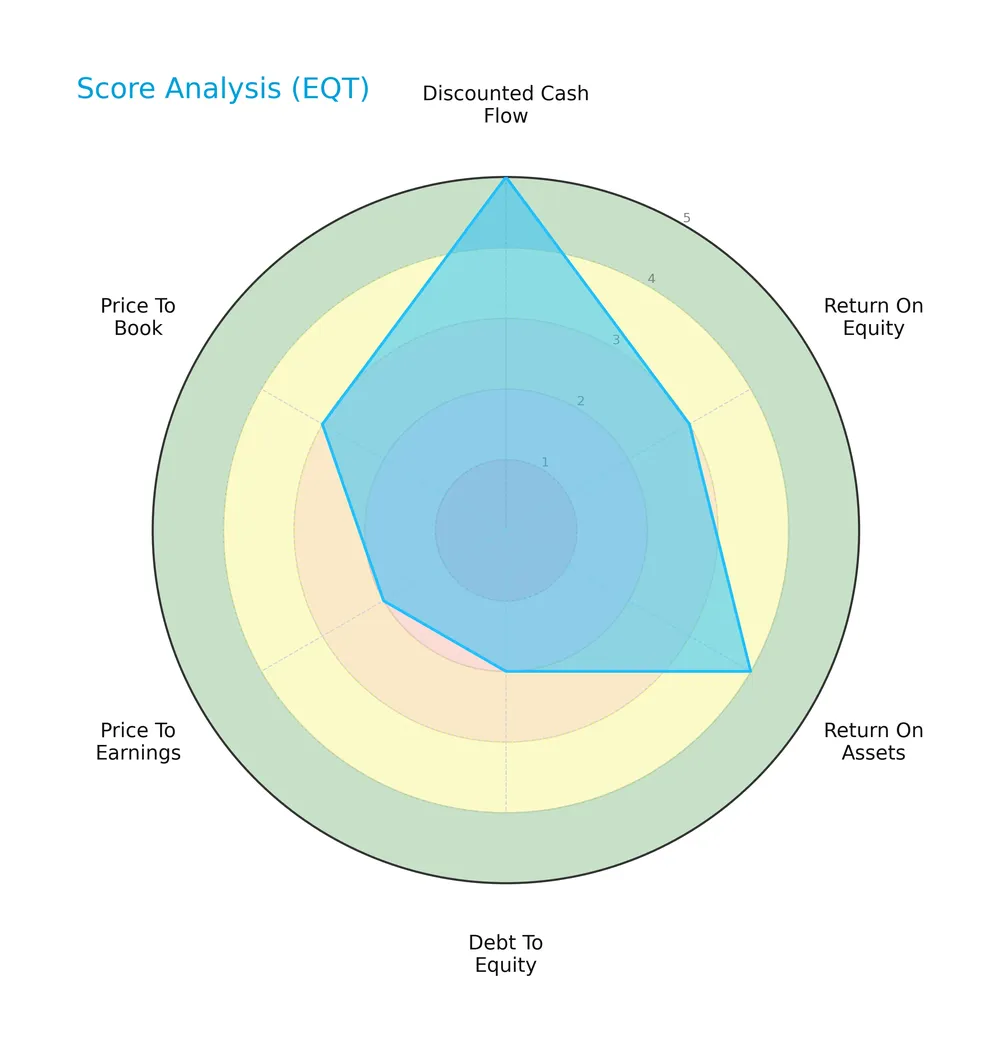
EQT’s discounted cash flow score ranks very favorable at 5. Return on assets stands favorable at 4, but return on equity is moderate at 3. Debt to equity and price to earnings scores are unfavorable at 2 each, while price to book is moderate at 3.
Analysis of the company’s bankruptcy risk
EQT’s Altman Z-Score places the company in the grey zone, indicating a moderate risk of bankruptcy:

Is the company in good financial health?
The Piotroski Score diagram highlights EQT’s financial strength and operational efficiency:
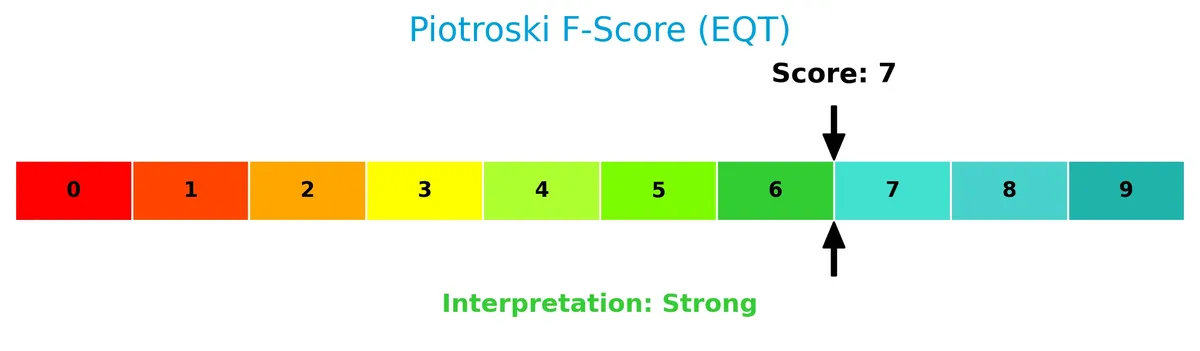
With a Piotroski Score of 7, EQT demonstrates strong financial health, reflecting solid profitability and efficient capital management.
Competitive Landscape & Sector Positioning
This section analyzes EQT Corporation’s strategic positioning within the oil and gas exploration and production sector. We will examine its revenue by segment, key products, main competitors, and overall competitive advantages. I will assess whether EQT holds a sustainable competitive edge over its peers based on this analysis.
Strategic Positioning
EQT Corporation concentrates on natural gas production and related liquids in the US. Its revenue heavily depends on natural gas sales, with smaller contributions from NGLs and oil. The company operates primarily in the Marcellus region, reflecting a focused geographic and product portfolio.
Revenue by Segment
This pie chart illustrates EQT Corporation’s revenue breakdown by segment for the fiscal year 2024, highlighting the company’s primary sources of income.
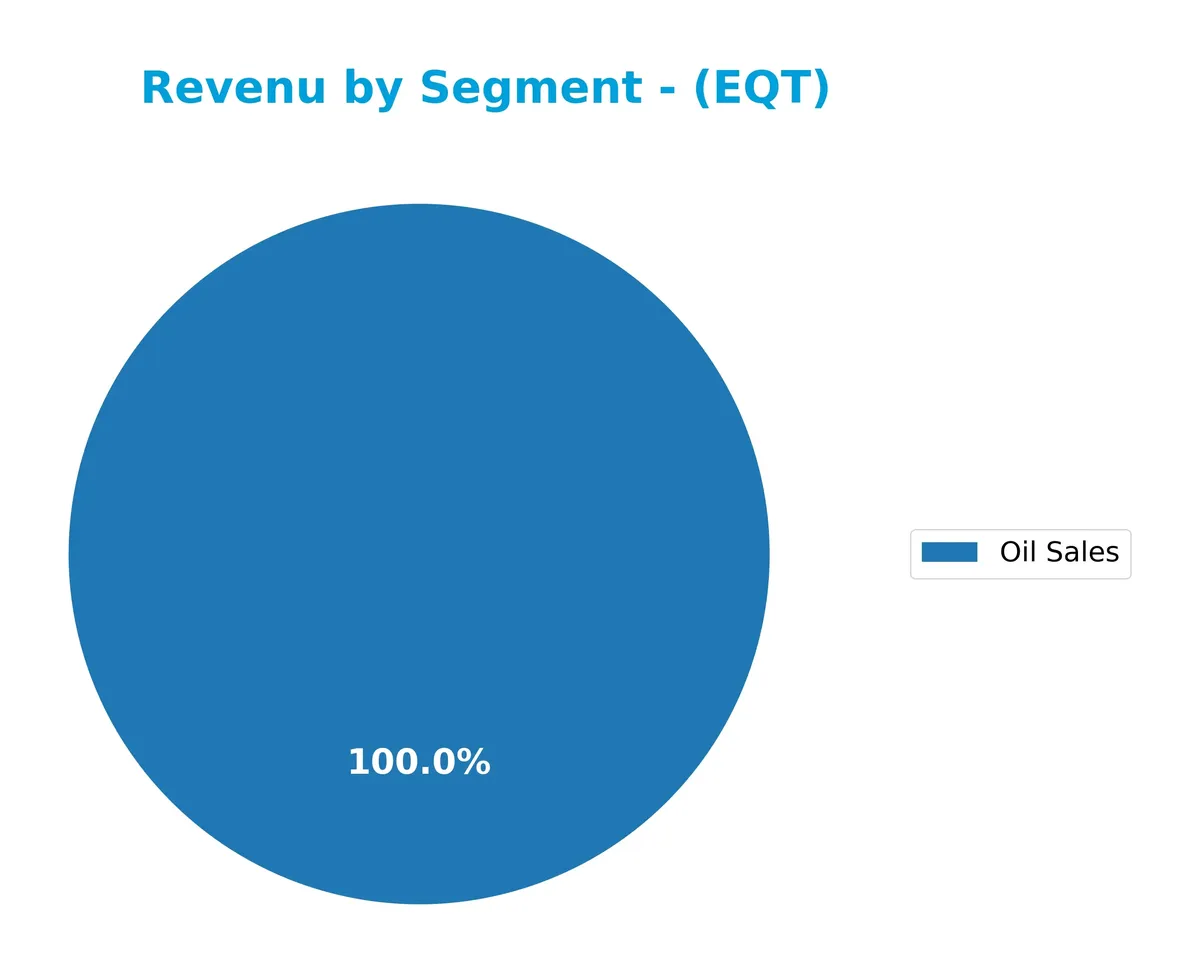
In 2024, Oil Sales dominate EQT’s revenue at $4.9B, marking a significant shift from previous years when Natural Gas Sales led. The absence of Natural Gas and NGLs data for 2024 suggests a strategic pivot or reporting change. Historically, Natural Gas Sales ranged up to $11.4B in 2022 but declined sharply by 2023. This concentration in Oil Sales introduces a potential risk if oil prices fluctuate, signaling a notable evolution in EQT’s revenue composition.
Key Products & Brands
EQT Corporation generates revenue through a diverse portfolio of natural gas and liquids products:
| Product | Description |
|---|---|
| Natural Gas | Primary product with multi-billion-dollar sales, reflecting the company’s core exploration focus. |
| Natural Gas Liquids (NGLs) | Includes ethane, propane, isobutane, butane, and natural gasoline, contributing significant secondary revenue. |
| Oil | Smaller revenue segment compared to gas and NGLs, representing crude oil sales. |
EQT’s portfolio centers on natural gas production, supported by substantial NGLs sales. Oil sales remain a minor but consistent revenue stream. This product mix aligns with industry trends favoring natural gas amid the energy transition.
Main Competitors
There are 10 competitors in total. The table below lists the top 10 leaders by market capitalization:
| Competitor | Market Cap. |
|---|---|
| ConocoPhillips | 120B |
| EOG Resources, Inc. | 59B |
| Diamondback Energy, Inc. | 44B |
| Occidental Petroleum Corporation | 42B |
| EQT Corporation | 33B |
| Expand Energy Corporation | 26B |
| Devon Energy Corporation | 24B |
| Texas Pacific Land Corporation | 21B |
| Coterra Energy Inc. | 20B |
| APA Corporation | 9B |
EQT Corporation ranks 5th among its peers with a market cap at roughly 30% of the leader, ConocoPhillips. It falls below the average market cap of the top 10 but remains above the sector median. EQT is 15.85% smaller than the competitor immediately above it, highlighting a moderate gap in scale.
Comparisons with competitors
Check out how we compare the company to its competitors:
Does EQT have a competitive advantage?
EQT Corporation shows competitive strength through its vast natural gas reserves and favorable net margin of 27%, outperforming many peers in the Oil & Gas Exploration & Production sector. Its substantial reserve base of 25T cubic feet across 2M acres, including 1.7M in the Marcellus play, supports long-term production capacity.
Looking ahead, EQT’s growth in revenue and net income, with a 65.5% one-year revenue increase, signals strong operational momentum. The company’s expanding ROIC trend suggests improving capital efficiency, positioning it to capitalize on opportunities in natural gas and liquids markets amid evolving energy demands.
SWOT Analysis
This SWOT analysis highlights EQT Corporation’s strategic position by examining its internal capabilities and external environment.
Strengths
- Strong net margin at 26.9%
- Significant proved reserves of 25T cubic feet
- Favorable revenue growth of 65.5% in last year
Weaknesses
- Zero EBIT margin signals operational inefficiency
- Unfavorable liquidity ratios raise short-term risk
- Interest coverage at 0.0 indicates financial strain
Opportunities
- Growing demand for natural gas supports expansion
- Potential to improve operational margins
- Rising ROIC trend suggests improving capital efficiency
Threats
- Volatile commodity prices impact revenue
- Regulatory risks in energy sector
- Competition from renewable energy sources
EQT’s strong profitability and reserve base position it well for growth, but operational inefficiencies and financial risks require urgent management focus. The company must leverage market opportunities while mitigating sector volatility and liquidity challenges.
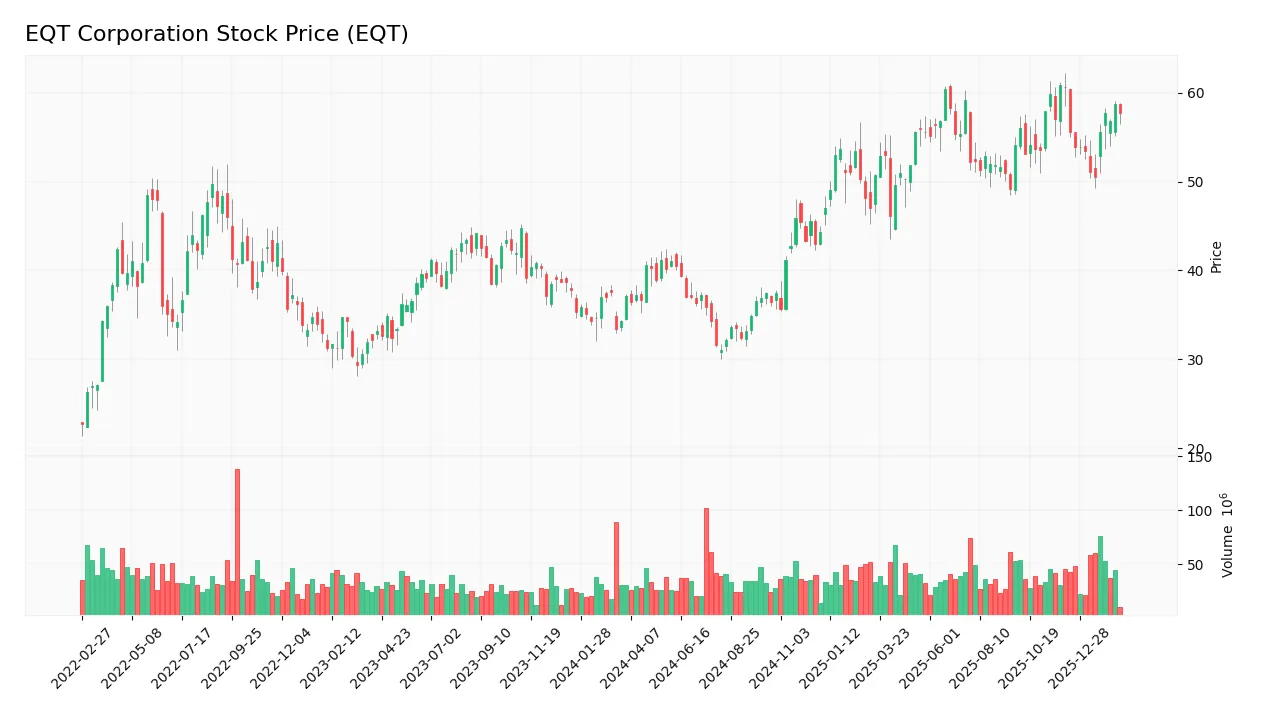
Stock Price Action Analysis
The weekly stock chart below illustrates EQT Corporation’s price movements over the past 12 months, highlighting key support and resistance levels:
Trend Analysis
Over the past 12 months, EQT’s stock price increased by 55.79%, indicating a strong bullish trend. Price volatility measured by an 8.51 standard deviation reflects notable fluctuations. The stock peaked at 60.86 and bottomed at 31.1, with trend acceleration slowing down recently.
Volume Analysis
In the last three months, trading volume has increased but remains seller-dominant, with sellers accounting for 62.41% of activity. This shift suggests cautious investor sentiment and potential profit-taking, despite growing market participation.
Target Prices
Analysts present a target price consensus that reflects cautious optimism for EQT Corporation.
| Target Low | Target High | Consensus |
|---|---|---|
| 23 | 55 | 41.11 |
The target range indicates a wide valuation spread, suggesting diverse market views but a moderate upside expectation overall.

Don’t Let Luck Decide Your Entry Point
Optimize your entry points with our advanced ProRealTime indicators. You’ll get efficient buy signals with precise price targets for maximum performance. Start outperforming now!
Analyst & Consumer Opinions
This section examines EQT Corporation’s recent analyst grades alongside consumer feedback to gauge market sentiment.
Stock Grades
Here are the latest verified analyst grades for EQT Corporation from leading financial institutions:
| Grading Company | Action | New Grade | Date |
|---|---|---|---|
| Stephens & Co. | Maintain | Overweight | 2026-01-22 |
| Barclays | Maintain | Overweight | 2026-01-21 |
| Bernstein | Maintain | Outperform | 2026-01-05 |
| Citigroup | Maintain | Buy | 2025-12-19 |
| Mizuho | Maintain | Outperform | 2025-12-12 |
| UBS | Maintain | Buy | 2025-12-12 |
| Scotiabank | Maintain | Sector Perform | 2025-11-21 |
| Piper Sandler | Maintain | Neutral | 2025-11-18 |
| Wells Fargo | Maintain | Overweight | 2025-10-23 |
| UBS | Maintain | Buy | 2025-10-17 |
The consensus remains positive with a majority rating EQT as a Buy or Outperform. Few analysts assign neutral or sector perform grades, indicating measured confidence in the stock’s prospects.
Consumer Opinions
EQT Corporation evokes mixed reactions from consumers, reflecting its complex role in the energy sector.
| Positive Reviews | Negative Reviews |
|---|---|
| Reliable energy supply even during peak demand | Environmental concerns over fracking |
| Transparent communication on operational risks | Customer service response times need improvement |
| Competitive pricing compared to regional peers | Perceived lack of investment in renewable energy |
Consumers appreciate EQT’s dependable service and clear communication. However, environmental impact and customer support remain recurring concerns, suggesting areas for strategic improvement.
Risk Analysis
Below is a summary of key risks facing EQT Corporation, categorized by type with likelihood and potential impact:
| Category | Description | Probability | Impact |
|---|---|---|---|
| Market Risk | Natural gas price volatility affects revenues significantly | High | High |
| Operational Risk | Dependence on Marcellus shale reserves limits diversification | Medium | Medium |
| Financial Risk | Weak liquidity ratios signal potential short-term cash stress | Medium | High |
| Regulatory Risk | Stricter environmental regulations could increase costs | Medium | Medium |
| Credit Risk | Moderate debt levels with unfavorable debt-to-equity score | Medium | Medium |
The most pressing risk is market exposure to natural gas prices, which historically drives earnings swings in this sector. EQT’s liquidity concerns and interest coverage weaknesses add financial strain, raising caution despite a strong Piotroski score and moderate Altman Z-score in the grey zone.
Should You Buy EQT Corporation?
EQT appears to be a company with improving profitability and growing ROIC, suggesting strengthening operational efficiency. Despite a manageable but notable leverage profile and liquidity concerns, its overall B+ rating signals a moderately favorable investment profile, warranting cautious consideration.
Strength & Efficiency Pillars
EQT Corporation posts a favorable net margin of 26.9%, reflecting strong operational profitability. Despite an unfavorable ROE and ROIC at 0%, the company shows robust revenue growth of 65.53% year-over-year and a 303.51% net income increase over five years. These figures indicate efficient top-line expansion and margin improvement. However, ROIC compared to WACC is unavailable, so value creation cannot be confirmed outright, limiting the assessment of capital efficiency.
Weaknesses and Drawbacks
EQT is positioned in the Altman Z-Score grey zone at 2.08, signaling moderate bankruptcy risk. This caution overshadows some operational strengths. The firm faces unfavorable leverage metrics, including a weak current ratio and interest coverage, which raise liquidity concerns. Additionally, recent seller dominance (buyer share at 37.59%) suggests short-term market pressure. While the P/E ratio of 14.1 is favorable, the mixed debt profile and liquidity red flags warrant prudence.
Our Final Verdict about EQT Corporation
EQT’s profile suggests a company with operational momentum and solid earnings growth but moderate financial risk. Its Altman Z-Score in the grey zone injects caution, implying solvency is not guaranteed. Despite a bullish long-term trend, recent seller dominance advises a wait-and-see stance. Investors seeking exposure might consider EQT cautiously, as it could offer upside but carries notable liquidity and leverage risks.
Disclaimer: This content is for informational purposes only and does not constitute financial, investment, or other professional advice. Investing in financial markets involves a significant risk of loss, and past performance is not indicative of future results.
Additional Resources
- EQT Corporation (EQT) Surpasses Q4 Earnings and Revenue Estimates – Yahoo Finance (Feb 17, 2026)
- EQT Corp beats quarterly profit estimates on higher natgas prices, sales volumes – Reuters (Feb 17, 2026)
- EQT Corporation beats Q4, targets $3.5 billion free cash flow in 2026 – Investing.com (Feb 17, 2026)
- EQT Reports Fourth Quarter and Full Year 2025 Results and Provides 2026 Guidance – PR Newswire (Feb 17, 2026)
- Could AES acquisition change EQT Corporation’s (EQT) future prospects? – MSN (Feb 17, 2026)
For more information about EQT Corporation, please visit the official website: eqt.com