Home > Analyses > Technology > EPAM Systems, Inc.
EPAM Systems transforms how companies harness digital technology to compete and innovate. It pioneers software engineering and digital platform solutions that power global enterprises across industries. Renowned for its deep technical expertise and agile delivery, EPAM sets the standard in IT services and digital transformation. As the tech landscape evolves rapidly, I examine whether EPAM’s robust fundamentals justify its growth prospects and premium market valuation in 2026.

Table of contents
Business Model & Company Overview
EPAM Systems, Inc., founded in 1993 and headquartered in Newtown, Pennsylvania, stands as a leader in Information Technology Services. The company delivers a cohesive ecosystem of digital platform engineering and software development services. Its offerings span from requirements analysis to sophisticated AI, robotics, and virtual reality solutions, serving sectors like financial services, healthcare, and software. EPAM’s scale is evident with 61,200 employees driving innovation globally.
EPAM generates value by blending engineering, infrastructure management, and consulting services with strong emphasis on software testing and automation. Its revenue engine balances custom software development and recurring maintenance contracts across the Americas, Europe, and Asia. The company’s strategic global footprint and integrated service model create a formidable economic moat, positioning it at the forefront of digital transformation worldwide.
Financial Performance & Fundamental Metrics
I will analyze EPAM Systems, Inc.’s income statement, key financial ratios, and dividend payout policy to assess its core financial health and shareholder returns.
Income Statement
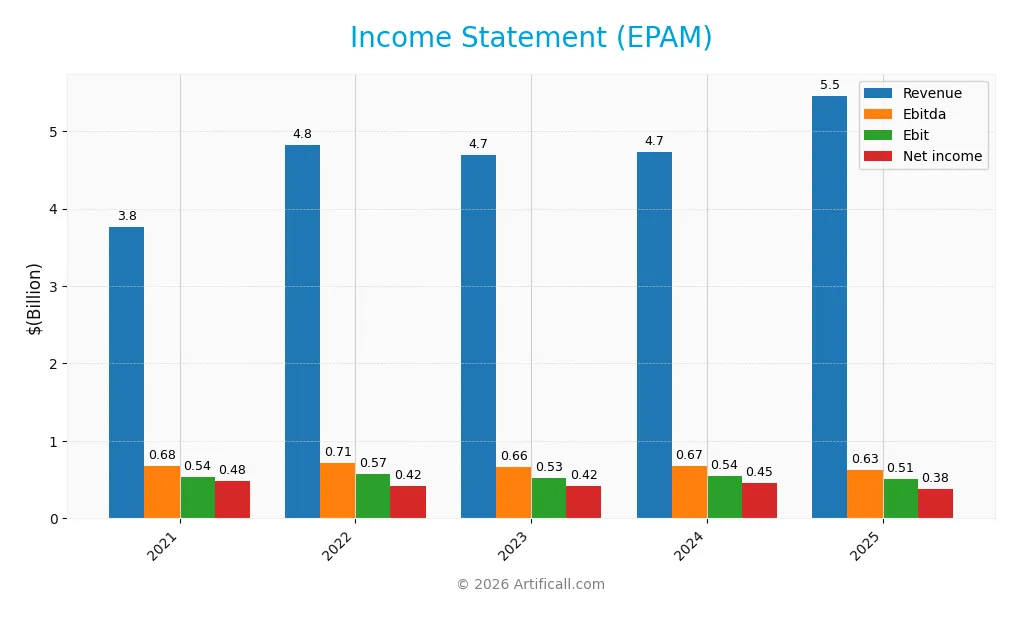
This table presents EPAM Systems, Inc.’s key income statement metrics for fiscal years 2021 through 2025, showing trends in revenue, profitability, and earnings per share.
| 2021 | 2022 | 2023 | 2024 | 2025 | |
|---|---|---|---|---|---|
| Revenue | 3.76B | 4.82B | 4.69B | 4.73B | 5.46B |
| Cost of Revenue | 2.48B | 3.29B | 3.26B | 3.28B | 4.01B |
| Operating Expenses | 732M | 965M | 933M | 906M | 928M |
| Gross Profit | 1.27B | 1.54B | 1.43B | 1.45B | 1.45B |
| EBITDA | 680M | 713M | 660M | 672M | 630M |
| EBIT | 535M | 573M | 527M | 545M | 506M |
| Interest Expense | 1.73M | 0 | 0 | 0 | 0 |
| Net Income | 482M | 419M | 417M | 455M | 378M |
| EPS | 8.52 | 7.32 | 7.21 | 7.93 | 6.76 |
| Filing Date | 2022-02-25 | 2023-02-24 | 2024-02-22 | 2025-02-28 | 2026-02-26 |
Income Statement Evolution
EPAM Systems’ revenue grew 45.2% from 2021 to 2025, with a notable 15.4% increase in the latest year. However, net income declined 21.6% over the same period, driven by a 46% contraction in net margin. Gross profit remained stable, causing a slight compression in profitability despite consistent revenue expansion.
Is the Income Statement Favorable?
In 2025, EPAM reported a 6.9% net margin and a 26.6% gross margin, both favorable compared to industry norms. Yet, the 7.1% EBIT decline and 28% net margin drop year-over-year reveal operational pressures. Earnings per share fell 14.3%, signaling challenges despite revenue growth. Overall, fundamentals appear unfavorable due to deteriorating profitability metrics.
Financial Ratios
The table below presents key financial ratios for EPAM Systems, Inc. over the past five fiscal years, capturing profitability, liquidity, leverage, and valuation metrics:
| Ratios | 2021 | 2022 | 2023 | 2024 | 2025 |
|---|---|---|---|---|---|
| Net Margin | 13% | 9% | 9% | 10% | 7% |
| ROE | 19% | 14% | 12% | 13% | 10% |
| ROIC | 17% | 14% | 10% | 11% | 10% |
| P/E | 78.4 | 44.8 | 41.2 | 29.5 | 30.3 |
| P/B | 15.2 | 6.3 | 5.0 | 3.7 | 3.1 |
| Current Ratio | 3.0 | 3.7 | 4.8 | 3.0 | 2.6 |
| Quick Ratio | 3.0 | 3.7 | 4.8 | 3.0 | 2.6 |
| D/E | 0.10 | 0.06 | 0.05 | 0.04 | 0.04 |
| Debt-to-Assets | 6.8% | 4.8% | 4.0% | 3.4% | 2.9% |
| Interest Coverage | 314x | 0x | 0x | 0x | 0x |
| Asset Turnover | 1.07 | 1.20 | 1.08 | 1.00 | 1.11 |
| Fixed Asset Turnover | 8.9 | 11.4 | 12.7 | 14.1 | 17.2 |
| Dividend Yield | 0% | 0% | 0% | 0% | 0% |
*Notes: Net Margin, ROE, and ROIC are rounded to whole percentages for clarity. Interest Coverage is zero in years with no interest expense reported.*
Evolution of Financial Ratios
From 2021 to 2025, EPAM’s Return on Equity (ROE) declined from 19.37% to 10.27%, indicating a slowdown in profitability. The Current Ratio remained robust but decreased from 4.79 in 2023 to 2.59 in 2025, signaling reduced liquidity. Debt-to-Equity Ratio improved steadily, dropping from 0.10 in 2021 to 0.04 in 2025, reflecting lower leverage.
Are the Financial Ratios Favorable?
EPAM’s 2025 ratios show mixed signals. Profitability margins and returns on invested capital are neutral, as ROE at 10.27% lags behind the WACC of 11.52%, which is unfavorable. Liquidity ratios like the current and quick ratios at 2.59 are favorable, supporting short-term stability. Low debt levels and strong asset turnover also score favorably. However, valuation multiples such as P/E at 30.32 and Price-to-Book at 3.11 are elevated, marking some market risk. Overall, the financial ratios are slightly favorable.
Shareholder Return Policy
EPAM Systems, Inc. does not pay dividends, reflecting a reinvestment strategy focused on growth and capital allocation. The company maintains strong free cash flow coverage and a low debt ratio, supporting operational flexibility without distributing earnings to shareholders.
The absence of dividends aligns with EPAM’s emphasis on long-term value creation through reinvestment rather than immediate cash returns. The company’s approach appears sustainable, given its solid profitability and prudent capital structure, although lack of dividends may not suit income-focused investors.
Score analysis
The following radar chart illustrates key valuation and financial performance scores for EPAM Systems, Inc.:
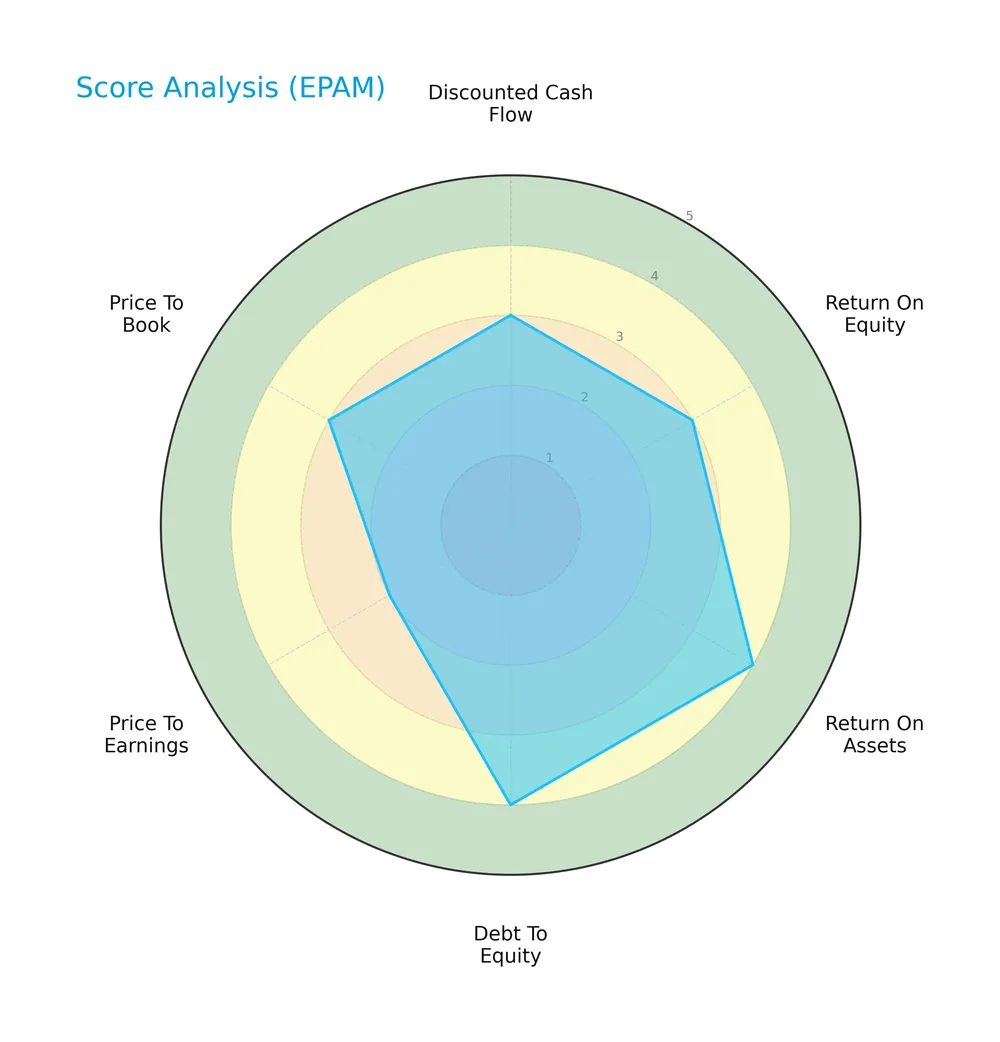
EPAM shows moderate scores in discounted cash flow, return on equity, and price-to-book ratios. Return on assets and debt-to-equity scores are favorable, indicating efficient asset use and controlled leverage. The price-to-earnings score remains unfavorable, signaling valuation concerns.
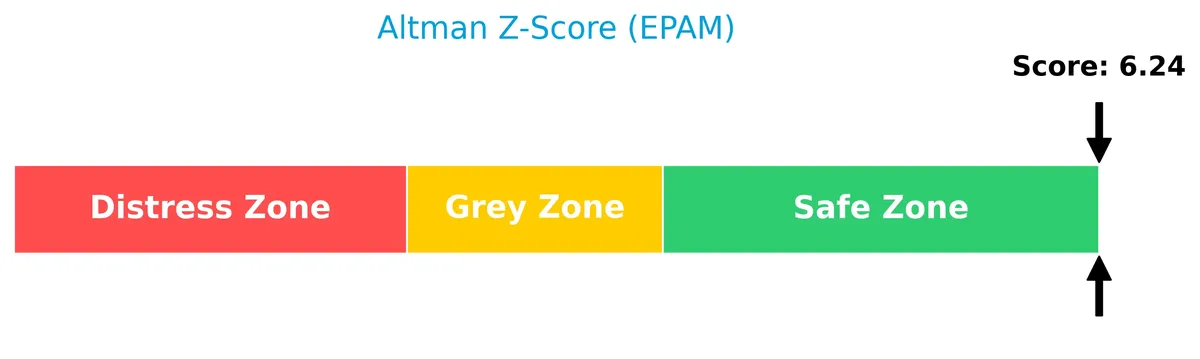
Analysis of the company’s bankruptcy risk
EPAM’s Altman Z-Score places it firmly in the safe zone, indicating a low risk of bankruptcy and strong financial stability:
Is the company in good financial health?
Here is the Piotroski Score diagram reflecting EPAM’s financial strength:

With a Piotroski Score of 6, EPAM demonstrates average financial health. This suggests moderate strength but leaves room for improvement in profitability or operational efficiency.
Competitive Landscape & Sector Positioning
This section examines EPAM Systems, Inc.’s role within the Information Technology Services sector. We will analyze its strategic positioning, revenue breakdown, key products, and main competitors. I will assess whether EPAM holds a competitive advantage over its peers.
Strategic Positioning
EPAM Systems operates a diversified product portfolio spanning digital engineering, IT infrastructure, and consulting across multiple industries. Its geographic exposure is broad, with a dominant 3B USD revenue from the US and significant contributions from Europe, including the UK, Switzerland, Germany, and the Netherlands.
Revenue by Segment
This pie chart illustrates EPAM Systems’ revenue distribution by key sectors for fiscal year 2025, highlighting the company’s diversified exposure across multiple industry verticals.
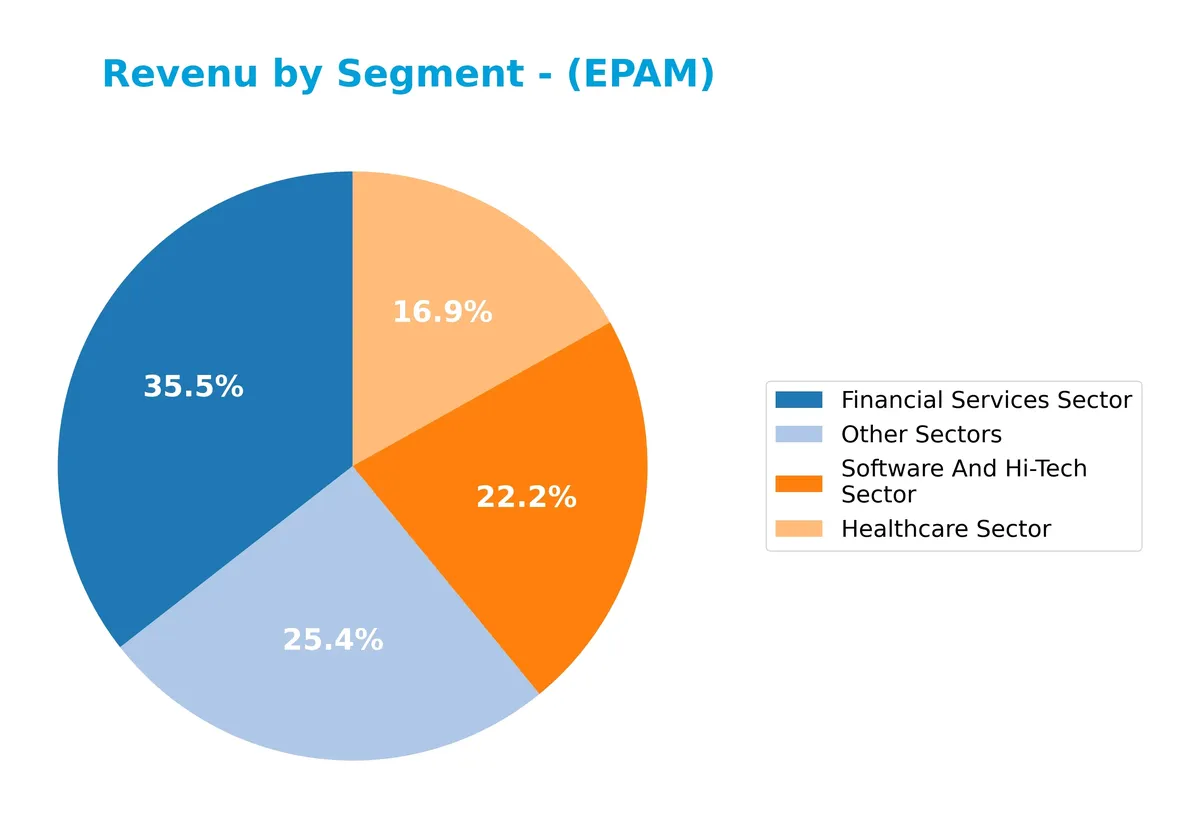
In 2025, the Financial Services Sector leads with $1.32B, underscoring its critical role in EPAM’s revenue base. Other Sectors contribute $940M, while Software and Hi-Tech and Healthcare sectors generate $822M and $626M respectively. The shift shows a consolidation around financial services and technology, signaling a strategic focus. The absence of previously reported sectors suggests a concentration risk but also sharper growth in core areas.
Key Products & Brands
The table below outlines EPAM Systems’ core products and service segments by industry focus and solution type:
| Product | Description |
|---|---|
| Engineering Services | Includes requirements analysis, platform selection, customization, migration, implementation, and integration. |
| Infrastructure Management | Covers software development, testing, maintenance across private, public, and mobile infrastructures including system operations. |
| Maintenance and Support Services | Provides ongoing maintenance, monitoring, incident notification, and resolution services. |
| Operation Solutions | Integrated engineering practices combined with smart automation to optimize client operations. |
| Optimization Solutions | Software testing, test management, automation, and consulting to enhance quality assurance and identify security vulnerabilities. |
| Business and Technical Consulting | Advisory services spanning business, experience, technology, data, and technical domains. |
| Digital and Service Design | Strategy, creative design, program management, and physical product development such as AI, robotics, and virtual reality. |
| Financial Services Sector | Tailored digital platform engineering and software development services for financial institutions. |
| Healthcare Sector | Specialized IT services supporting life sciences, healthcare, and related industries. |
| Software and Hi-Tech Sector | Software development and engineering solutions for technology-driven companies. |
| Consumer Goods, Retail & Travel | IT solutions targeting consumer-facing industries including retail and travel markets. |
| Business Information and Media | Services supporting information, media, and business sectors. |
| Emerging Vertical Sector | Focused offerings for emerging industries and vertical markets. |
EPAM Systems delivers a broad portfolio of digital engineering and consulting services. Its diverse industry coverage—from financial services to healthcare and hi-tech—reflects a strategic focus on scalable, high-value technology solutions.
Main Competitors
EPAM Systems, Inc. faces competition from 16 companies in its sector; here are the top 10 leaders by market capitalization:
| Competitor | Market Cap. |
|---|---|
| International Business Machines Corporation | 272B |
| Accenture plc | 162B |
| Cognizant Technology Solutions Corporation | 40B |
| Fiserv, Inc. | 36B |
| Fidelity National Information Services, Inc. | 34B |
| Wipro Limited | 30B |
| Leidos Holdings, Inc. | 23B |
| Gartner, Inc. | 18B |
| CDW Corporation | 17B |
| Jack Henry & Associates, Inc. | 13B |
EPAM ranks 11th among 16 competitors, with a market cap just 2.81% of the top leader, IBM. The company sits below both the average market cap of the top 10 leaders (approximately 65B) and the sector median (about 18B). It trails its nearest competitor above by a significant 69.64%, indicating a notable gap in scale.
Comparisons with competitors
Check out how we compare the company to its competitors:
Does EPAM have a competitive advantage?
EPAM does not present a competitive advantage as its return on invested capital (ROIC) falls below its weighted average cost of capital (WACC). The company is shedding value with a sharply declining ROIC over the 2021-2025 period.
Looking ahead, EPAM’s broad service offerings in digital platform engineering and emerging technologies like AI and robotics may open new market opportunities. However, its historical trend of declining profitability signals caution despite potential growth avenues.
SWOT Analysis
This SWOT analysis identifies EPAM Systems’ key internal and external factors shaping its strategic outlook.
Strengths
- strong revenue growth of 15% in 2025
- robust liquidity with current ratio of 2.59
- low debt levels with debt-to-equity of 0.04
Weaknesses
- declining net margin by 28% in one year
- ROIC below WACC, indicating value destruction
- high valuation multiples with P/E above 30
Opportunities
- expanding digital transformation demand globally
- growth in US and Europe markets
- innovation in AI, robotics, and virtual reality
Threats
- intense competition in IT services sector
- margin pressure from rising operational costs
- geopolitical risks affecting international revenue
Overall, EPAM’s solid revenue and liquidity support growth potential but margin erosion and value destruction pose risks. The company must leverage innovation and geographic diversification while managing cost pressures to sustain competitive advantage.
Stock Price Action Analysis
The weekly stock chart displays EPAM Systems, Inc.’s price movements over the past 12 months, highlighting key highs, lows, and volatility patterns:
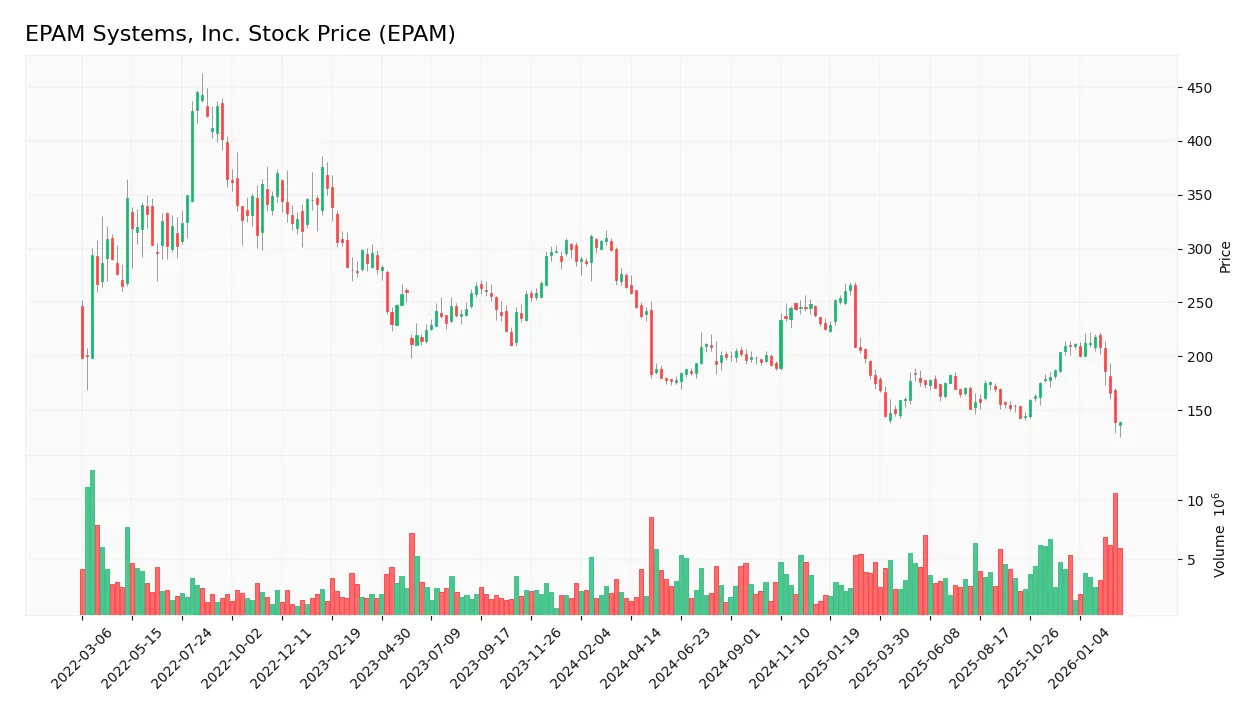
Trend Analysis
Over the past 12 months, EPAM’s stock price declined by 47.56%, indicating a clear bearish trend. The price range spans from a high of 266.12 to a low of 138.62, with volatility at 32.04. The downward trend shows deceleration, suggesting a slowing pace of decline.
Volume Analysis
Trading volumes increased overall, with total activity at 413M shares. Buyer volume slightly exceeds seller volume at 50.66%, indicating balanced interest. However, recent three-month data shows seller dominance at 72%, with declining buyer participation, signaling cautious or bearish investor sentiment.
Target Prices
Analysts set a clear consensus target price for EPAM Systems, Inc., reflecting confidence in its growth prospects.
| Target Low | Target High | Consensus |
|---|---|---|
| 146 | 247 | 197 |
The target range spans from 146 to 247, with a consensus near 197, signaling broad optimism balanced by some valuation variance.

Don’t Let Luck Decide Your Entry Point
Optimize your entry points with our advanced ProRealTime indicators. You’ll get efficient buy signals with precise price targets for maximum performance. Start outperforming now!
Analyst & Consumer Opinions
This section examines EPAM Systems, Inc.’s analyst ratings alongside consumer feedback to reveal market sentiment and user experience.
Stock Grades
The following table summarizes the latest verified stock grades for EPAM Systems, Inc. from major financial institutions:
| Grading Company | Action | New Grade | Date |
|---|---|---|---|
| JP Morgan | Maintain | Overweight | 2026-02-20 |
| Needham | Maintain | Buy | 2026-02-20 |
| Truist Securities | Maintain | Hold | 2026-02-20 |
| Citigroup | Maintain | Neutral | 2026-02-20 |
| Goldman Sachs | Maintain | Buy | 2026-02-20 |
| Wells Fargo | Maintain | Overweight | 2026-02-20 |
| Citigroup | Maintain | Neutral | 2026-01-29 |
| Wells Fargo | Maintain | Overweight | 2026-01-14 |
| TD Cowen | Maintain | Buy | 2026-01-09 |
| Mizuho | Maintain | Outperform | 2025-11-11 |
The consensus reflects a predominantly positive sentiment with most analysts maintaining buy or overweight ratings. Neutral and hold ratings are limited, indicating a general confidence in EPAM’s market position.
Consumer Opinions
Consumers show a mixed but generally favorable sentiment toward EPAM Systems, highlighting its technical expertise and customer service.
| Positive Reviews | Negative Reviews |
|---|---|
| “EPAM delivers innovative solutions with great technical skill.” | “Project timelines occasionally slip, causing frustration.” |
| “The team is highly responsive and communicative throughout delivery.” | “Pricing can be on the higher side for smaller clients.” |
| “Strong domain knowledge across diverse industries.” | “Some integrations require additional support post-launch.” |
Overall, clients praise EPAM’s technical depth and client engagement. However, recurring concerns include project delays and premium pricing, which could impact smaller contracts.
Risk Analysis
Below is a summary of the key risk factors for EPAM Systems, Inc., categorized by likelihood and potential impact:
| Category | Description | Probability | Impact |
|---|---|---|---|
| Valuation Risk | High P/E at 30.3 and P/B at 3.11 indicate overvaluation risk compared to sector averages. | Medium | High |
| Profitability Risk | ROIC of 9.82% is below WACC of 11.52%, signaling value destruction on new investments. | Medium | High |
| Market Volatility | Beta of 1.72 shows sensitivity to market swings, increasing share price volatility. | High | Medium |
| Dividend Policy | No dividend yield may deter income-focused investors, limiting appeal in volatile markets. | High | Low |
| Financial Health | Altman Z-Score of 6.24 places EPAM well in safe zone, indicating low bankruptcy risk. | Low | Low |
| Operational Risks | Rapid tech changes demand constant innovation; failure could erode competitive position. | Medium | High |
The most pressing risks for EPAM are its unfavorable valuation multiples and the fact that its ROIC trails its WACC. Historically, companies in IT services with this profile often face investor skepticism and valuation corrections. Its high beta further exposes it to market downturns. However, strong liquidity and a robust Altman Z-Score mitigate financial distress concerns. Investors must weigh growth potential against these risks prudently.
Should You Buy EPAM Systems, Inc.?
Analytically, EPAM appears to have moderate profitability and operational efficiency amid a deteriorating competitive moat, suggesting value erosion. Despite a manageable leverage profile and a solid B+ rating, its financial health could be seen as cautious but stable in the current market context.
Strength & Efficiency Pillars
EPAM Systems, Inc. shows operational resilience with a net margin of 6.92% and a return on equity of 10.27%. The company maintains a solid current ratio of 2.59, signaling good short-term liquidity. Despite an ROIC of 9.82%, it falls below the WACC of 11.52%, indicating that EPAM is currently not a value creator. However, favorable debt-to-equity of 0.04 and strong asset turnover of 1.11 highlight efficient capital use and asset management.
Weaknesses and Drawbacks
EPAM faces valuation pressures with a high P/E ratio of 30.32 and a P/B of 3.11, suggesting a premium price that may not reflect its underlying profitability. The declining ROIC trend and negative net margin growth over recent years raise concerns about sustainable value generation. The bearish stock trend, combined with seller dominance at 72.07% recently, indicates mounting market pressure. Dividend yield remains at zero, which may deter income-focused investors.
Our Final Verdict about EPAM Systems, Inc.
EPAM’s solvency remains strong with an Altman Z-Score of 6.24, placing it safely away from bankruptcy risk. The company’s fundamentals are mixed: operational efficiency contrasts with value destruction and unfavorable market sentiment. Despite long-term operational strengths, recent bearish momentum and valuation concerns suggest a cautious, wait-and-see stance for investors seeking optimal entry points.
Disclaimer: This content is for informational purposes only and does not constitute financial, investment, or other professional advice. Investing in financial markets involves a significant risk of loss, and past performance is not indicative of future results.
Additional Resources
- Morgan Stanley Trims Price Target on EPAM Systems, Inc. (EPAM) to $160, Keeps Equal Weight Rating – Finviz (Feb 27, 2026)
- Decoding EPAM Systems Inc (EPAM): A Strategic SWOT Insight – GuruFocus (Feb 27, 2026)
- EPAM Systems, Inc. (NYSE:EPAM) Given Average Recommendation of “Moderate Buy” by Brokerages – MarketBeat (Feb 27, 2026)
- INVESTOR ALERT: Pomerantz Law Firm Investigates Claims On Behalf of Investors of EPAM Systems, Inc. – EPAM – PR Newswire (Feb 26, 2026)
- EPAM Systems Inc. stock outperforms competitors despite losses on the day – MarketWatch (Feb 23, 2026)
For more information about EPAM Systems, Inc., please visit the official website: epam.com