Home > Analyses > Energy > EOG Resources, Inc.
EOG Resources powers industries and homes by unlocking vast reserves of oil and natural gas. It dominates U.S. shale plays, especially in Texas and New Mexico, with a reputation for operational excellence and cost efficiency. EOG’s innovative extraction techniques and disciplined capital allocation set it apart in a volatile energy market. As global energy dynamics shift, I ask: does EOG’s strong asset base and financial discipline still justify its premium valuation and growth outlook?
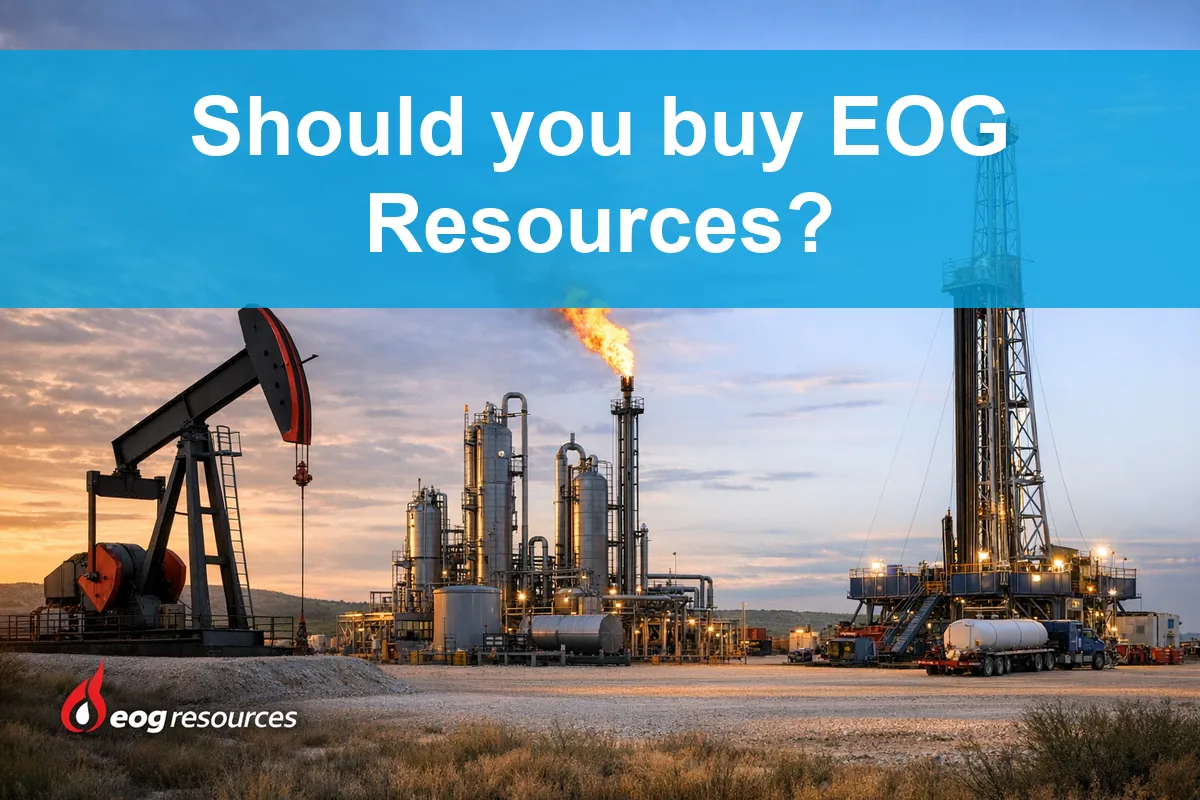
Table of contents
Business Model & Company Overview
EOG Resources, Inc. is a leading player in the Oil & Gas Exploration & Production sector, founded in 1985 and headquartered in Houston, Texas. The company operates a cohesive ecosystem focused on exploring, developing, producing, and marketing crude oil, natural gas, and natural gas liquids. Its dominant presence spans key producing areas in New Mexico, Texas, and Trinidad and Tobago, supported by a workforce of 3,150 employees.
EOG’s revenue engine balances the extraction of hydrocarbons with the marketing of energy products, leveraging sizeable net proved reserves totaling over 3.7B barrels of oil equivalent. Its strategic footprint covers the Americas and extends into global markets, driving steady cash flow. I see EOG’s competitive advantage rooted in its vast reserves and operational efficiency, cementing its role in shaping the energy landscape’s future.
Financial Performance & Fundamental Metrics
I analyze EOG Resources, Inc.’s income statement, key financial ratios, and dividend payout policy to reveal its operational strength and shareholder value proposition.
Income Statement
Below is the Income Statement for EOG Resources, Inc. covering fiscal years 2021 through 2025, showing key profitability and expense metrics in USD.

| 2021 | 2022 | 2023 | 2024 | 2025 | |
|---|---|---|---|---|---|
| Revenue | 19.7B | 29.5B | 23.2B | 23.4B | 22.6B |
| Cost of Revenue | 5.3B | 4.9B | 4.9B | 5.7B | 0 |
| Operating Expenses | 8.2B | 14.7B | 8.6B | 9.6B | 5.6B |
| Gross Profit | 14.3B | 24.6B | 18.2B | 17.7B | 0 |
| EBITDA | 9.8B | 13.6B | 13.3B | 12.5B | 17.4B |
| EBIT | 6.1B | 10.1B | 9.8B | 8.4B | 0 |
| Interest Expense | 178M | 179M | 148M | 138M | 6.6B |
| Net Income | 4.7B | 7.8B | 7.6B | 6.4B | 5.0B |
| EPS | 8.03 | 13.31 | 13.07 | 11.31 | 9.17 |
| Filing Date | 2022-02-24 | 2023-02-23 | 2024-02-22 | 2025-02-27 | 2026-02-24 |
Income Statement Evolution
EOG Resources’ revenue grew 15% from 2021 to 2025 but declined 3.4% in 2025 alone. Net income rose 6.8% over five years yet dropped nearly 22% last year. Margins weakened, with gross profit and EBIT margins disappearing in 2025. Operating expenses shrank slightly, aiding margin support despite top-line pressure.
Is the Income Statement Favorable?
The 2025 income statement reveals mixed fundamentals. Net margin remains favorable at 22%, supporting solid profitability. However, interest expense consumes 29% of revenue, a concerning burden. The absence of gross profit and EBIT margins signals operational challenges. Overall, unfavorable trends outweigh positives, reflecting margin erosion and weaker earnings growth.
Financial Ratios
The following table summarizes key financial ratios for EOG Resources, Inc. over the past five years, providing a concise view of profitability, valuation, liquidity, leverage, efficiency, and shareholder returns:
| Ratios | 2021 | 2022 | 2023 | 2024 | 2025 |
|---|---|---|---|---|---|
| Net Margin | 23.7% | 26.3% | 32.8% | 27.4% | 22.1% |
| ROE | 21.0% | 31.3% | 27.0% | 21.8% | 16.7% |
| ROIC | 13.9% | 20.9% | 18.7% | 14.8% | 46.6% |
| P/E | 11.1 | 9.7 | 9.3 | 10.8 | 11.4 |
| P/B | 2.33 | 3.05 | 2.50 | 2.36 | 1.91 |
| Current Ratio | 2.12 | 1.90 | 2.44 | 2.10 | 1.92 |
| Quick Ratio | 1.98 | 1.71 | 2.13 | 1.91 | 1.64 |
| D/E | 0.27 | 0.24 | 0.15 | 0.17 | 0.28 |
| Debt-to-Assets | 15.4% | 14.4% | 9.5% | 10.7% | 16.2% |
| Interest Coverage | 34.3x | 55.7x | 64.9x | 58.6x | 1.0x |
| Asset Turnover | 0.51 | 0.71 | 0.53 | 0.50 | 0.44 |
| Fixed Asset Turnover | 0.69 | 1.00 | 0.72 | 0.68 | 3.31 |
| Dividend Yield | 5.20% | 6.82% | 4.82% | 3.01% | 3.79% |
Evolution of Financial Ratios
Return on Equity (ROE) showed a decline from a peak of 31.3% in 2022 to 16.7% in 2025, indicating reduced profitability. The Current Ratio remained relatively stable around 1.9 to 2.4, signifying consistent liquidity. Debt-to-Equity Ratio increased modestly to 0.28 in 2025, reflecting a slightly higher leverage but still within a conservative range.
Are the Financial Ratios Fovorable?
Profitability ratios like net margin (22.05%) and ROE (16.69%) remain favorable, supported by a strong Return on Invested Capital (46.62%). Liquidity ratios, including current (1.92) and quick ratios (1.64), are also favorable. Leverage is conservative with a debt-to-equity ratio of 0.28. However, interest coverage at zero and asset turnover at 0.44 are unfavorable. Overall, 71% of ratios are favorable, indicating solid financial health.
Shareholder Return Policy
EOG Resources maintains a dividend payout ratio near 43%, with a consistent dividend per share around $4. Dividend yield hovers around 3.8%, supported by moderate share buybacks. Dividend coverage by free cash flow and capex remains adequate, indicating prudent capital allocation.
This balanced policy reflects commitment to returning capital while sustaining growth investments. Coverage ratios suggest distributions are sustainable, though reliance on commodity cycles introduces risk. Overall, the approach aligns with long-term value creation given EOG’s cash flow strength and capital discipline.
Score analysis
The radar chart below highlights key financial metrics evaluating EOG Resources, Inc.’s valuation and profitability:

EOG scores very favorably on discounted cash flow, return on equity, and return on assets, each rated 5. Debt to equity and price to earnings hold moderate scores of 3, while price to book is less favorable at 2.
Analysis of the company’s bankruptcy risk
EOG Resources, Inc. sits comfortably in the safe zone according to its Altman Z-Score, signaling low bankruptcy risk:

Is the company in good financial health?
The Piotroski Score diagram provides insight into EOG’s financial strength and stability:

With a Piotroski Score of 5, EOG demonstrates average financial health, suggesting moderate operational efficiency and profitability relative to peers.
Competitive Landscape & Sector Positioning
This section analyzes EOG Resources, Inc.’s strategic positioning, revenue segments, key products, and main competitors. I will assess whether EOG holds competitive advantages over its industry peers.
Strategic Positioning
EOG Resources concentrates its portfolio on oil and natural gas production, with oil and condensate generating $12.5B in 2025, dominating revenue. Geographically, it focuses heavily on the US ($22.3B), with modest exposure in Trinidad and Tobago and minimal other international sales, reflecting a concentrated regional strategy.
Revenue by Segment
The pie chart illustrates EOG Resources’ revenue distribution by segment for the fiscal year ending December 31, 2025.

In 2025, Oil and Condensate dominates EOG’s revenue with $12.5B, followed by Natural Gas Gathering and Processing at $4.9B, and Natural Gas Production at $2.8B. The Other segment remains marginal at $72M. Compared to 2024, Oil and Condensate revenue declined modestly, while Natural Gas Gathering fell notably, signaling a shift toward production focus. This concentration on oil revenues highlights exposure to commodity price volatility risks.
Key Products & Brands
The table below outlines EOG Resources’ main product lines and their descriptions:
| Product | Description |
|---|---|
| Oil and Condensate | Crude oil and condensate production, the largest revenue driver with $12.5B reported in 2025. |
| Natural Gas, Production | Extraction of natural gas, generating $2.8B in revenue in 2025. |
| Natural Gas, Gathering, Transportation, Marketing and Processing | Midstream activities related to natural gas, contributing $4.9B in 2025 revenue. |
| Natural Gas Liquids | Byproducts of natural gas processing, reported separately in earlier years but not in 2025 data. |
| Other, Net | Miscellaneous income streams totaling $72M in 2025. |
EOG Resources focuses heavily on oil and condensate, which forms the core of its revenue. Natural gas production and midstream services also contribute significantly, reflecting the company’s integrated approach to energy exploration and marketing.
Main Competitors
There are 10 main competitors in the Oil & Gas Exploration & Production industry; the table lists the top 10 leaders by market capitalization:
| Competitor | Market Cap. |
|---|---|
| ConocoPhillips | 120B |
| EOG Resources, Inc. | 59B |
| Diamondback Energy, Inc. | 44B |
| Occidental Petroleum Corporation | 42B |
| EQT Corporation | 33B |
| Expand Energy Corporation | 26B |
| Devon Energy Corporation | 24B |
| Texas Pacific Land Corporation | 20B |
| Coterra Energy Inc. | 20B |
| APA Corporation | 9B |
EOG Resources ranks 2nd among its peers with a market cap at 56% of the sector leader, ConocoPhillips. It stands significantly above both the average market cap of the top 10 (39.9B) and the sector median (29.8B). The company enjoys a 78% premium over the next competitor below, emphasizing a strong competitive position.
Comparisons with competitors
Check out how we compare the company to its competitors:
Does EOG have a competitive advantage?
EOG Resources, Inc. demonstrates a very favorable competitive advantage, evidenced by a ROIC exceeding its WACC by over 34%, indicating consistent value creation. The company’s ROIC trend shows strong growth, reflecting efficient capital allocation and rising profitability.
Looking ahead, EOG’s principal producing areas in the U.S. and Trinidad and Tobago provide stable revenue sources. Expansion opportunities exist through new product developments and market growth, which could reinforce its competitive positioning in the oil and gas exploration sector.
SWOT Analysis
This analysis highlights EOG Resources, Inc.’s core internal and external factors impacting its strategic position.
Strengths
- strong ROIC well above WACC
- solid net margin of 22%
- low debt-to-equity ratio
Weaknesses
- negative recent revenue growth
- high interest expense ratio
- weak interest coverage ratio
Opportunities
- growing US shale production
- rising dividend yield at 3.8%
- expanding natural gas demand
Threats
- volatile oil prices
- regulatory risks in energy sector
- geopolitical exposure in Trinidad and Tobago
EOG’s robust capital efficiency and profitability underpin a durable competitive advantage. However, recent revenue and margin pressures require strategic focus on cost control and operational resilience. The company must navigate commodity volatility and geopolitical risks carefully while leveraging growth in US shale and dividend appeal.
Stock Price Action Analysis
The weekly stock chart below illustrates EOG Resources, Inc.’s price movements over the past 12 months, highlighting key highs, lows, and trend shifts:

Trend Analysis
Over the past 12 months, EOG’s stock price declined by 9.0%, indicating a bearish trend with accelerating downward momentum. The price ranged between $136.58 and $101.93, showing notable volatility with a 9.07 standard deviation. Recent months show a partial recovery with a 14.53% gain since December 2025.
Volume Analysis
Trading volume over the last three months is increasing and strongly buyer-driven, with buyers accounting for 72.8% of activity. This surge in buying interest suggests growing investor confidence and heightened market participation during the recent price rebound.
Target Prices
Analysts set a clear target consensus for EOG Resources, reflecting moderate upside potential.
| Target Low | Target High | Consensus |
|---|---|---|
| 123 | 153 | 135 |
The consensus target price of $135 indicates steady growth expectations, supported by a balanced range between $123 and $153.

Don’t Let Luck Decide Your Entry Point
Optimize your entry points with our advanced ProRealTime indicators. You’ll get efficient buy signals with precise price targets for maximum performance. Start outperforming now!
Analyst & Consumer Opinions
This section reviews analyst ratings and consumer feedback, offering insights into EOG Resources, Inc.’s market perception.
Stock Grades
Here is the latest overview of EOG Resources, Inc.’s analyst grades from respected financial firms:
| Grading Company | Action | New Grade | Date |
|---|---|---|---|
| Stephens & Co. | Maintain | Equal Weight | 2026-02-12 |
| Piper Sandler | Maintain | Neutral | 2026-01-28 |
| Wells Fargo | Maintain | Overweight | 2026-01-27 |
| Susquehanna | Maintain | Positive | 2026-01-26 |
| Morgan Stanley | Maintain | Equal Weight | 2026-01-23 |
| Barclays | Maintain | Equal Weight | 2026-01-21 |
| Keybanc | Downgrade | Sector Weight | 2026-01-16 |
| RBC Capital | Maintain | Outperform | 2026-01-13 |
| Bernstein | Maintain | Market Perform | 2026-01-05 |
| Citigroup | Maintain | Neutral | 2025-12-17 |
Most firms maintain a neutral to moderately positive stance, with a slight tilt toward hold or equal weight. Keybanc’s downgrade contrasts with RBC Capital’s continued outperform rating, indicating nuanced views among analysts.
Consumer Opinions
EOG Resources, Inc. sparks mixed reactions among its customers, reflecting its operational strengths and areas for improvement.
| Positive Reviews | Negative Reviews |
|---|---|
| Reliable energy supply even during peak demand | Occasional delays in customer service response |
| Competitive pricing compared to peers | Limited transparency on environmental impact |
| Strong safety record noted by field workers | Some complaints about billing accuracy |
| Efficient handling of large-scale projects | Concerns over local community engagement |
Overall, consumers praise EOG’s reliability and safety, key strengths in energy. However, they frequently cite service responsiveness and environmental transparency as persistent challenges.
Risk Analysis
Below is a summary table highlighting key risks facing EOG Resources, Inc. and their likelihood and impact on the business:
| Category | Description | Probability | Impact |
|---|---|---|---|
| Commodity Price Risk | Volatility in oil and gas prices affects revenue and margins | High | High |
| Interest Coverage Risk | Zero interest coverage ratio signals inability to cover interest expenses | Moderate | High |
| Operational Risk | Dependence on U.S. regions and Trinidad & Tobago production | Moderate | Moderate |
| Asset Turnover Risk | Unfavorable asset turnover indicates potential inefficiency | Moderate | Moderate |
| Regulatory Risk | Changes in environmental and energy regulations | Moderate | Moderate |
Commodity price volatility remains the most significant risk, directly impacting EOG’s strong net margins and ROIC. The critical red flag is the zero interest coverage ratio, raising concerns about debt servicing if conditions deteriorate. Operational concentration and efficiency issues also warrant caution.
Should You Buy EOG Resources, Inc.?
EOG Resources appears to be a robust value creator with a durable competitive moat shown by its strong and growing ROIC well above WACC. While its leverage profile seems manageable, mixed valuation scores suggest cautious optimism. Overall rating stands at A.
Strength & Efficiency Pillars
EOG Resources, Inc. demonstrates robust operational efficiency, reflected in a favorable net margin of 22.05% and a solid return on equity of 16.69%. Its return on invested capital (ROIC) stands at an impressive 46.62%, substantially exceeding its weighted average cost of capital (WACC) of 11.99%. This clear spread confirms EOG as a value creator. Additionally, the company’s growing ROIC trend and very favorable moat status underscore a sustainable competitive advantage and strong profitability trajectory.
Weaknesses and Drawbacks
While the financial health appears stable with an Altman Z-Score of 3.63 signaling safety, some risks persist. The company’s interest coverage ratio is unfavorable at 0.0, indicating potential struggles to meet interest obligations from earnings. Asset turnover is low at 0.44, pointing to less efficient asset use. The stock’s price-to-book ratio at 1.91 is neutral, but a moderate debt-to-equity ratio of 0.28 demands monitoring. Despite recent buyer dominance, the overall bearish price trend (-9.0%) reflects market caution.
Our Final Verdict about EOG Resources, Inc.
EOG Resources shows a fundamentally strong profile with efficient capital allocation and value creation. Despite a bearish long-term price trend, recent strong buyer dominance suggests improving momentum. Thus, the company may appear attractive for investors seeking long-term exposure but warrants a watchful stance for potential market volatility and operational risks.
Disclaimer: This content is for informational purposes only and does not constitute financial, investment, or other professional advice. Investing in financial markets involves a significant risk of loss, and past performance is not indicative of future results.
Additional Resources
- EOG Resources beats profit estimates on strong output, higher gas prices – Reuters (Feb 24, 2026)
- EOG Resources (EOG) Q4 Earnings Surpass Estimates – Yahoo Finance (Feb 25, 2026)
- Decoding EOG Resources Inc (EOG): A Strategic SWOT Insight – GuruFocus (Feb 25, 2026)
- EOG Resources Reports Fourth Quarter and Full-Year 2025 Results; Announces 2026 Capital Plan – EnergyNow.com (Feb 25, 2026)
- EOG RESOURCES INC SEC 10-K Report – TradingView (Feb 24, 2026)
For more information about EOG Resources, Inc., please visit the official website: eogresources.com