Home > Analyses > Utilities > Entergy Corporation
Entergy Corporation powers millions of homes and businesses across the southern United States, blending traditional and renewable energy sources. With a 26,000 MW generation capacity, including 6,000 MW from nuclear plants, Entergy stands as a pillar in regulated electric utilities. Its reputation for operational reliability and innovation drives steady demand. Yet, in today’s evolving energy landscape, I question whether its fundamentals fully support current valuations and future growth potential.

Table of contents
Business Model & Company Overview
Entergy Corporation, founded in 1913 and based in New Orleans, Louisiana, commands a dominant position in the regulated electric industry. Its integrated ecosystem spans electricity production and retail distribution, serving 3M utility customers across Arkansas, Louisiana, Mississippi, and Texas. The company’s core mission unites diverse power sources—gas, nuclear, coal, hydro, and solar—into a resilient platform that meets evolving energy demands.
Entergy’s revenue engine balances its Utility segment, which manages generation and delivery, with Entergy Wholesale Commodities, operating and decommissioning nuclear and non-nuclear plants. This dual approach drives steady cash flow from regulated retail sales and wholesale contracts across the US. With 26,000 MW capacity including 6,000 MW nuclear, Entergy’s economic moat lies in its regulated footprint and critical role shaping America’s energy future.
Financial Performance & Fundamental Metrics
I will analyze Entergy Corporation’s income statement, key financial ratios, and dividend payout policy to assess its core financial health and shareholder value.
Income Statement
The table below presents Entergy Corporation’s key income statement figures for fiscal years 2021 through 2025 in USD, highlighting revenue, expenses, profitability, and earnings per share.

| 2021 | 2022 | 2023 | 2024 | 2025 | |
|---|---|---|---|---|---|
| Revenue | 11.7B | 13.8B | 12.1B | 11.9B | 12.9B |
| Cost of Revenue | 6.9B | 8.5B | 6.8B | 6.1B | 9.1B |
| Operating Expenses | 3.0B | 3.2B | 2.7B | 3.1B | 0.8B |
| Gross Profit | 4.9B | 5.3B | 5.3B | 5.7B | 3.9B |
| EBITDA | 4.4B | 4.2B | 4.9B | 5.0B | 5.6B |
| EBIT | 2.1B | 2.0B | 2.7B | 2.6B | 3.1B |
| Interest Expense | 0.8B | 1.0B | 1.0B | 1.2B | 1.3B |
| Net Income | 1.1B | 1.1B | 2.4B | 1.1B | 1.8B |
| EPS | 2.79 | 2.70 | 5.57 | 2.47 | 3.98 |
| Filing Date | 2022-02-25 | 2023-02-24 | 2024-02-23 | 2025-02-18 | 2026-02-19 |
Income Statement Evolution
Entergy Corporation’s revenue grew steadily by 8.98% in 2025, continuing a favorable overall growth trend of 10.25% since 2021. Net income surged 53.34% year-over-year, lifting the net margin to a favorable 13.7%. Despite a 32.52% decline in gross profit, EBIT margin improved to 23.59%, reflecting better operational efficiency and controlled expenses.
Is the Income Statement Favorable?
The 2025 income statement shows strong fundamentals with revenue of $12.9B and net income near $1.78B. EBIT of $3.05B signals solid core profitability despite a notable 10.32% interest expense ratio, which is unfavorable. Overall, 85.7% of profitability metrics rate favorable, supporting a generally positive outlook on Entergy’s earnings quality and growth trajectory.
Financial Ratios
The table below summarizes Entergy Corporation’s key financial ratios from 2021 to 2025, providing a clear view of profitability, liquidity, leverage, and market valuation trends:
| Ratios | 2021 | 2022 | 2023 | 2024 | 2025 |
|---|---|---|---|---|---|
| Net Margin | 9.5% | 8.0% | 19.4% | 8.9% | 13.7% |
| ROE | 9.4% | 8.3% | 15.9% | 6.9% | 10.3% |
| ROIC | 2.8% | 3.7% | 4.6% | 3.2% | 3.6% |
| P/E | 20.2 | 21.0 | 9.1 | 30.6 | 23.0 |
| P/B | 1.9 | 1.7 | 1.4 | 2.1 | 2.4 |
| Current Ratio | 0.51 | 0.51 | 0.52 | 0.70 | 0.73 |
| Quick Ratio | 0.32 | 0.30 | 0.27 | 0.41 | 0.50 |
| D/E | 2.31 | 2.05 | 1.79 | 1.92 | 1.80 |
| Debt-to-Assets | 46.0% | 46.1% | 44.5% | 45.2% | 43.0% |
| Interest Coverage | 2.21 | 2.08 | 2.60 | 2.30 | 2.28 |
| Asset Turnover | 0.20 | 0.23 | 0.20 | 0.18 | 0.18 |
| Fixed Asset Turnover | 0.28 | 0.32 | 0.27 | 0.25 | 0.24 |
| Dividend Yield | 3.5% | 3.7% | 4.4% | 3.1% | 2.7% |
Evolution of Financial Ratios
Return on Equity (ROE) trended lower from 15.9% in 2023 to 10.3% in 2025, indicating reduced profitability. The Current Ratio improved slightly to 0.73 in 2025 but remained below 1, signaling persistent liquidity constraints. The Debt-to-Equity Ratio held high near 1.8, reflecting stable but elevated leverage levels over the period.
Are the Financial Ratios Fovorable?
Profitability shows mixed signals: net margin is favorable at 13.7%, but ROIC is below WACC at 3.55%, an unfavorable sign. Liquidity ratios, including current (0.73) and quick (0.5), are unfavorable, suggesting tight short-term financial flexibility. Leverage is elevated with a debt-to-equity ratio of 1.8, also unfavorable. Market ratios like P/E (23.0) and P/B (2.38) are neutral, while dividend yield at 2.67% is favorable. Overall, the ratios lean slightly unfavorable.
Shareholder Return Policy
Entergy Corporation maintains a consistent dividend payment with a payout ratio around 62% in 2025 and an annual yield near 2.7%. The dividend per share has steadily increased over recent years, supported by steady operating cash flow, though free cash flow remains negative.
The company also engages in share buybacks, balancing capital returns with reinvestment needs. Given the negative free cash flow and significant capital expenditures, this distribution policy warrants close monitoring to ensure sustainable long-term shareholder value creation without excessive financial strain.
Score analysis
The radar chart below displays Entergy Corporation’s key valuation and performance scores:

Entergy shows a mixed profile with a very unfavorable discounted cash flow and debt-to-equity scores. Return on equity is favorable, while return on assets is moderate. Price-to-earnings and price-to-book ratios remain unfavorable.
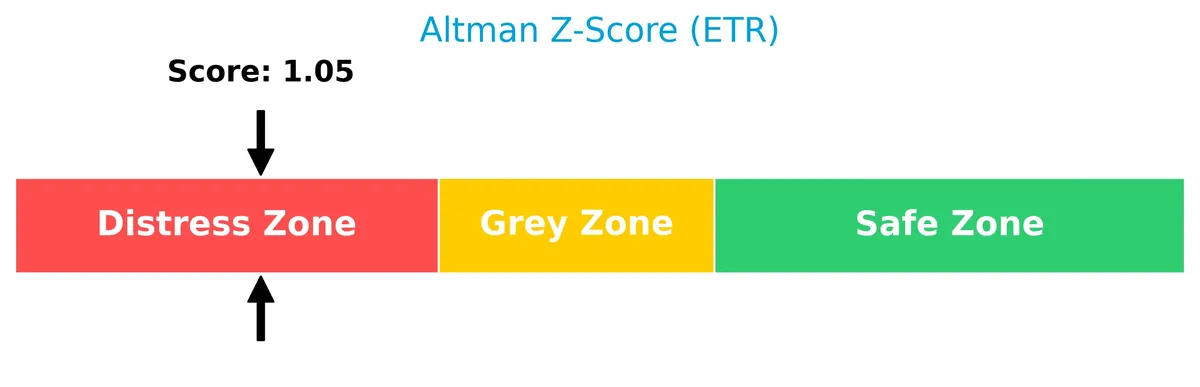
Analysis of the company’s bankruptcy risk
The Altman Z-Score places Entergy Corporation in the distress zone, signaling a high risk of financial distress and potential bankruptcy:
Is the company in good financial health?
The following Piotroski diagram illustrates Entergy’s moderate financial strength based on nine accounting criteria:

With a Piotroski Score of 5, Entergy’s financial health is average, reflecting neither strong resilience nor severe weakness in its fundamentals.
Competitive Landscape & Sector Positioning
This sector analysis explores Entergy Corporation’s strategic positioning, revenue segments, key products, and main competitors. I will assess whether Entergy holds a competitive advantage over its industry peers.
Strategic Positioning
Entergy Corporation concentrates its operations in regulated electric utilities primarily across Arkansas, Louisiana, Mississippi, and Texas, serving 3M utility customers. Its product portfolio spans gas, nuclear, coal, hydro, and solar power, with a balanced mix between wholesale commodities and retail distribution.
Revenue by Segment
This pie chart illustrates Entergy Corporation’s revenue distribution across its key business segments for the fiscal year 2025, highlighting the relative size of each segment.
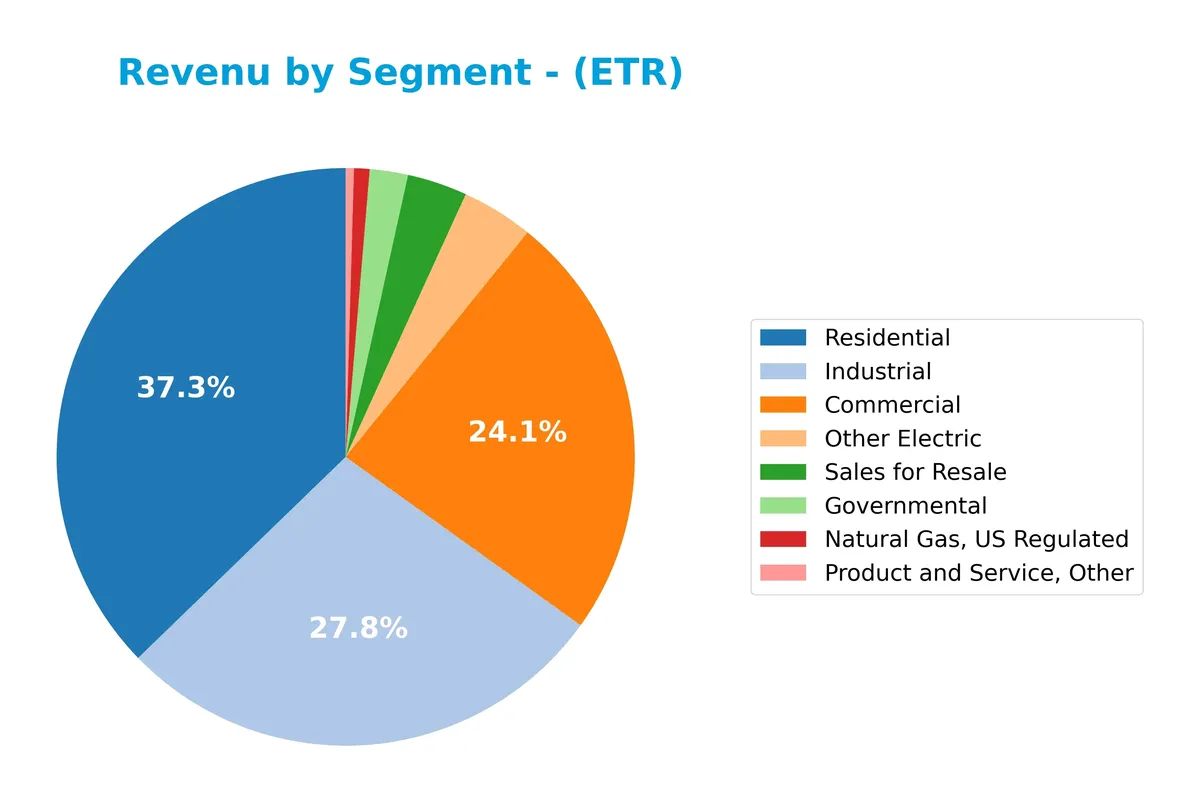
In 2025, Residential leads with $4.8B, followed by Industrial at $3.6B and Commercial at $3.1B. Residential and Industrial segments have shown steady growth, driving the company’s core earnings. Governmental and Natural Gas segments remain smaller contributors. The rise in Residential revenue signals increased demand or pricing power in that segment, while Sales for Resale and Other Electric hold minor but consistent roles. Concentration in Residential and Industrial warrants monitoring for demand shifts.
Key Products & Brands
Entergy Corporation operates a diversified portfolio of energy products and services across multiple customer segments:
| Product | Description |
|---|---|
| Commercial Electricity | Electric power supplied to commercial customers in Arkansas, Louisiana, Mississippi, and Texas. |
| Industrial Electricity | Electric power provided to industrial clients within the company’s regulated territories. |
| Residential Electricity | Power delivered to approximately 3M residential utility customers in the company’s service areas. |
| Governmental Electricity | Electricity supplied to government entities in the company’s service regions. |
| Other Electric Services | Ancillary electric services beyond standard retail and wholesale sales. |
| Sales for Resale | Electricity sold wholesale to power providers, cooperatives, and trading organizations. |
| Natural Gas, US Regulated | Distribution of natural gas within regulated U.S. markets. |
| Entergy Wholesale Commodities | Ownership and operation of nuclear and non-nuclear power plants selling power wholesale. |
Entergy’s product mix reflects a balanced exposure to regulated retail electricity, wholesale power generation, and natural gas distribution. The company’s nuclear capacity of 6,000 MW supports its wholesale segment, while regulated utility operations serve diverse customer bases in the southern U.S.
Main Competitors
Entergy Corporation faces competition from 23 companies in its sector; the table lists the top 10 leaders by market capitalization:
| Competitor | Market Cap. |
|---|---|
| NextEra Energy, Inc. | 169B |
| The Southern Company | 96B |
| Duke Energy Corporation | 91B |
| American Electric Power Company, Inc. | 62B |
| Dominion Energy, Inc. | 51B |
| Exelon Corporation | 44B |
| Xcel Energy Inc. | 44B |
| Entergy Corporation | 42B |
| Public Service Enterprise Group Incorporated | 40B |
| Consolidated Edison, Inc. | 36B |
Entergy ranks 8th among 23 competitors. Its market cap stands at 27.56% of the leader, NextEra Energy. The company is below the top 10 average market cap (67.5B) but above the sector median (34B). Entergy’s market cap is about 4.93% less than the next competitor above it, indicating a modest gap in scale.
Comparisons with competitors
Check out how we compare the company to its competitors:
Does Entergy Corporation have a competitive advantage?
Entergy Corporation currently shows a slightly unfavorable moat, with ROIC below WACC, indicating value destruction despite improving profitability. Its overall financials reveal strong margins and solid revenue growth, yet interest expense remains a concern.
Looking ahead, Entergy’s diverse power generation mix, including nuclear and renewable sources, supports potential market expansion. Its service to 3M utility customers across four states provides stable demand and opportunities in emerging energy sectors.
SWOT Analysis
This analysis highlights Entergy Corporation’s core internal strengths and weaknesses alongside external opportunities and threats impacting its strategic positioning.
Strengths
- Diverse energy mix including nuclear and renewables
- Strong utility customer base of 3M
- Favorable net margin and revenue growth
Weaknesses
- Low current and quick ratios indicate liquidity concerns
- ROIC below WACC signals value destruction
- High debt-to-equity ratio raises financial risk
Opportunities
- Expansion in renewable energy markets
- Increasing demand for clean power in regulated states
- Potential asset optimization and nuclear decommissioning services
Threats
- Regulatory changes impacting tariffs
- Rising interest expenses
- Competition from alternative energy providers
Entergy’s robust revenue and margin trends offset liquidity and capital structure weaknesses. The company must leverage its energy diversification and clean power growth while managing debt and regulatory risks to sustain long-term value creation.
Stock Price Action Analysis
The following weekly chart displays Entergy Corporation’s stock price movement over the last 100 weeks, highlighting key support and resistance levels:
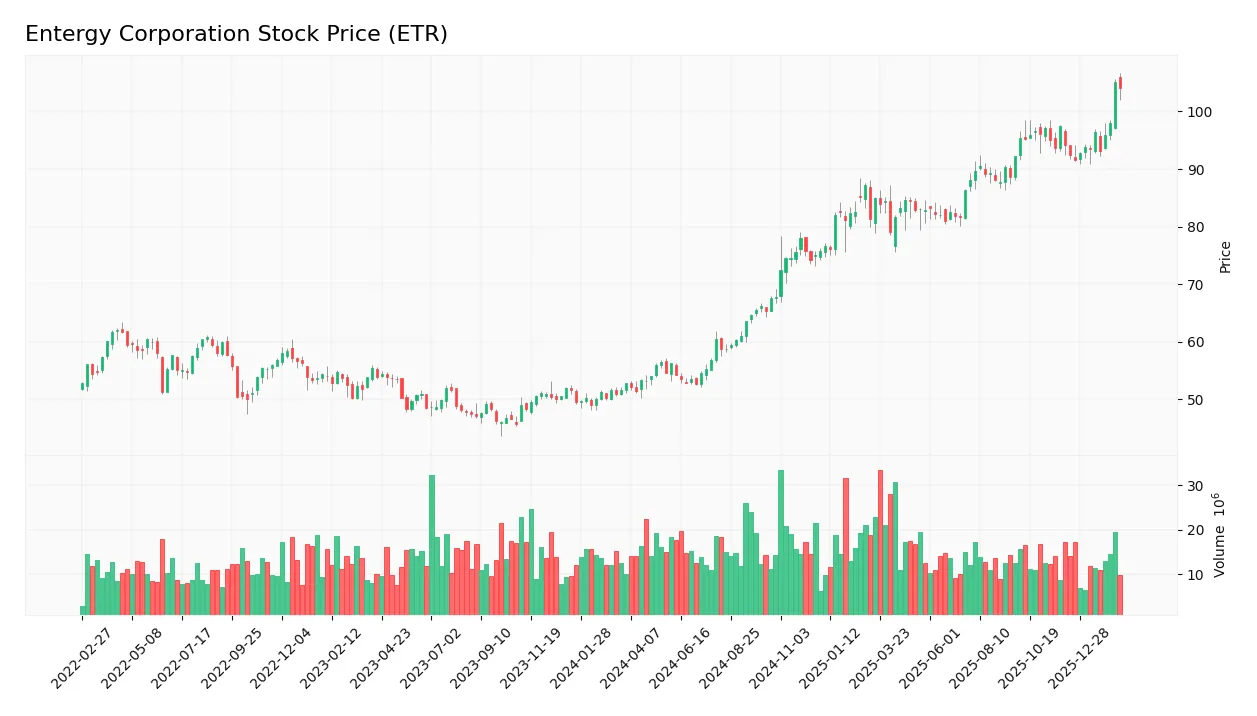
Trend Analysis
Over the past two years, Entergy’s stock gained 96.9%, indicating a strong bullish trend with clear acceleration. Price fluctuated between a low of 51.46 and a high of 105.07. Volatility is notable with a 15% standard deviation, reflecting active market participation and price swings.
Volume Analysis
Trading volume totals 1.83B shares, with buyers accounting for 59.5%. However, volume is decreasing overall. In the recent three months, sellers slightly dominate with 53.2% share, signaling cautious investor sentiment and waning buying enthusiasm.
Target Prices
Analysts set a clear target consensus for Entergy Corporation, reflecting moderate optimism.
| Target Low | Target High | Consensus |
|---|---|---|
| 96 | 112 | 104.67 |
The target range suggests analysts expect steady growth, with a consensus price near 105, signaling confidence in Entergy’s fundamentals.

Don’t Let Luck Decide Your Entry Point
Optimize your entry points with our advanced ProRealTime indicators. You’ll get efficient buy signals with precise price targets for maximum performance. Start outperforming now!
Analyst & Consumer Opinions
This section reviews Entergy Corporation’s analyst ratings and consumer feedback to provide a balanced market perspective.
Stock Grades
The following table presents recent verified stock grades for Entergy Corporation from established financial institutions:
| Grading Company | Action | New Grade | Date |
|---|---|---|---|
| BMO Capital | Maintain | Outperform | 2026-02-13 |
| Wells Fargo | Maintain | Overweight | 2026-01-20 |
| Barclays | Maintain | Overweight | 2026-01-15 |
| Argus Research | Maintain | Buy | 2026-01-06 |
| UBS | Maintain | Buy | 2025-12-17 |
| Keybanc | Maintain | Overweight | 2025-12-12 |
| JP Morgan | Maintain | Overweight | 2025-12-11 |
| Citigroup | Maintain | Neutral | 2025-11-18 |
| Evercore ISI Group | Maintain | In Line | 2025-10-30 |
| Mizuho | Maintain | Outperform | 2025-10-27 |
The consensus among analysts remains firmly positive with no downgrades recorded. Most grades cluster around “Buy” and “Overweight,” indicating confidence in Entergy’s prospects despite a few neutral ratings.
Consumer Opinions
Consumer sentiment around Entergy Corporation (ETR) reflects a blend of appreciation and concern, capturing the complexity of the energy sector experience today.
| Positive Reviews | Negative Reviews |
|---|---|
| Reliable electricity supply even during outages. | Customer service response times often slow. |
| Transparent billing with detailed usage insights. | Pricing perceived as higher than regional peers. |
| Strong commitment to renewable energy projects. | Occasional communication gaps during disruptions. |
Overall, consumers praise Entergy for reliability and renewable initiatives. However, slow customer service and pricing remain common pain points, indicating areas for operational improvement.
Risk Analysis
Below is an overview of Entergy Corporation’s key risks, their likelihood, and potential impact:
| Category | Description | Probability | Impact |
|---|---|---|---|
| Financial Health | Altman Z-Score at 1.05 signals distress zone risk of bankruptcy. | High | High |
| Liquidity | Current ratio 0.73 and quick ratio 0.5 indicate weak short-term liquidity. | High | Medium |
| Leverage | Debt-to-equity at 1.8 is very unfavorable, raising solvency concerns. | Medium | High |
| Operational Efficiency | Low asset turnover (0.18) and fixed asset turnover (0.24) suggest inefficient asset use. | Medium | Medium |
| Regulatory & Market | Utility sector faces regulatory risks and evolving energy policies. | Medium | Medium |
Entergy’s greatest risks stem from its fragile financial health and liquidity. The Altman Z-Score places it in the distress zone, signaling a heightened bankruptcy risk. Elevated debt levels compound this vulnerability. Despite stable revenue streams from regulated utilities, weak asset efficiency and tight liquidity ratios warrant caution. Investors should weigh these factors against the company’s favorable dividend yield and stable market position.
Should You Buy Entergy Corporation?
Entergy appears to be shedding value despite improving profitability, indicating operational efficiency gains. Its leverage profile remains substantial, suggesting elevated financial risk. While the overall rating stands at C+, the firm’s financial health could be seen as moderately challenged.
Strength & Efficiency Pillars
Entergy Corporation delivers solid operational efficiency, reflected in a net margin of 13.7% and an EBIT margin of 23.59%. The company sustains favorable gross margins near 30%, showcasing pricing power and cost control. However, its return on invested capital (ROIC) stands at 3.55%, below the weighted average cost of capital (WACC) at 5.56%, signaling value erosion despite improving profitability trends. The return on equity (10.34%) remains moderate, indicating steady but unspectacular capital returns.
Weaknesses and Drawbacks
Entergy is in financial distress with an Altman Z-Score of 1.05, well below the 1.8 distress threshold, implying a high bankruptcy risk. Leverage is a clear concern, with a debt-to-equity ratio of 1.8 and weak liquidity metrics—current ratio at 0.73 and quick ratio at 0.5—both unfavorable. Interest expense consumes 10.32% of revenue, pressuring cash flows. Valuation appears neutral with a P/E of 23.04 and P/B of 2.38, but the financial fragility outweighs these factors.
Our Final Verdict about Entergy Corporation
Despite operational strengths, Entergy’s solvency risk, highlighted by its distress-zone Altman Z-Score, renders the investment profile highly speculative. The capital structure weakness and liquidity shortfalls overshadow profitability gains. Investors seeking stability may find Entergy too risky, as the threat of bankruptcy limits its appeal regardless of improving margins and a bullish long-term stock trend.
Disclaimer: This content is for informational purposes only and does not constitute financial, investment, or other professional advice. Investing in financial markets involves a significant risk of loss, and past performance is not indicative of future results.
Additional Resources
- Entergy Corporation (ETR) Charts Path for Growth Amid Mixed Results – Yahoo Finance (Feb 20, 2026)
- Entergy Corporation (ETR) Expands Equity Distribution Program wi – GuruFocus (Feb 21, 2026)
- Entergy: The Earnings Base Continues To Move Higher (NYSE:ETR) – Seeking Alpha (Feb 17, 2026)
- Entergy Corporation (ETR) Charts Path for Growth Amid Mixed Results – Insider Monkey (Feb 19, 2026)
- Entergy reports third quarter 2025 financial results – Entergy (Oct 29, 2025)
For more information about Entergy Corporation, please visit the official website: entergy.com