Home > Analyses > Energy > enCore Energy Corp.
enCore Energy Corp. is reshaping the uranium sector by advancing vital domestic energy resources, crucial for the clean energy transition. With extensive uranium projects across New Mexico, Utah, South Dakota, and Wyoming, enCore stands out for its strategic land holdings and commitment to sustainable resource development. Known for its innovation and growth potential, the company commands attention as investors weigh whether its robust asset base and market positioning justify its current valuation and future prospects.
Table of contents
Business Model & Company Overview
enCore Energy Corp., founded in 2011 and headquartered in Corpus Christi, Texas, holds a dominant position in uranium exploration and development across key U.S. mining districts. Its extensive land portfolio spans over 300,000 acres in the Grants Uranium District, New Mexico, and includes strategic assets in South Dakota, Wyoming, and Utah. This cohesive ecosystem of resource properties underpins its mission to secure critical uranium supplies for the energy sector.
The company’s revenue engine is driven by its comprehensive control over diverse uranium properties, balancing exploration and development activities across multiple states. While primarily focused on resource acquisition, enCore’s geographic footprint in the Americas positions it to leverage growing demand for nuclear energy. Its competitive advantage lies in this strategic landholdings network, which creates a formidable economic moat shaping the future of uranium supply in the U.S. energy landscape.
Financial Performance & Fundamental Metrics
This section analyzes enCore Energy Corp.’s income statement, key financial ratios, and dividend payout policy to evaluate its financial health and investment potential.
Income Statement
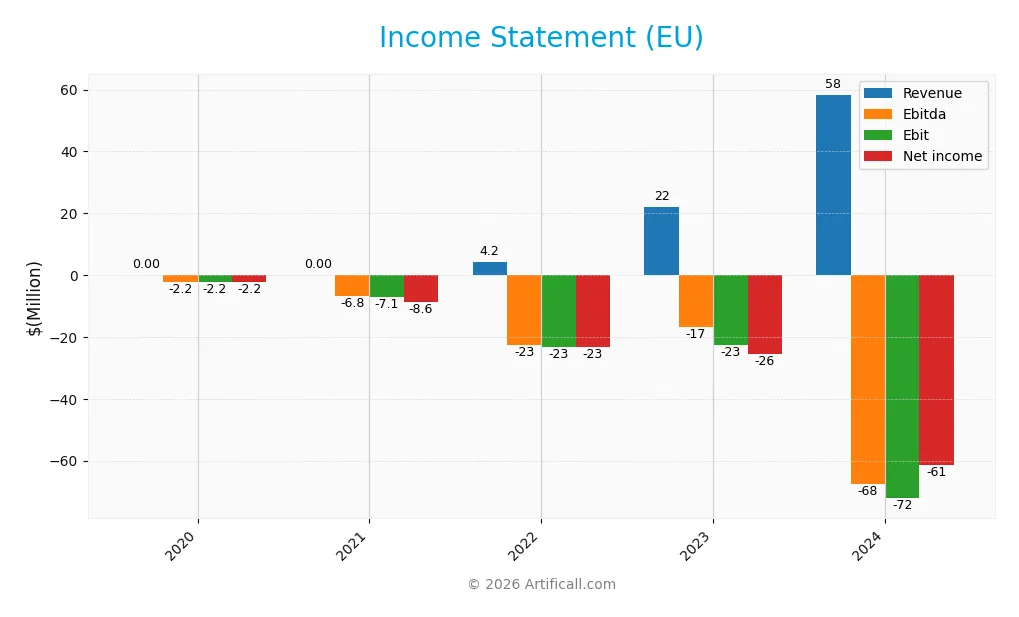
Below is the income statement overview for enCore Energy Corp. (ticker: EU) from 2020 to 2024, showing key financial metrics in USD or CAD as reported.
| 2020 | 2021 | 2022 | 2023 | 2024 | |
|---|---|---|---|---|---|
| Revenue | 0 | 0 | 4.2M | 22.1M | 58.3M |
| Cost of Revenue | 5.2K | 299K | 2.7M | 19.6M | 65.5M |
| Operating Expenses | 2.2M | 5.7M | 27.5M | 43.3M | 65.0M |
| Gross Profit | -5.2K | -299K | 1.6M | 2.6M | -7.2M |
| EBITDA | -2.2M | -6.8M | -22.6M | -16.9M | -67.6M |
| EBIT | -2.2M | -7.1M | -23.3M | -22.6M | -72.2M |
| Interest Expense | 0 | 9.4K | 0 | 3.5M | 1.7M |
| Net Income | -2.2M | -8.6M | -23.2M | -25.6M | -61.4M |
| EPS | -0.044 | -0.17 | -0.22 | -0.18 | -0.34 |
| Filing Date | 2020-12-31 | 2021-12-31 | 2023-04-28 | 2024-03-28 | 2025-03-03 |
Income Statement Evolution
enCore Energy Corp. saw a significant revenue increase of 163% from 2023 to 2024, reaching $58.3M, but this was accompanied by a sharp decline in gross profit, turning negative at -$7.2M. Margins deteriorated overall, with the gross margin at -12.35% and net margin at -105.24%, both marked as unfavorable. Operating expenses grew in line with revenue, but EBIT and net income margins worsened substantially.
Is the Income Statement Favorable?
The 2024 income statement reveals a challenging financial position with a net loss of $61.4M and an EPS of -$0.34, reflecting unfavorable fundamentals. Despite revenue growth, negative gross and EBIT margins of -12.35% and -123.75% respectively highlight operational inefficiencies. Interest expense is relatively low at 2.97% of revenue, a rare favorable metric in an otherwise unfavorable income profile. Overall, the income statement signals persistent losses and margin pressures.
Financial Ratios
The table below presents key financial ratios for enCore Energy Corp. (ticker: EU) over the fiscal years 2020 to 2024, providing a snapshot of profitability, valuation, liquidity, leverage, and operational efficiency:
| Ratios | 2020 | 2021 | 2022 | 2023 | 2024 |
|---|---|---|---|---|---|
| Net Margin | 0% | 0% | -545% | -116% | -105% |
| ROE | -14% | -6% | -11% | -10% | -21% |
| ROIC | -9% | -4% | -12% | -12% | -17% |
| P/E | -64 | -37 | -11 | -22 | -10 |
| P/B | 9.0 | 2.1 | 1.2 | 2.2 | 2.2 |
| Current Ratio | 7.7 | 2.0 | 2.9 | 4.0 | 2.9 |
| Quick Ratio | 7.7 | 2.0 | 3.8 | 4.0 | 2.2 |
| D/E | 0.03 | 0.002 | 0.001 | 0.08 | 0.07 |
| Debt-to-Assets | 2% | 0.2% | 0.1% | 6% | 5% |
| Interest Coverage | 0 | -640 | 0 | -12 | -42 |
| Asset Turnover | 0 | 0 | 0.02 | 0.07 | 0.15 |
| Fixed Asset Turnover | 0 | 0 | 0.03 | 0.08 | 0.20 |
| Dividend Yield | 0% | 0% | 0% | 0% | 0% |
Evolution of Financial Ratios
Over the analyzed period, enCore Energy Corp. experienced a consistent decline in Return on Equity (ROE), with a notable drop to -21.49% in 2024, indicating deteriorating profitability. The Current Ratio showed fluctuations but remained above 2.9 in 2024, suggesting stable liquidity. The Debt-to-Equity Ratio stayed low around 0.07, reflecting limited leverage and cautious debt management throughout the years.
Are the Financial Ratios Fovorable?
In 2024, profitability ratios such as net margin (-105.24%) and ROE (-21.49%) were unfavorable, underscoring ongoing losses. Liquidity ratios, including the current ratio (2.91) and quick ratio (2.21), were favorable, indicating solid short-term financial health. Leverage ratios, like debt-to-equity (0.07) and debt-to-assets (5.2%), were also favorable, pointing to low financial risk. However, efficiency measures such as asset turnover (0.15) and interest coverage (-41.61) were unfavorable, contributing to an overall unfavorable financial profile.
Shareholder Return Policy
enCore Energy Corp. does not pay dividends, reflecting its negative net income and ongoing reinvestment efforts. The company’s focus appears to be on funding operations and growth, supported by a stable current ratio and minimal debt levels, without engaging in share buybacks.
This absence of direct shareholder distributions aligns with a strategy to enhance long-term value through operational improvements rather than immediate returns. The policy supports sustainable growth, though investors should monitor financial performance as the firm advances its development objectives.
Score analysis
The radar chart below presents a comprehensive view of enCore Energy Corp.’s key financial scores across several valuation and profitability metrics:
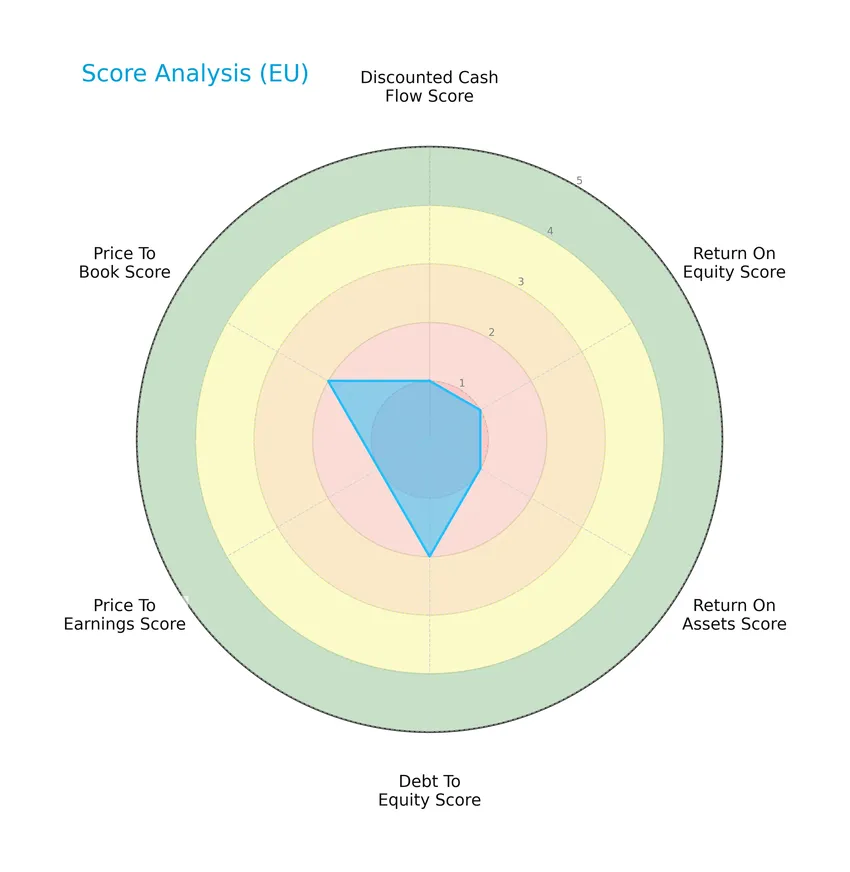
The company shows very unfavorable scores for discounted cash flow, return on equity, return on assets, and price-to-earnings, indicating weak profitability and valuation metrics. Debt-to-equity and price-to-book ratios are moderately rated, reflecting some balance in leverage and market valuation.
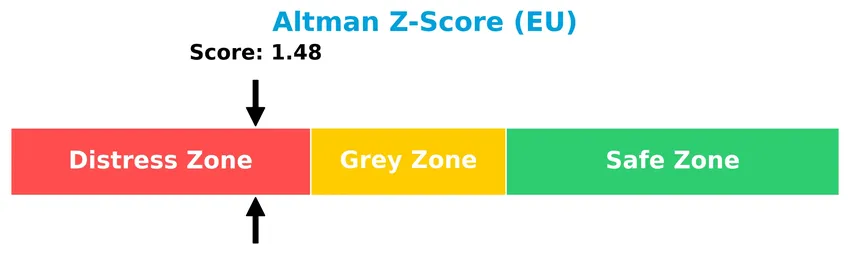
Analysis of the company’s bankruptcy risk
enCore Energy Corp. currently falls within the distress zone according to its Altman Z-Score, signaling a high risk of financial distress and potential bankruptcy:
Is the company in good financial health?
The Piotroski Score diagram below illustrates the company’s moderate financial strength based on nine accounting criteria:
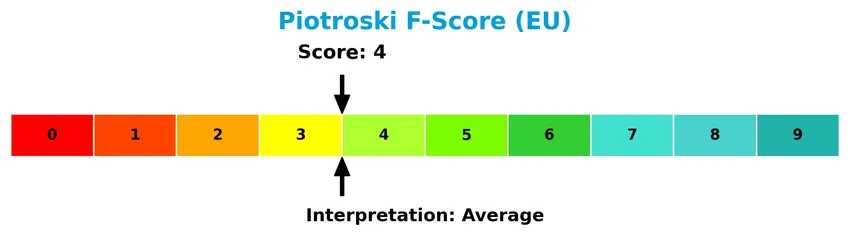
With a Piotroski Score of 4, enCore Energy Corp. demonstrates average financial health, suggesting it neither strongly qualifies for value investment nor presents significant strength in its financial fundamentals.
Competitive Landscape & Sector Positioning
This section provides an overview of enCore Energy Corp.’s sector dynamics, including strategic positioning, revenue segments, and key competitors. I will assess whether the company holds a competitive advantage within its uranium industry peers.
Strategic Positioning
enCore Energy Corp. concentrates its portfolio exclusively on uranium resource properties within the United States, holding multiple project interests primarily in New Mexico, Utah, South Dakota, and Wyoming. The company’s strategy focuses on extensive land positions in key uranium districts, maintaining geographic concentration within the US energy sector.
Key Products & Brands
The table below outlines the primary uranium projects and property interests held by enCore Energy Corp.:
| Product | Description |
|---|---|
| Crownpoint and Hosta Butte | 3,020 acres in the Grants Uranium Belt, New Mexico, held 100% by enCore Energy. |
| Marquez-Juan Tafoya | 14,582 acres in McKinley and Sandoval counties, New Mexico. |
| Nose Rock | Approximately 800 acres comprising 42 owned unpatented lode mining claims in McKinley County, New Mexico. |
| White Canyon District & Utah | Includes Geitus, Blue Jay, Marcy Look, and Cedar Mountain projects near the White Mesa Mill in Blanding County, Utah. |
| Dewey Burdock | About 12,613 surface acres and 16,962 net mineral acres in South Dakota, held 100%. |
| Gas Hills | Approximately 1,280 surface acres and 12,960 net mineral acres of unpatented lode mining claims in Wyoming. |
| West Largo | Around 3,840 acres in McKinley County, New Mexico. |
| Ambrosia Lake – Treeline | Deeded mineral rights totaling 24,555 acres plus about 1,700 acres of unpatented mining claims. |
| Checkerboard mineral rights | Land position of approximately 300,000 acres in the Grants Uranium District. |
enCore Energy Corp. specializes in uranium resource acquisition and development across multiple sizeable property holdings in New Mexico, Utah, South Dakota, and Wyoming, emphasizing a diversified uranium asset base in key U.S. mining districts.
Main Competitors
There are 10 main competitors in the Uranium industry; below are the top 10 leaders by market capitalization:
| Competitor | Market Cap. |
|---|---|
| Cameco Corporation | 39.8B |
| NexGen Energy Ltd. | 6.0B |
| Uranium Energy Corp. | 5.6B |
| Centrus Energy Corp. | 4.2B |
| Energy Fuels Inc. | 3.5B |
| Denison Mines Corp. | 2.4B |
| Ur-Energy Inc. | 507M |
| IsoEnergy Ltd. | 499M |
| Uranium Royalty Corp. | 471M |
| enCore Energy Corp. | 464M |
enCore Energy Corp. ranks 10th among its peers with a market cap representing about 1.55% of Cameco Corporation, the sector leader. The company is below both the average market cap of the top 10 competitors (6.35B) and the sector median (2.92B). It trails its closest competitor above by approximately 23.5%, indicating a notable gap to bridge within this competitive landscape.
Does enCore Energy Corp. have a competitive advantage?
enCore Energy Corp. does not present a competitive advantage as it is currently shedding value, with a ROIC significantly below its WACC and a sharply declining ROIC trend, indicating worsening profitability. The company’s income statement is largely unfavorable, reflecting challenges in generating sustainable profits despite recent revenue growth.
Looking ahead, enCore holds a diverse portfolio of uranium resource properties across key U.S. mining districts, covering extensive acreage in New Mexico, Utah, South Dakota, and Wyoming. This land position may offer opportunities for resource development and market expansion in the uranium industry, although the company’s current financial metrics suggest caution regarding value creation.
Comparisons with competitors
Check out how we compare the company to its competitors:
SWOT Analysis
This analysis highlights enCore Energy Corp.’s key internal and external factors to guide investment decisions.
Strengths
- Strong land portfolio with 300K acres in uranium-rich regions
- Low debt level with debt-to-equity at 0.07
- Favorable liquidity ratios (current ratio 2.91, quick ratio 2.21)
Weaknesses
- Negative profitability with net margin -105%
- Declining ROIC and value destruction
- Operating losses and unfavorable income growth trends
Opportunities
- Rising uranium demand driven by clean energy transition
- Exploration potential in multiple US uranium projects
- Ability to capitalize on uranium price volatility
Threats
- Regulatory risks in uranium mining industry
- Volatile commodity prices impacting revenue
- Financial distress risk indicated by Altman Z-Score in distress zone
Overall, enCore Energy shows strong asset positions and liquidity but suffers from significant profitability challenges and financial risk. Investors should weigh growth potential in uranium markets against operational and financial weaknesses. Caution and risk management are essential in considering this stock.
Stock Price Action Analysis
The weekly stock chart of enCore Energy Corp. (ticker: EU) highlights recent price fluctuations and trend developments over the past 12 months:
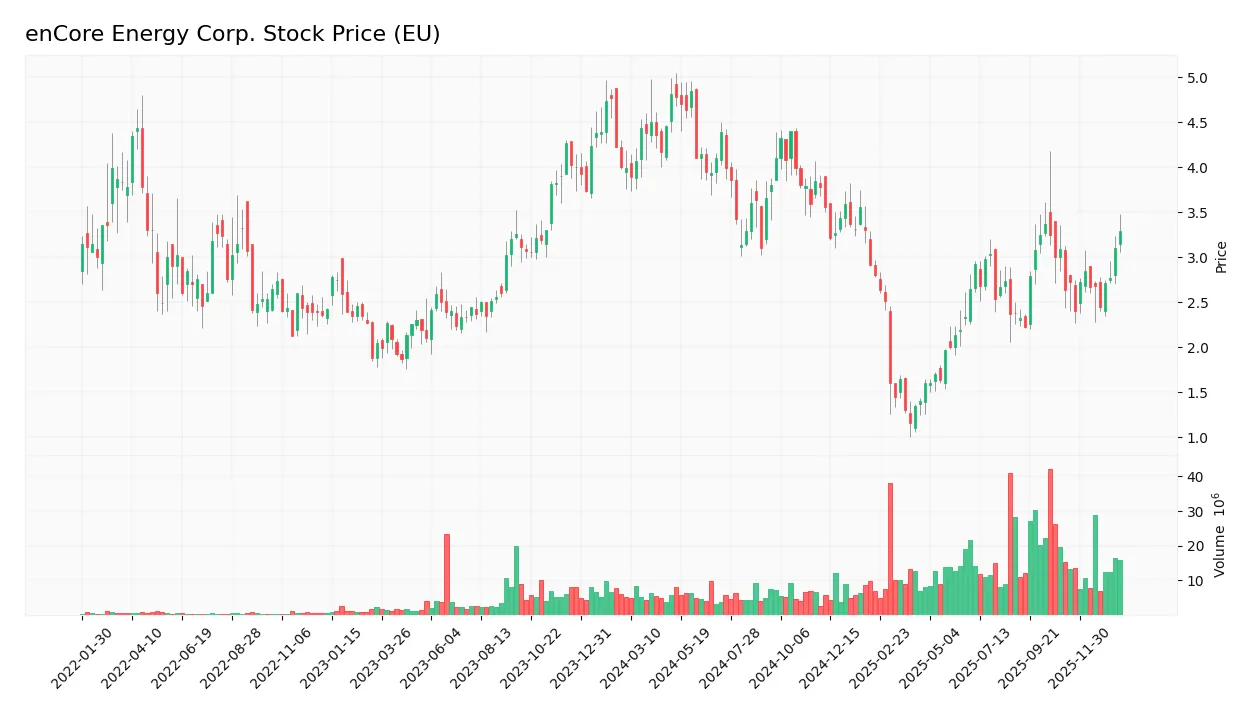
Trend Analysis
Over the past 12 months, EU’s stock price declined by 17.54%, indicating a bearish trend with accelerating downward momentum. The price ranged between a high of 4.85 and a low of 1.16, exhibiting moderate volatility with a standard deviation of 0.91.
Volume Analysis
Trading volume has increased recently, with a total volume of 1.19B shares, where buyers accounted for 56.7%. In the last three months, buyer dominance strengthened to 72.83%, reflecting strongly buyer-driven activity and heightened investor participation.
Target Prices
The consensus target price for enCore Energy Corp. stands firmly at $3.5.
| Target High | Target Low | Consensus |
|---|---|---|
| 3.5 | 3.5 | 3.5 |
Analysts uniformly expect the stock to reach $3.5, indicating a clear, steady outlook for enCore Energy Corp.
Analyst & Consumer Opinions
This section examines the latest analyst ratings and consumer feedback related to enCore Energy Corp. (ticker: EU).

Don’t Let Luck Decide Your Entry Point
Optimize your entry points with our advanced ProRealTime indicators. You’ll get efficient buy signals with precise price targets for maximum performance. Start outperforming now!
Stock Grades
The following table presents recent reliable stock grades for enCore Energy Corp. from recognized analysts:
| Grading Company | Action | New Grade | Date |
|---|---|---|---|
| HC Wainwright & Co. | Maintain | Buy | 2025-08-12 |
| HC Wainwright & Co. | Maintain | Buy | 2025-05-13 |
| HC Wainwright & Co. | Maintain | Buy | 2025-03-18 |
| HC Wainwright & Co. | Maintain | Buy | 2024-11-19 |
| HC Wainwright & Co. | Maintain | Buy | 2024-10-07 |
| HC Wainwright & Co. | Maintain | Buy | 2024-08-15 |
| HC Wainwright & Co. | Maintain | Buy | 2024-06-14 |
| B. Riley Securities | Maintain | Buy | 2024-05-15 |
The consensus across these ratings consistently favors a Buy stance, with no revisions toward Hold or Sell. This steady outlook suggests confidence in the company’s prospects over the recent two-year period.
Consumer Opinions
Consumer sentiment about enCore Energy Corp. (ticker: EU) reflects a mix of optimism and caution as investors weigh the company’s growth potential against operational challenges.
| Positive Reviews | Negative Reviews |
|---|---|
| Strong potential in uranium energy sector positioning. | Concerns over fluctuating uranium market prices. |
| Transparent communication from management. | Production delays impacting short-term results. |
| Commitment to sustainable and clean energy solutions. | Limited diversification outside uranium mining. |
Overall, consumers appreciate enCore Energy’s clear focus on sustainable uranium production and management transparency, but they remain cautious due to market volatility and operational setbacks.
Risk Analysis
Below is a table outlining key risks for enCore Energy Corp., highlighting their likelihood and potential impact on the company’s performance:
| Category | Description | Probability | Impact |
|---|---|---|---|
| Financial Health | Negative net margin (-105.24%) and low profitability metrics indicate ongoing financial distress. | High | High |
| Bankruptcy Risk | Altman Z-Score of 1.48 places the company in the distress zone, signaling a high bankruptcy risk. | High | High |
| Market Volatility | Beta of 1.44 suggests above-average stock price volatility, increasing investment risk. | Medium | Medium |
| Operational Risks | Dependence on uranium exploration with exposure to regulatory and commodity price fluctuations. | Medium | High |
| Liquidity Risk | Despite favorable current (2.91) and quick ratios (2.21), weak interest coverage (-41.61) raises concerns. | Medium | Medium |
| Dividend Policy | No dividend payments, limiting income potential for investors. | High | Low |
The most critical risks are financial instability and bankruptcy potential, as highlighted by poor profitability and a distress-zone Altman Z-Score. Market volatility and operational exposure to uranium prices further amplify uncertainty. Caution and risk management are essential when considering this stock.
Should You Buy enCore Energy Corp.?
enCore Energy Corp. appears to be in financial distress with a deteriorating profitability profile and a very unfavorable competitive moat marked by declining ROIC. Despite a moderate leverage profile, its overall rating of C- suggests significant challenges in value creation and operational efficiency.
Strength & Efficiency Pillars
enCore Energy Corp. displays a mixed financial profile with pockets of resilience in liquidity and leverage metrics. The company’s current ratio stands at a healthy 2.91, supported by a quick ratio of 2.21, suggesting strong short-term financial health. Its debt-to-equity ratio is remarkably low at 0.07, indicating minimal reliance on debt financing. However, profitability is a significant concern: with a negative net margin of -105.24%, ROE at -21.49%, and ROIC at -17.34%, the company is far from value creation—the ROIC is well below the WACC of 10.57%, confirming that enCore is currently destroying value. The Altman Z-Score of 1.48 places it in the distress zone, while the Piotroski score of 4 reflects average financial strength.
Weaknesses and Drawbacks
enCore Energy’s profitability challenges are compounded by unfavorable valuation and operational metrics. Despite a seemingly attractive negative P/E ratio of -10.11, this signals losses rather than value, and the price-to-book ratio of 2.17 suggests moderate valuation risk. The company’s gross margin of -12.35% and EBIT margin of -123.75% highlight persistent earnings pressure. The interest coverage ratio is deeply negative at -41.61, indicating difficulties in covering interest expenses from operating income. Operational efficiency also lags, with asset turnover of 0.15 and fixed asset turnover of 0.2, reflecting underutilization of assets. Market trends are bearish overall, with a 17.54% price decline, although recent buyer dominance at 72.83% and increased volume offer some short-term optimism.
Our Verdict about enCore Energy Corp.
The long-term fundamental profile of enCore Energy appears unfavorable due to sustained negative profitability and value destruction. However, recent market behavior shows strongly buyer-dominant activity and an accelerating price trend, which may suggest emerging interest. Despite this, the prevailing bearish trend and weak financial metrics imply that enCore Energy might appear speculative and high-risk. Investors could consider a cautious wait-and-see approach until fundamentals improve or more consistent positive technical signals emerge.
Disclaimer: This content is for informational purposes only and does not constitute financial, investment, or other professional advice. Investing in financial markets involves a significant risk of loss, and past performance is not indicative of future results.
Additional Resources
- enCore Energy Corp. (CVE:EU): Are Analysts Optimistic? – Yahoo Finance (Jan 19, 2026)
- enCore Energy Corp. Hosts Corporate Update – PR Newswire (Aug 25, 2025)
- enCore Energy (EU) Price Target Increased by 12.12% to 3.34 – Nasdaq (Jan 14, 2026)
- enCore Energy Reports Q3 2025 Financial Results; Uranium Extraction Advances in South Texas – PR Newswire (Nov 10, 2025)
- Does enCore Energy (EU) Offer a Good Investment Opportunity Amid a Renewed Interest in Nuclear? – Yahoo Finance (Oct 11, 2025)
For more information about enCore Energy Corp., please visit the official website: encoreuranium.com