Home > Analyses > Industrials > Emerson Electric Co.
Emerson Electric Co. transforms industries and everyday environments through cutting-edge technology and engineering solutions. As a powerhouse in industrial machinery, Emerson leads with innovative automation systems and advanced commercial and residential climate control products. Renowned for quality and market influence across global sectors, the company continuously adapts to evolving demands. As we analyze Emerson’s current fundamentals, the key question remains: does its robust legacy and innovation pipeline still justify its market valuation and growth prospects?

Table of contents
Business Model & Company Overview
Emerson Electric Co., founded in 1890 and headquartered in Saint Louis, Missouri, stands as a leading technology and engineering firm in the industrial machinery sector. Its core mission revolves around delivering an integrated ecosystem of automation and commercial solutions that serve diverse markets, including oil and gas, life sciences, and residential climate control. This breadth of offerings positions Emerson as a pivotal player in advancing industrial and commercial efficiency worldwide.
The company’s revenue engine balances robust hardware manufacturing with sophisticated software and recurring services. Its Automation Solutions segment provides critical instrumentation and control systems, while Commercial & Residential Solutions offers HVAC components and energy management technologies. Emerson’s strategic footprint spans the Americas, Europe, Asia, and beyond, enabling it to capitalize on global industrial demand. This extensive presence and diverse portfolio create a formidable economic moat, securing its role in shaping the future of industrial automation and environmental control.
Financial Performance & Fundamental Metrics
In this section, I will analyze Emerson Electric Co.’s income statement, key financial ratios, and dividend payout policy to assess its financial health and investment potential.
Income Statement
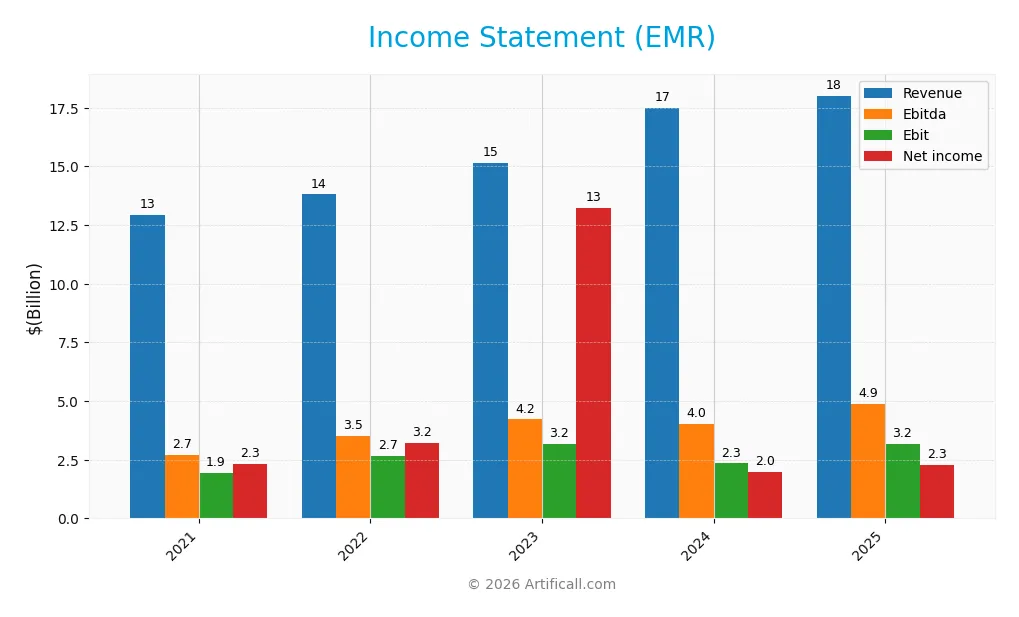
The table below summarizes key financial figures for Emerson Electric Co. (EMR) over the last five fiscal years, providing a clear view of the company’s revenue, expenses, and profitability metrics.
| 2021 | 2022 | 2023 | 2024 | 2025 | |
|---|---|---|---|---|---|
| Revenue | 12.9B | 13.8B | 15.2B | 17.5B | 18.0B |
| Cost of Revenue | 7.2B | 7.5B | 7.7B | 8.6B | 8.5B |
| Operating Expenses | 3.8B | 4.0B | 4.7B | 6.2B | 7.3B |
| Gross Profit | 5.7B | 6.3B | 7.4B | 8.9B | 9.5B |
| EBITDA | 2.7B | 3.5B | 4.2B | 4.0B | 4.9B |
| EBIT | 1.9B | 2.7B | 3.2B | 2.3B | 3.2B |
| Interest Expense | 166M | 228M | 261M | 323M | 237M |
| Net Income | 2.3B | 3.2B | 13.2B | 2.0B | 2.3B |
| EPS | 3.85 | 4.63 | 3.75 | 3.44 | 4.06 |
| Filing Date | 2021-11-15 | 2022-11-14 | 2023-11-13 | 2024-11-12 | 2025-11-10 |
Income Statement Evolution
Between 2021 and 2025, Emerson Electric Co. showed a steady revenue increase of 39.3%, reaching $18.0B in 2025. However, net income experienced a slight decline of 0.4% over the same period, with notable volatility due to discontinued operations in 2023. Margins improved overall, with gross margin at 52.8% and net margin at 12.7%, indicating enhanced profitability despite mixed net income trends.
Is the Income Statement Favorable?
The 2025 fiscal year reflects generally favorable fundamentals. Revenue grew by 3% year-on-year, while gross profit rose 7.1%, supported by improved operational efficiency. EBIT expanded sharply by 35.3%, and net margin increased by 13.1%, resulting in an EPS growth of 17.8%. Interest expense remains manageable at 1.3% of revenue, contributing positively to the overall income statement quality, which is rated favorable for investors.
Financial Ratios
The table below presents key financial ratios for Emerson Electric Co. (EMR) over the fiscal years 2021 to 2025, illustrating profitability, valuation, liquidity, leverage, and efficiency metrics:
| Ratios | 2021 | 2022 | 2023 | 2024 | 2025 |
|---|---|---|---|---|---|
| Net Margin | 18% | 23% | 87% | 11% | 13% |
| ROE | 23% | 31% | 64% | 9% | 11% |
| ROIC | 8% | 6% | 6% | 5% | 5% |
| P/E | 24.5 | 13.4 | 4.2 | 31.7 | 32.4 |
| P/B | 5.7 | 4.2 | 2.7 | 2.9 | 3.7 |
| Current Ratio | 1.35 | 1.09 | 2.75 | 1.77 | 0.88 |
| Quick Ratio | 1.02 | 0.87 | 2.35 | 1.39 | 0.65 |
| D/E | 0.72 | 1.03 | 0.41 | 0.39 | 0.68 |
| Debt-to-Assets | 29% | 30% | 20% | 19% | 33% |
| Interest Coverage | 11.8 | 10.3 | 10.6 | 8.3 | 9.4 |
| Asset Turnover | 0.52 | 0.39 | 0.35 | 0.40 | 0.43 |
| Fixed Asset Turnover | 3.46 | 6.17 | 6.42 | 5.00 | 5.14 |
| Dividend Yield | 2.1% | 2.8% | 2.2% | 1.9% | 1.6% |
Evolution of Financial Ratios
Over the period from 2021 to 2025, Emerson Electric Co.’s Return on Equity (ROE) declined from 23.3% in 2021 to 11.3% in 2025, signaling a slowdown in profitability growth. The Current Ratio dropped significantly from 1.35 in 2021 to 0.88 in 2025, indicating reduced short-term liquidity. Meanwhile, the Debt-to-Equity Ratio remained relatively stable around 0.68 in 2025, reflecting consistent leverage levels.
Are the Financial Ratios Favorable?
In 2025, Emerson Electric shows a favorable net profit margin of 12.7% and strong interest coverage at 13.4, suggesting solid profitability and debt servicing ability. However, liquidity ratios like Current Ratio (0.88) and Quick Ratio (0.65) are unfavorable, indicating potential short-term financial strain. Market valuation multiples such as P/E (32.4) and P/B (3.67) are also unfavorable. Overall, the ratios present a slightly unfavorable financial profile.
Shareholder Return Policy
Emerson Electric Co. maintains a consistent dividend policy with a payout ratio near 52% in 2025 and a dividend yield around 1.6%. Dividend payments are well-covered by free cash flow, supported by stable operating margins and moderate leverage. The company also engages in share buybacks, reinforcing capital return to shareholders.
This balanced approach of dividends and buybacks suggests a focus on sustainable shareholder value creation. Coverage ratios indicate distributions are supported by cash generation, mitigating risks of excessive payouts or leverage, which aligns with prudent long-term financial management.
Score analysis
The radar chart below presents a comprehensive overview of Emerson Electric Co.’s key financial scores, highlighting strengths and areas for caution:
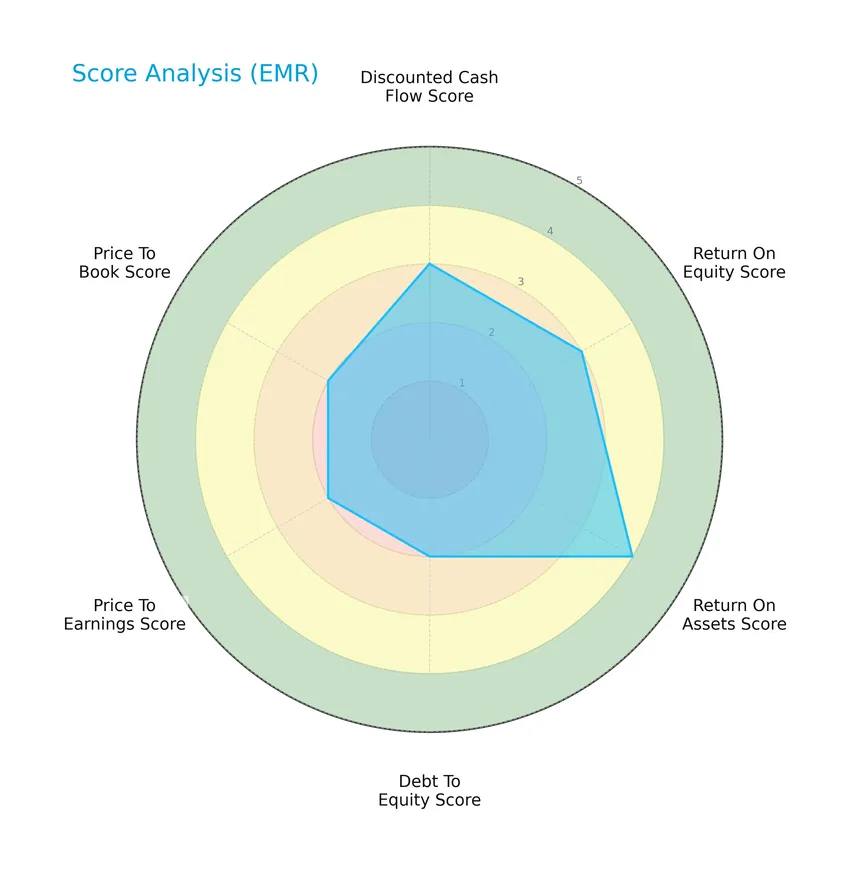
Emerson Electric Co. shows moderate discounted cash flow and return on equity scores at 3 each, with a favorable return on assets score of 4. Debt to equity, price to earnings, and price to book ratios are moderately rated at 2, indicating balanced but cautious financial metrics.
Analysis of the company’s bankruptcy risk
The Altman Z-Score indicates that Emerson Electric Co. is in the safe zone, reflecting low bankruptcy risk and solid financial stability:

Is the company in good financial health?
The Piotroski Score diagram provides insight into Emerson Electric Co.’s financial strength and operational efficiency:

With a Piotroski Score of 7, Emerson Electric Co. demonstrates strong financial health, suggesting effective management and robust fundamentals that support its investment potential.
Competitive Landscape & Sector Positioning
This sector analysis will explore Emerson Electric Co.’s strategic positioning, revenue breakdown, key products, and main competitors. I will assess whether Emerson holds a competitive advantage over its industry peers.
Strategic Positioning
Emerson Electric Co. maintains a diversified product portfolio with significant revenue from Intelligent Devices ($12.4B) and Software and Control ($5.7B) in 2025. Geographically, the company operates globally, generating $9.2B in the Americas, $5.4B in Asia, Middle East & Africa, and $3.4B in Europe, reflecting broad industrial and commercial market exposure.
Revenue by Segment
This pie chart illustrates Emerson Electric Co.’s revenue distribution by segment for the fiscal year 2025, highlighting the company’s latest business focus.
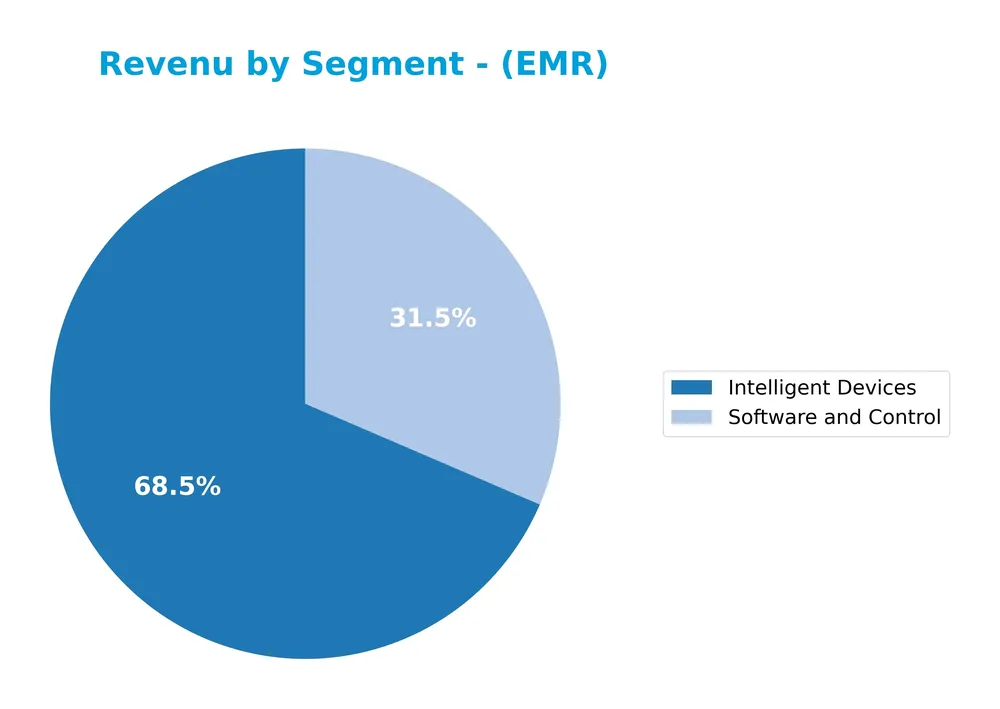
In 2025, Emerson’s revenue was mainly driven by Intelligent Devices at $12.4B and Software and Control at $5.7B, showing steady growth compared to prior years. The shift from earlier segments like Automation Solutions to Intelligent Devices and Software reflects a strategic pivot towards technology-driven solutions. This concentration suggests a focus on innovation, although it may increase exposure to sector-specific risks.
Key Products & Brands
The table below presents Emerson Electric Co.’s main products and brands with their descriptions:
| Product | Description |
|---|---|
| Intelligent Devices | Measurement and analytical instrumentation, industrial valves, and equipment for various industries. |
| Software and Control | Process control software and systems serving industrial automation needs. |
| Automation Solutions | Solutions for oil and gas, refining, chemicals, power generation, life sciences, food and beverage, and more. |
| Commercial & Residential Solutions | Residential and commercial HVAC products, including compressors, thermostats, sensors, and environmental control systems. |
| Climate Technologies | Heating, air conditioning, refrigeration, and lighting control technologies for commercial and residential use. |
| Tools & Home Products | Tools for professionals and homeowners, along with appliance solutions. |
| AspenTech | Specialized software for industrial process optimization and management. |
Emerson Electric Co. operates through segments focused on automation and commercial/residential markets, offering diverse products from intelligent devices and software to HVAC and professional tools. These products serve broad industrial and consumer applications globally.
Main Competitors
There are 24 competitors in the Industrials sector, with the table below listing the top 10 leaders by market capitalization:
| Competitor | Market Cap. |
|---|---|
| Eaton Corporation plc | 127.1B |
| Parker-Hannifin Corporation | 114.2B |
| Howmet Aerospace Inc. | 85.2B |
| Emerson Electric Co. | 76.3B |
| Illinois Tool Works Inc. | 73.0B |
| Cummins Inc. | 71.9B |
| AMETEK, Inc. | 48.3B |
| Roper Technologies, Inc. | 46.8B |
| Rockwell Automation, Inc. | 44.8B |
| Symbotic Inc. | 35.9B |
Emerson Electric Co. ranks 4th among 24 competitors, with a market cap approximately 65% that of the top leader, Eaton Corporation plc. It stands above both the average market cap of the top 10 competitors (72.4B) and the median market cap in the sector (32.4B). Emerson is closely positioned with a 2.62% gap to Parker-Hannifin Corporation, its nearest competitor above.
Comparisons with competitors
Check out how we compare the company to its competitors:
Does EMR have a competitive advantage?
Emerson Electric Co. currently does not present a competitive advantage, as its return on invested capital (ROIC) is below its weighted average cost of capital (WACC), indicating value destruction with a declining profitability trend. The company’s ROIC trend over 2021-2025 is very unfavorable, reflecting inefficient use of invested capital and diminishing returns.
Looking ahead, Emerson’s broad presence across diverse geographic markets and its operation in industrial automation and commercial & residential solutions segments may offer opportunities for expansion. Continued innovation in measurement instrumentation, process control software, and environmental control systems could support future growth in evolving industrial and residential markets.
SWOT Analysis
This SWOT analysis highlights key internal and external factors that affect Emerson Electric Co.’s strategic positioning and investment potential.
Strengths
- Diversified global presence across Americas, Asia, Europe
- Strong gross margin at 52.84%
- Favorable EBIT margin and net margin growth
Weaknesses
- Declining ROIC indicating value destruction
- Unfavorable liquidity ratios (current and quick ratios below 1)
- High P/E and P/B ratios suggest overvaluation risk
Opportunities
- Growth potential in emerging markets like Asia and Middle East
- Expansion of automation and energy-efficient solutions
- Increasing demand in industrial and residential sectors
Threats
- Economic slowdown affecting industrial capital expenditures
- Intense competition in machinery and automation sectors
- Supply chain and raw material cost volatility
Emerson Electric Co. demonstrates solid profitability and global reach, but faces challenges in capital efficiency and liquidity. Strategic focus on innovation and emerging markets is crucial to offset competitive and macroeconomic risks.
Stock Price Action Analysis
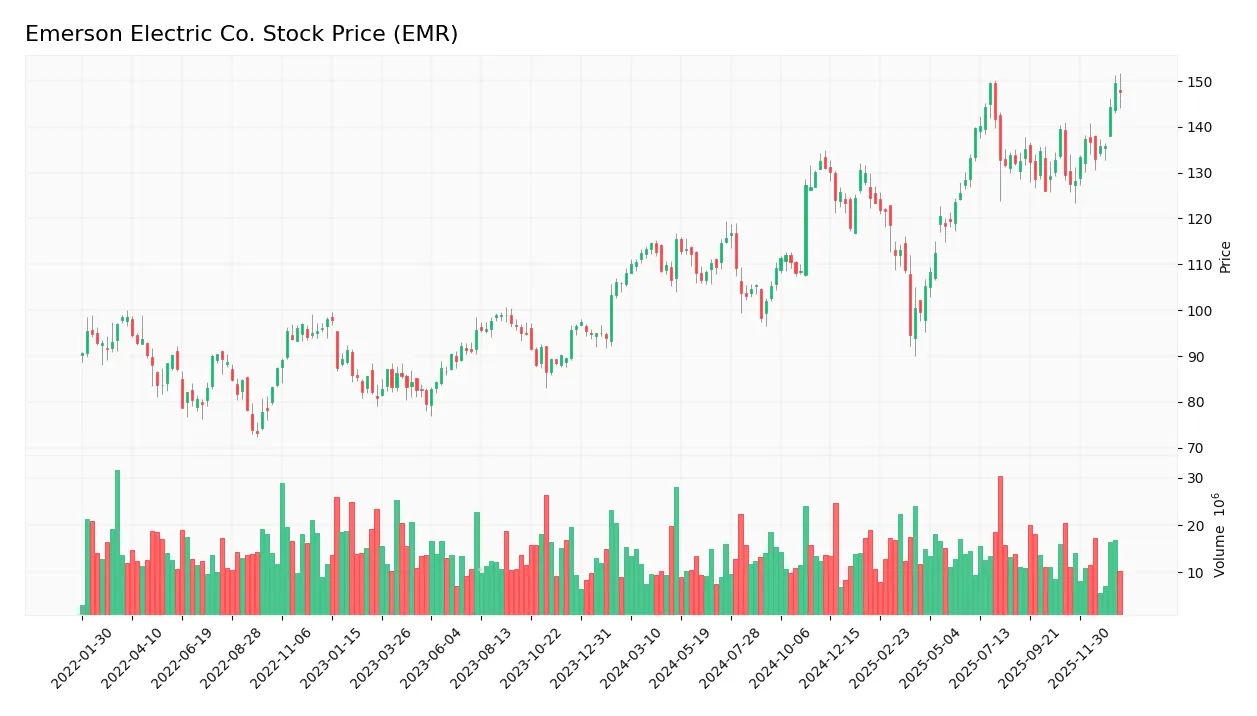
The following weekly chart illustrates Emerson Electric Co. (EMR) stock price movements over the past 12 months, highlighting key highs and lows:
Trend Analysis
Over the past 12 months, EMR’s stock price increased by 36.56%, indicating a bullish trend with clear acceleration. The price ranged from a low of 94.57 to a high of 149.63, supported by a volatility level reflected in a standard deviation of 12.85. Recent weeks show a 14.05% gain with a slope of 1.79, confirming continued upward momentum.
Volume Analysis
Trading volume has been increasing, with a total of 1.67B shares exchanged over the last year. Buyer volume accounted for 54.88%, signaling buyer-driven activity. In the recent 11-week period, buyer dominance slightly declined to 52.74%, indicating more neutral buyer behavior but sustained market participation and engagement.
Target Prices
Analysts present a clear target consensus for Emerson Electric Co. based on recent evaluations.
| Target High | Target Low | Consensus |
|---|---|---|
| 170 | 125 | 149.67 |
The target prices suggest moderate upside potential, with a consensus near $150, reflecting generally positive analyst expectations.

Don’t Let Luck Decide Your Entry Point
Optimize your entry points with our advanced ProRealTime indicators. You’ll get efficient buy signals with precise price targets for maximum performance. Start outperforming now!
Analyst & Consumer Opinions
This section examines the latest analyst ratings and consumer feedback related to Emerson Electric Co. (EMR).
Stock Grades
Here is the latest overview of Emerson Electric Co. stock grades from leading financial institutions:
| Grading Company | Action | New Grade | Date |
|---|---|---|---|
| JP Morgan | Maintain | Neutral | 2026-01-16 |
| Wells Fargo | Maintain | Equal Weight | 2026-01-07 |
| Barclays | Maintain | Equal Weight | 2026-01-07 |
| UBS | Upgrade | Buy | 2026-01-05 |
| Jefferies | Downgrade | Hold | 2025-12-10 |
| JP Morgan | Maintain | Neutral | 2025-11-10 |
| RBC Capital | Maintain | Outperform | 2025-11-06 |
| Barclays | Maintain | Equal Weight | 2025-11-06 |
| RBC Capital | Maintain | Outperform | 2025-10-16 |
| JP Morgan | Maintain | Neutral | 2025-10-15 |
The current ratings show a predominance of neutral and equal weight grades, with UBS recently upgrading to buy, while Jefferies downgraded to hold. The consensus remains positive, reflecting a general buy sentiment among analysts.
Consumer Opinions
Consumer sentiment towards Emerson Electric Co. (EMR) reflects a mix of appreciation for product reliability and concerns over customer service responsiveness.
| Positive Reviews | Negative Reviews |
|---|---|
| “Emerson’s products are incredibly durable and efficient.” | “Customer support is slow to respond to issues.” |
| “Great innovation in their automation solutions.” | “Pricing feels a bit high compared to competitors.” |
| “Consistently reliable performance in industrial applications.” | “Occasional delays in product delivery.” |
Overall, consumers praise Emerson for its robust and innovative products, especially in industrial sectors, but often cite slower customer service and pricing as areas for improvement.
Risk Analysis
Below is a table summarizing key risks associated with Emerson Electric Co. (EMR), highlighting their likelihood and potential impact on investment:
| Category | Description | Probability | Impact |
|---|---|---|---|
| Market Valuation | High P/E (32.42) and P/B (3.67) ratios may indicate overvaluation risk amid market corrections. | Medium | High |
| Liquidity | Current ratio (0.88) and quick ratio (0.65) below 1 suggest potential short-term liquidity issues. | Medium | Medium |
| Operational Efficiency | Low ROIC (4.6%) and asset turnover (0.43) reflect suboptimal capital utilization. | Medium | Medium |
| Economic Cyclicality | Exposure to industrial and machinery sectors makes EMR vulnerable to economic downturns. | High | High |
| Debt Levels | Moderate debt-to-assets ratio (32.79%) and debt-to-equity score indicate manageable leverage. | Low | Medium |
| Dividend Yield | Modest dividend yield (1.6%) may limit appeal to income-focused investors during volatility. | Low | Low |
The most critical risks are Emerson’s exposure to cyclical industrial markets and its high valuation multiples, which could amplify losses in an economic slowdown or market pullback. Liquidity constraints also warrant attention given current ratios below 1. However, a strong Altman Z-Score (4.26, safe zone) and a robust Piotroski score (7, strong) reflect overall financial stability despite these challenges.
Should You Buy Emerson Electric Co.?
Emerson Electric Co. appears to be a company with moderate profitability and operational efficiency challenges, reflected in a deteriorating competitive moat and a leverage profile that could be seen as manageable but cautious. Supported by a B rating and solid financial health scores, the investment case suggests moderate value creation amid structural headwinds.
Strength & Efficiency Pillars
Emerson Electric Co. demonstrates solid profitability metrics, including a net margin of 12.73% and an EBIT margin of 17.6%, underscoring operational efficiency. The Altman Z-score of 4.26 places the company securely in the safe zone, indicating low bankruptcy risk, while the Piotroski score of 7 reflects strong financial health. Although the return on equity stands at a moderate 11.31%, the company’s interest coverage ratio of 13.38 provides comfort regarding its ability to service debt. Despite a ROIC of 4.6% trailing the WACC of 8.9%, suggesting the company is currently not a value creator, overall financial stability remains intact.
Weaknesses and Drawbacks
However, several valuation and liquidity concerns temper the investment case. Emerson’s price-to-earnings ratio at 32.42 and price-to-book ratio of 3.67 indicate a premium valuation, potentially limiting upside. The company’s current ratio is 0.88, signaling liquidity constraints and potential short-term financial stress. Additionally, asset turnover at 0.43 is unfavorable, implying less efficient use of assets. While debt-to-equity is moderate at 0.68, these factors, combined with a mixed revenue growth profile (3.0% decline in recent period), suggest caution amid market pressures and operational challenges.
Our Verdict about Emerson Electric Co.
Emerson Electric Co. presents a fundamentally favorable long-term profile supported by strong profitability and financial health metrics. The bullish overall stock trend, coupled with neutral recent buyer behavior, suggests the stock might appear attractive for long-term exposure. However, valuation premiums and liquidity concerns could imply a measured approach to entry, especially given the company’s current inability to generate returns above its cost of capital. Investors might consider monitoring for improved operational efficiency and valuation adjustment.
Disclaimer: This content is for informational purposes only and does not constitute financial, investment, or other professional advice. Investing in financial markets involves a significant risk of loss, and past performance is not indicative of future results.
Additional Resources
- With 82% ownership of the shares, Emerson Electric Co. (NYSE:EMR) is heavily dominated by institutional owners – Yahoo Finance (Jan 24, 2026)
- Y Intercept Hong Kong Ltd Invests $14.90 Million in Emerson Electric Co. $EMR – MarketBeat (Jan 24, 2026)
- Strs Ohio Raises Stock Holdings in Emerson Electric Co. $EMR – MarketBeat (Jan 24, 2026)
- What’s Driving the Market Sentiment Around Emerson Electric Co? – Benzinga (Jan 23, 2026)
- Why Emerson Electric (EMR) Dipped More Than Broader Market Today – Nasdaq (Jan 20, 2026)
For more information about Emerson Electric Co., please visit the official website: emerson.com