Home > Analyses > Industrials > EMCOR Group, Inc.
EMCOR Group, Inc. powers the backbone of modern infrastructure with its comprehensive electrical and mechanical construction services. Its footprint spans critical sectors like energy, industrial processing, and government facilities, where reliability and innovation matter most. Known for integrating cutting-edge solutions with hands-on expertise, EMCOR shapes how buildings and industries operate daily. As 2026 unfolds, investors must ask: does EMCOR’s robust service portfolio still justify its premium market valuation and growth prospects?

Table of contents
Business Model & Company Overview
EMCOR Group, Inc., founded in 1987 and headquartered in Norwalk, CT, stands as a leader in the Engineering & Construction sector. It delivers a comprehensive ecosystem of electrical, mechanical, and facilities services. The company’s core mission integrates design, installation, and maintenance across power systems, HVAC, fire protection, and industrial services, creating a seamless infrastructure solution for commercial, government, and industrial clients.
EMCOR’s revenue engine balances project-based construction with recurring facilities management and maintenance contracts. It operates primarily in the US and UK, with strategic footprints supporting energy, petrochemical, and infrastructure sectors globally. The company’s competitive advantage lies in its scale and diversified service portfolio, forming a robust economic moat that shapes the future of industrial infrastructure and facility services.
Financial Performance & Fundamental Metrics
I analyze EMCOR Group, Inc.’s income statement, key financial ratios, and dividend payout policy to uncover its operational strength and capital allocation efficiency.
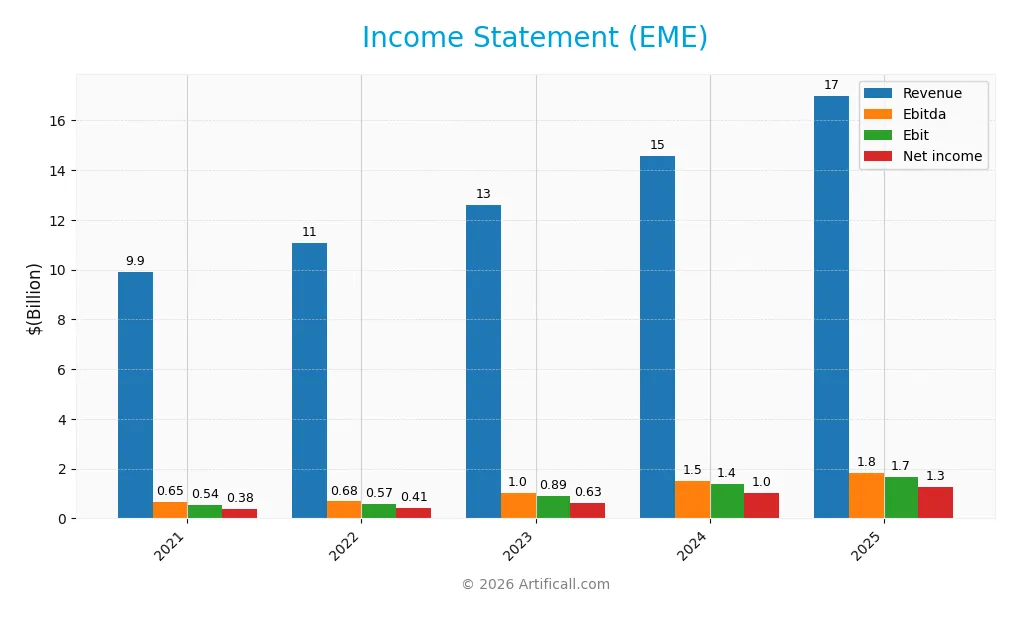
Income Statement
This table summarizes EMCOR Group, Inc.’s annual income statement items from 2021 to 2025 in USD. It highlights revenue growth and profitability trends over five fiscal years.
| 2021 | 2022 | 2023 | 2024 | 2025 | |
|---|---|---|---|---|---|
| Revenue | 9.90B | 11.08B | 12.58B | 14.57B | 17.0B |
| Cost of Revenue | 8.40B | 9.47B | 10.49B | 11.80B | 13.66B |
| Operating Expenses | 971M | 1.04B | 1.21B | 1.42B | 1.66B |
| Gross Profit | 1.50B | 1.60B | 2.09B | 2.77B | 3.33B |
| EBITDA | 648M | 681M | 1.01B | 1.51B | 1.84B |
| EBIT | 535M | 572M | 890M | 1.38B | 1.67B |
| Interest Expense | 6.07M | 13.2M | 17.2M | 3.78M | 0 |
| Net Income | 383M | 406M | 633M | 1.01B | 1.27B |
| EPS | 7.09 | 8.13 | 13.37 | 21.61 | 28.19 |
| Filing Date | 2022-02-24 | 2023-02-23 | 2024-02-28 | 2025-02-26 | 2026-02-26 |
Income Statement Evolution
EMCOR Group’s revenue rose 71.6% from 2021 to 2025, with net income surging 231%. The gross margin stabilized near 19.6%, while the EBIT margin hovered around 9.8%, showing steady operational efficiency. Net margin improved substantially, reflecting better cost control and profitable growth through the period.
Is the Income Statement Favorable?
In 2025, EMCOR reported revenue of $17B and net income of $1.27B, yielding a 7.5% net margin. EBIT grew 21% year-over-year, supported by zero interest expense and controlled operating costs. EPS surged nearly 31%, indicating strong shareholder returns. Overall, the income statement fundamentals appear favorable with robust growth and margin expansion.
Financial Ratios
The following table presents key financial ratios for EMCOR Group, Inc. (EME) over the last five fiscal years, illustrating profitability, valuation, liquidity, leverage, and efficiency metrics:
| Ratios | 2021 | 2022 | 2023 | 2024 | 2025 |
|---|---|---|---|---|---|
| Net Margin | 3.87% | 3.67% | 5.03% | 6.91% | 7.47% |
| ROE | 17.03% | 20.58% | 25.63% | 34.28% | 34.57% |
| ROIC | 12.20% | 14.39% | 20.04% | 26.97% | 25.82% |
| P/E | 17.96 | 18.21 | 16.12 | 21.01 | 21.70 |
| P/B | 3.06 | 3.75 | 4.13 | 7.20 | 7.50 |
| Current Ratio | 1.44 | 1.26 | 1.26 | 1.30 | 1.22 |
| Quick Ratio | 1.41 | 1.23 | 1.23 | 1.27 | 1.19 |
| D/E | 0.24 | 0.27 | 0.14 | 0.12 | 0.23 |
| Debt-to-Assets | 9.93% | 9.69% | 5.22% | 4.52% | 9.16% |
| Interest Coverage | 87.43 | 42.80 | 50.92 | 355.88 | 0.00 |
| Asset Turnover | 1.82 | 2.00 | 1.90 | 1.89 | 1.83 |
| Fixed Asset Turnover | 23.99 | 26.01 | 25.69 | 27.82 | 24.54 |
| Dividend Yield | 0.41% | 0.37% | 0.32% | 0.21% | 0.16% |
All figures are expressed as ratios or percentages where applicable.
Evolution of Financial Ratios
EMCOR Group’s Return on Equity (ROE) improved steadily, reaching 34.57% in 2025, signaling enhanced profitability. The Current Ratio declined from 1.44 in 2021 to 1.22 in 2025, indicating slightly reduced liquidity but remaining above 1. The Debt-to-Equity Ratio decreased overall to 0.23, reflecting a more conservative leverage profile. Profit margins improved modestly over the period.
Are the Financial Ratios Fovorable?
In 2025, profitability measures like ROE (34.57%) and ROIC (25.82%) are favorable, showing efficient capital use. Liquidity ratios are neutral to favorable, with a Current Ratio at 1.22 and Quick Ratio at 1.19. Leverage is conservative, with Debt-to-Equity at 0.23 and low debt-to-assets of 9.16%. Market valuation ratios show mixed signals: P/E at 21.7 is neutral, while a high P/B of 7.5 is unfavorable. Overall, 57% of key ratios are favorable, supporting a positive financial profile.
Shareholder Return Policy
EMCOR Group, Inc. maintains a dividend payout ratio around 3.5% to 7.3%, with dividend per share steadily increasing from $0.52 in 2021 to nearly $1.00 in 2025. The annual dividend yield remains modest at approximately 0.16% to 0.41%, supported by free cash flow coverage well above 0.88.
The company also engages in share buybacks, complementing its dividend distributions. This balanced approach indicates a cautious capital allocation strategy aimed at sustainable shareholder returns without risking excessive payouts or repurchases, which supports long-term value creation.
Score analysis
The following radar chart displays EMCOR Group, Inc.’s key financial ratios and valuation metrics for a comprehensive view:

EME scores very favorably on return on equity and assets with top marks of 5 each. Its debt-to-equity and discounted cash flow scores sit at a moderate 3. Valuation metrics lag, with price-to-earnings at 2 and price-to-book at a very unfavorable 1.
Analysis of the company’s bankruptcy risk
EMCOR Group, Inc. currently resides in the safe zone according to its Altman Z-Score, indicating low bankruptcy risk and solid financial stability:

Is the company in good financial health?
The Piotroski Score diagram illustrates EMCOR’s financial strength based on nine accounting criteria:

With a score of 6, EMCOR falls within the average range. This suggests reasonable financial health but leaves room for improvement compared to stronger peers.
Competitive Landscape & Sector Positioning
This sector analysis examines EMCOR Group, Inc.’s strategic positioning, revenue segments, key products, and main competitors. It also explores the company’s competitive advantages within the industrials industry. I will assess whether EMCOR holds a sustainable edge over its rivals in the engineering and construction sector.
Strategic Positioning
EMCOR Group focuses on the U.S. market, generating $16.5B in 2025, with a smaller UK segment near $470M. Its portfolio spans electrical, mechanical, building, and industrial services, revealing a diversified product mix within concentrated geographic exposure.
Revenue by Segment
This pie chart illustrates EMCOR Group, Inc.’s revenue distribution by segment for the fiscal year 2025, highlighting the contribution of each major business line.
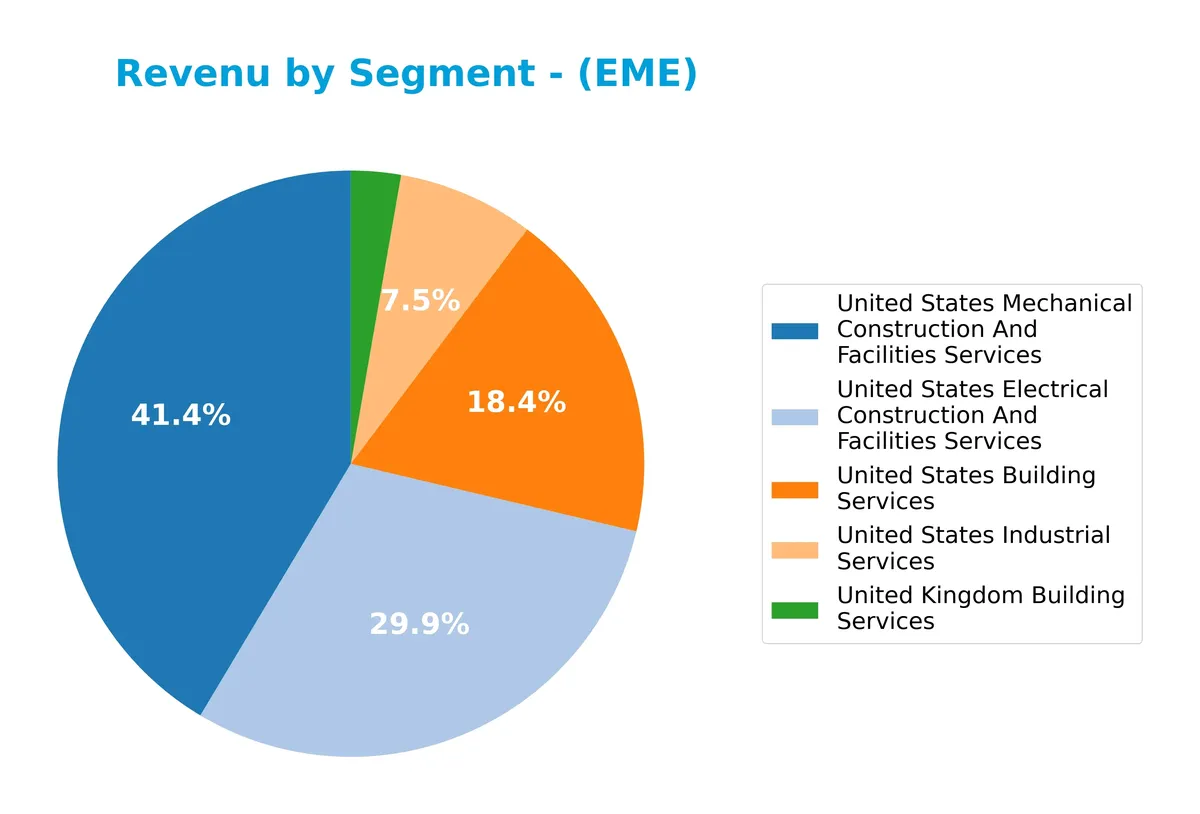
In 2025, United States Mechanical Construction and Facilities Services leads with $7.1B, showing steady growth from prior years. Electrical Construction and Facilities Services follows at $5.1B, reflecting strong acceleration since 2023. Building Services and Industrial Services contribute $3.2B and $1.3B respectively, maintaining stable shares. The UK Building Services segment remains smallest at $471M, signaling geographic concentration risk primarily in U.S. markets.
Key Products & Brands
EMCOR Group’s key products and brands span electrical, mechanical, building, and industrial services across the US and UK markets:
| Product | Description |
|---|---|
| United States Electrical Construction And Facilities Services | Design, installation, operation, and maintenance of electrical power, lighting, and communication systems. |
| United States Mechanical Construction And Facilities Services | HVAC, refrigeration, plumbing, piping, and mechanical systems for commercial and industrial facilities. |
| United States Building Services | Facility management, maintenance, janitorial, landscaping, and support services for commercial and government sites. |
| United States Industrial Services | Specialized services for oil, gas, and petrochemical industries including outage and mobile mechanical maintenance. |
| United Kingdom Building Services | Facility maintenance and building services provided at commercial and government sites across the UK. |
EMCOR’s portfolio reflects a diversified industrial services provider with a strong focus on integrated electrical and mechanical construction complemented by comprehensive facilities management. Its geographic spread includes dominant US operations and a growing UK building services segment.
Main Competitors
There are 3 main competitors in the Industrials sector; below is the list of the top 10 leaders by market capitalization:
| Competitor | Market Cap. |
|---|---|
| Quanta Services, Inc. | 65B |
| Comfort Systems USA, Inc. | 35B |
| EMCOR Group, Inc. | 29B |
EMCOR Group ranks 3rd among its peers with a market cap at 51.2% of the sector leader’s scale. The company sits below both the average market cap of the top 10 competitors (43B) and the sector median (35B). It trails Comfort Systems USA, Inc. by a 5.98% margin, indicating a modest gap with its closest rival.
Comparisons with competitors
Check out how we compare the company to its competitors:
Does EMCOR Group have a competitive advantage?
EMCOR Group exhibits a clear competitive advantage, demonstrated by a very favorable moat rating and a ROIC exceeding its WACC by nearly 17%. This indicates efficient capital use and consistent value creation.
Looking ahead, EMCOR’s broad service portfolio and strong U.S. market presence offer growth opportunities. Continued expansion in energy solutions and industrial services could further enhance its competitive position.
SWOT Analysis
This analysis highlights EMCOR Group, Inc.’s key strategic factors shaping its market position and future prospects.
Strengths
- Strong revenue growth of 71.6% over 5 years
- ROIC of 25.8% far above WACC, showing value creation
- Diverse engineering & facilities services portfolio
Weaknesses
- High price-to-book ratio at 7.5 signals potential overvaluation
- Low dividend yield at 0.16% may deter income investors
- Current ratio of 1.22 indicates moderate liquidity risk
Opportunities
- Expansion in U.S. infrastructure and energy projects
- Increasing demand for sustainable and clean energy solutions
- Leveraging digital and smart building technologies
Threats
- Industry cyclicality impacting construction demand
- Rising raw material and labor costs pressure margins
- Competition from larger diversified engineering firms
EMCOR’s solid financial performance and moat demonstrate a strong competitive advantage. However, valuation concerns and sector cyclicality require cautious capital allocation. Strategic focus on innovation and market expansion is essential to sustain growth.
Stock Price Action Analysis
The weekly stock chart highlights EMCOR Group, Inc.’s price movements and key technical levels over the past 12 months:

Trend Analysis
EME’s stock price surged 104.42% over the past year, establishing a clearly bullish trend with accelerating momentum. The price oscillated between a low of 328.63 and a high of 812.79, reflecting substantial volatility (124.4 std deviation). Recent months confirm this uptrend with a 19.65% gain and a strong slope of 18.26.
Volume Analysis
Trading volume totals 258M shares year-to-date with a rising trend. Buyers dominate with 64.07% overall and an even stronger 71.89% in recent months, indicating robust buying interest. Increasing volume alongside price gains suggests heightened investor confidence and active market participation.
Target Prices
Analysts set a bullish consensus for EMCOR Group, Inc., reflecting confidence in its growth prospects.
| Target Low | Target High | Consensus |
|---|---|---|
| 713 | 800 | 755.67 |
The target range suggests a 7-10% upside from current levels, indicating strong market expectations for EMCOR’s operational execution.

Don’t Let Luck Decide Your Entry Point
Optimize your entry points with our advanced ProRealTime indicators. You’ll get efficient buy signals with precise price targets for maximum performance. Start outperforming now!
Analyst & Consumer Opinions
This section examines grades and consumer feedback regarding EMCOR Group, Inc. (EME) to provide balanced insights.
Stock Grades
Here is the latest verified rating summary from established financial firms for EMCOR Group, Inc.:
| Grading Company | Action | New Grade | Date |
|---|---|---|---|
| Stifel | Maintain | Buy | 2026-01-26 |
| DA Davidson | Maintain | Buy | 2025-10-31 |
| Stifel | Maintain | Buy | 2025-10-13 |
| Goldman Sachs | Maintain | Neutral | 2025-10-08 |
| DA Davidson | Maintain | Buy | 2025-08-01 |
| UBS | Maintain | Buy | 2025-07-25 |
| Stifel | Maintain | Buy | 2025-07-11 |
| Goldman Sachs | Maintain | Sell | 2025-07-08 |
| Stifel | Maintain | Buy | 2025-05-01 |
| Stifel | Maintain | Buy | 2025-02-27 |
The consensus leans strongly toward a Buy rating with six Buy and no Sell or Strong Sell grades. Goldman Sachs stands out with a neutral to sell stance, indicating some divergence in analyst views.
Consumer Opinions
EMCOR Group, Inc. consistently draws praise for reliability but faces criticism on project delays.
| Positive Reviews | Negative Reviews |
|---|---|
| “EMCOR delivers solid workmanship and quality.” | “Project timelines often extend beyond estimates.” |
| “Customer service is responsive and helpful.” | “Pricing can be higher than competitors.” |
| “Strong safety standards on job sites.” | “Occasional communication gaps during projects.” |
Overall, consumers appreciate EMCOR’s quality and safety focus. However, recurring concerns include delays and cost transparency. These factors weigh on customer satisfaction despite operational strengths.
Risk Analysis
Below is a summary table of key risks facing EMCOR Group, Inc., with their likelihood and potential impact:
| Category | Description | Probability | Impact |
|---|---|---|---|
| Valuation Risk | High price-to-book ratio (7.5) suggests the stock may be overvalued, increasing downside risk. | Medium | High |
| Market Volatility | Beta of 1.16 indicates stock price moves above market average, exposing investors to amplified swings. | High | Medium |
| Dividend Yield | Low dividend yield (0.16%) limits income potential and may deter income-focused investors. | Low | Low |
| Liquidity Risk | Current ratio of 1.22 is adequate but not robust, posing moderate liquidity concern during downturns. | Medium | Medium |
| Sector Exposure | Exposure to cyclical engineering & construction sector could lead to earnings volatility amid economic shifts. | Medium | High |
| Credit Risk | Low debt-to-equity (0.23) and strong interest coverage mitigate default risk. | Low | Low |
I consider valuation risk and sector cyclicality the most significant threats. Despite a safe Altman Z-score (7.07), the elevated price-to-book ratio highlights potential overvaluation. The construction sector’s sensitivity to economic cycles remains a key driver of earnings uncertainty.
Should You Buy EMCOR Group, Inc.?
EMCOR Group appears to be a robust value creator with a durable competitive moat, supported by growing ROIC exceeding WACC. Its leverage profile is manageable, suggesting financial stability. The overall rating of B+ reflects a very favorable investment profile amid some valuation concerns.
Strength & Efficiency Pillars
EMCOR Group, Inc. demonstrates robust operational efficiency with a return on equity of 34.57% and a return on invested capital (ROIC) of 25.82%. The ROIC notably exceeds the weighted average cost of capital (WACC) of 8.89%, confirming EMCOR as a value creator. This dynamic is reinforced by a favorable asset turnover of 1.83 and a fixed asset turnover of 24.54, signaling effective capital utilization. The company’s net margin of 7.47% and EBIT margin near 9.84% complement its strong profitability profile, supported by interest coverage marked as infinite.
Weaknesses and Drawbacks
EMCOR faces valuation headwinds, with a price-to-book ratio of 7.5 classified as unfavorable, indicating the market prices the company at a premium relative to its book value. Although the price-to-earnings ratio at 21.7 is neutral, it remains elevated compared to sector averages, suggesting constrained upside from valuation multiples. The current ratio of 1.22 is neutral but signals a modest liquidity cushion. Dividend yield is low at 0.16%, which might deter income-focused investors. Market participation is strongly buyer dominant, which may reduce near-term volatility but could mask underlying risks.
Our Final Verdict about EMCOR Group, Inc.
The company’s financial foundation is solid, with a safe zone Altman Z-Score of 7.07 confirming low bankruptcy risk. EMCOR’s bullish overall trend paired with strongly buyer dominant recent volume suggests healthy investor confidence. Despite a premium valuation and moderate liquidity, the profile may appear attractive for long-term exposure given its value creation and operational strength. However, investors should consider valuation risks and monitor market conditions for optimal entry points.
Disclaimer: This content is for informational purposes only and does not constitute financial, investment, or other professional advice. Investing in financial markets involves a significant risk of loss, and past performance is not indicative of future results.
Additional Resources
- Citigroup Inc. Boosts Holdings in EMCOR Group, Inc. $EME – MarketBeat (Feb 27, 2026)
- Decoding EMCOR Group Inc (EME): A Strategic SWOT Insight – GuruFocus (Feb 27, 2026)
- Emcor Group (EME) Q4 Earnings and Revenues Top Estimates – Nasdaq (Feb 26, 2026)
- EMCOR’s Q4 Earnings & Revenues Beat Estimates, Operating Margin Up Y/Y – The Globe and Mail (Feb 27, 2026)
- EMCOR Group Inc (EME) Q4 2025 Earnings Call Highlights: Record Revenue and Strategic Expansion … By GuruFocus – Investing.com Canada (Feb 27, 2026)
For more information about EMCOR Group, Inc., please visit the official website: emcorgroup.com