Home > Analyses > Healthcare > Eli Lilly and Company
Eli Lilly and Company transforms lives through groundbreaking pharmaceuticals that redefine treatment standards. As a titan in drug manufacturing, it boasts flagship products like Humalog and Trulicity, shaping diabetes care globally. Its pipeline spans oncology, immunology, and neuroscience, reflecting relentless innovation and a reputation for quality. Yet, with a market cap nearing $930B, I question whether Lilly’s robust fundamentals still justify its lofty valuation and future growth prospects.
Table of contents
Business Model & Company Overview
Eli Lilly and Company, founded in 1876 and headquartered in Indianapolis, Indiana, stands as a global leader in the drug manufacturing sector. It develops a comprehensive pharmaceutical ecosystem addressing diabetes, oncology, immunology, and neuroscience. With a portfolio including Humalog, Jardiance, and Verzenio, it delivers innovative therapies that meet critical health needs worldwide.
Its revenue engine balances patented pharmaceuticals with strategic collaborations across the Americas, Europe, and Asia. Recurring sales from diabetes treatments and oncology drugs underpin steady cash flow. Eli Lilly’s competitive advantage lies in its robust pipeline and global reach, ensuring it shapes the future of healthcare through sustained innovation and market presence.
Financial Performance & Fundamental Metrics
I analyze Eli Lilly and Company’s income statement, key financial ratios, and dividend payout policy to assess its core profitability and shareholder returns.
Income Statement
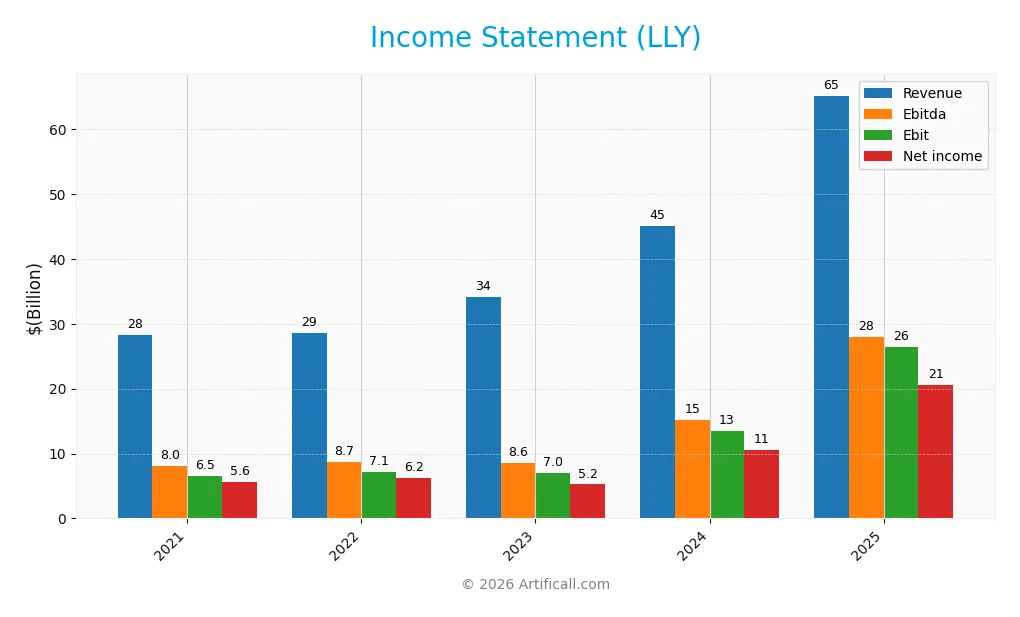
Below is Eli Lilly and Company’s income statement summary for fiscal years 2021 through 2025, reflecting key profitability and expense metrics in USD.
| 2021 | 2022 | 2023 | 2024 | 2025 | |
|---|---|---|---|---|---|
| Revenue | 28.3B | 28.5B | 34.1B | 45.0B | 65.2B |
| Cost of Revenue | 7.3B | 6.6B | 7.1B | 8.4B | 10.6B |
| Operating Expenses | 13.1B | 13.3B | 16.3B | 19.1B | 24.9B |
| Gross Profit | 21.0B | 21.9B | 27.0B | 36.2B | 54.6B |
| EBITDA | 8.0B | 8.7B | 8.6B | 15.2B | 27.9B |
| EBIT | 6.5B | 7.1B | 7.0B | 13.5B | 26.4B |
| Interest Expense | 340M | 332M | 486M | 781M | 795M |
| Net Income | 5.6B | 6.2B | 5.2B | 10.6B | 20.6B |
| EPS | 5.85 | 6.57 | 5.83 | 11.76 | 23.00 |
| Filing Date | 2022-02-23 | 2023-02-22 | 2024-02-21 | 2025-02-19 | 2026-02-12 |
Income Statement Evolution
Eli Lilly’s revenue surged 130% from 2021 to 2025, with a notable 45% jump in 2025 alone. Net income expanded even faster, nearly tripling over the period. Margins improved consistently; gross margin reached 83.8%, and net margin climbed to 31.7%, reflecting strong operational leverage and disciplined cost control.
Is the Income Statement Favorable?
The 2025 income statement shows robust fundamentals. EBITDA margin stands at 42.9%, while EBIT margin is a solid 40.5%, both well above sector norms. Interest expense remains low at 1.2% of revenue, supporting healthy net margins. These metrics indicate efficient capital allocation and profitability, underpinned by significant revenue and earnings growth.
Financial Ratios
This table presents key financial ratios for Eli Lilly and Company (LLY) over the past five fiscal years to facilitate year-over-year performance comparison:
| Ratios | 2021 | 2022 | 2023 | 2024 | 2025 |
|---|---|---|---|---|---|
| Net Margin | 20% | 22% | 15% | 24% | 32% |
| ROE | 62% | 59% | 49% | 75% | 78% |
| ROIC | 20% | 23% | 20% | 26% | 30% |
| P/E | 47 | 56 | 100 | 66 | 47 |
| P/B | 29 | 33 | 49 | 49 | 36 |
| Current Ratio | 1.23 | 1.05 | 0.94 | 1.15 | 1.58 |
| Quick Ratio | 0.97 | 0.80 | 0.73 | 0.89 | 1.19 |
| D/E | 1.88 | 1.52 | 2.34 | 2.37 | 1.60 |
| Debt-to-Assets | 35% | 33% | 39% | 43% | 38% |
| Interest Coverage | 23 | 26 | 22 | 22 | 37 |
| Asset Turnover | 0.58 | 0.58 | 0.53 | 0.57 | 0.58 |
| Fixed Asset Turnover | 3.15 | 2.81 | 2.64 | 2.63 | 2.64 |
| Dividend Yield | 1.17% | 1.02% | 0.78% | 0.67% | 0.56% |
Evolution of Financial Ratios
Eli Lilly’s Return on Equity (ROE) surged significantly, reaching 77.78% in 2025, indicating strong profitability improvement. The Current Ratio increased steadily, peaking at 1.58, signaling enhanced liquidity. However, the Debt-to-Equity Ratio remained elevated around 1.6, reflecting sustained leverage with limited reduction over the period.
Are the Financial Ratios Fovorable?
Profitability ratios such as ROE and net margin are favorable, supported by a robust Return on Invested Capital (30.2%) well above the 5.37% WACC, indicating value creation. Liquidity ratios, including the current and quick ratios, are also favorable, ensuring short-term stability. Conversely, valuation multiples (P/E at 46.76 and P/B at 36.37) and leverage (D/E at 1.6) are unfavorable. Asset turnover and debt-to-assets show neutral signals. Overall, ratios present a slightly favorable profile with a balanced risk outlook.
Shareholder Return Policy
Eli Lilly maintains a consistent dividend policy, with a payout ratio around 26% in 2025 and a dividend yield near 0.56%. The dividend per share increased steadily over recent years, supported by free cash flow coverage exceeding 1.2x, signaling prudent capital allocation and sustainable distributions.
The company also engages in share buybacks, complementing its dividend payments. This balanced approach aims to enhance shareholder value without risking excessive leverage. Overall, Eli Lilly’s return policy reflects a sustainable strategy that supports long-term shareholder wealth creation.
Score analysis
The radar chart below visualizes Eli Lilly and Company’s key financial scores for a comprehensive performance snapshot:
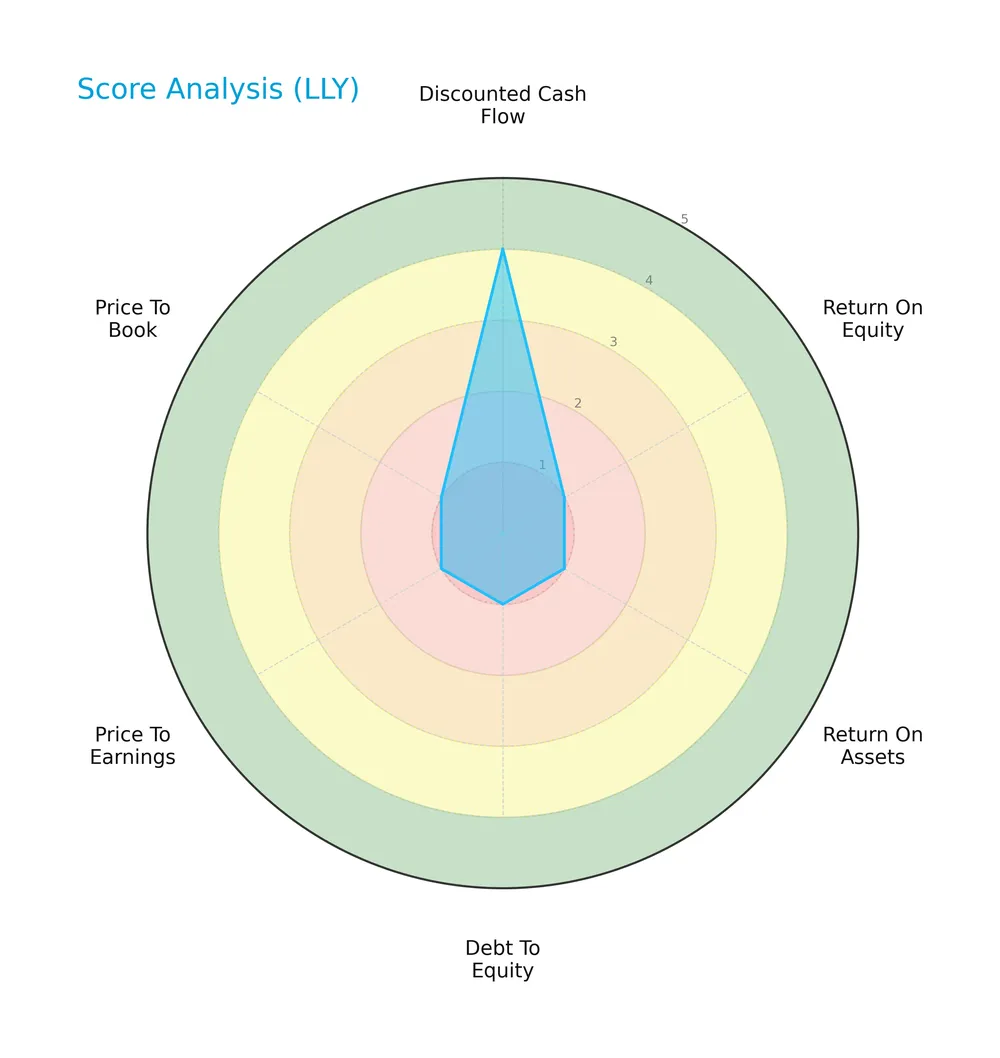
Eli Lilly scores favorably on discounted cash flow with a 4, indicating solid valuation. However, returns on equity and assets, leverage, and valuation multiples all score very unfavorably at 1, signaling weak profitability and financial metrics across the board.
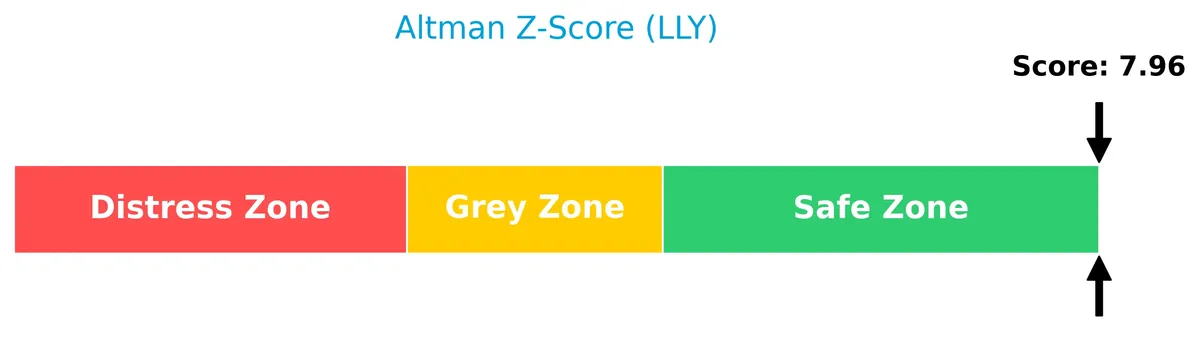
Analysis of the company’s bankruptcy risk
Eli Lilly’s Altman Z-Score firmly places it in the safe zone, indicating a very low risk of bankruptcy in the near term:
Is the company in good financial health?
The Piotroski diagram illustrates Eli Lilly’s financial strength based on nine fundamental criteria:
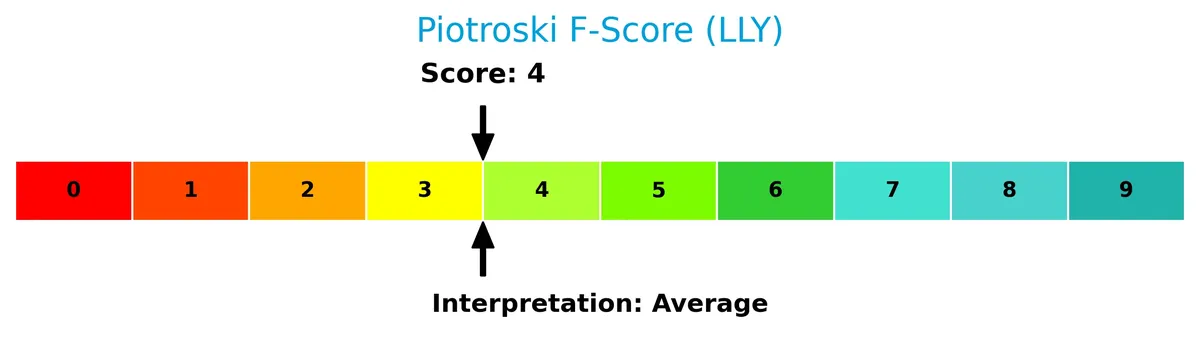
With a Piotroski Score of 4, the company shows average financial health. This middling score suggests mixed signals in profitability, leverage, and operational efficiency.
Competitive Landscape & Sector Positioning
This section analyzes Eli Lilly and Company’s strategic positioning within the healthcare sector. It covers revenue by segment, key products, main competitors, and competitive advantages. I will assess whether Eli Lilly holds a sustainable competitive advantage over its peers.
Strategic Positioning
Eli Lilly concentrates on human pharmaceuticals with significant diversification across diabetes, oncology, immunology, and neuroscience. Geographically, it relies heavily on the US market (~44B in 2025) but maintains substantial exposure in Europe (~11.6B), Japan (~2.1B), and China (~2B), balancing domestic dominance with global reach.
Revenue by Segment
This pie chart presents Eli Lilly and Company’s revenue breakdown by segment for the fiscal year 2025, highlighting the contributions of product sales versus collaboration and other revenue streams.
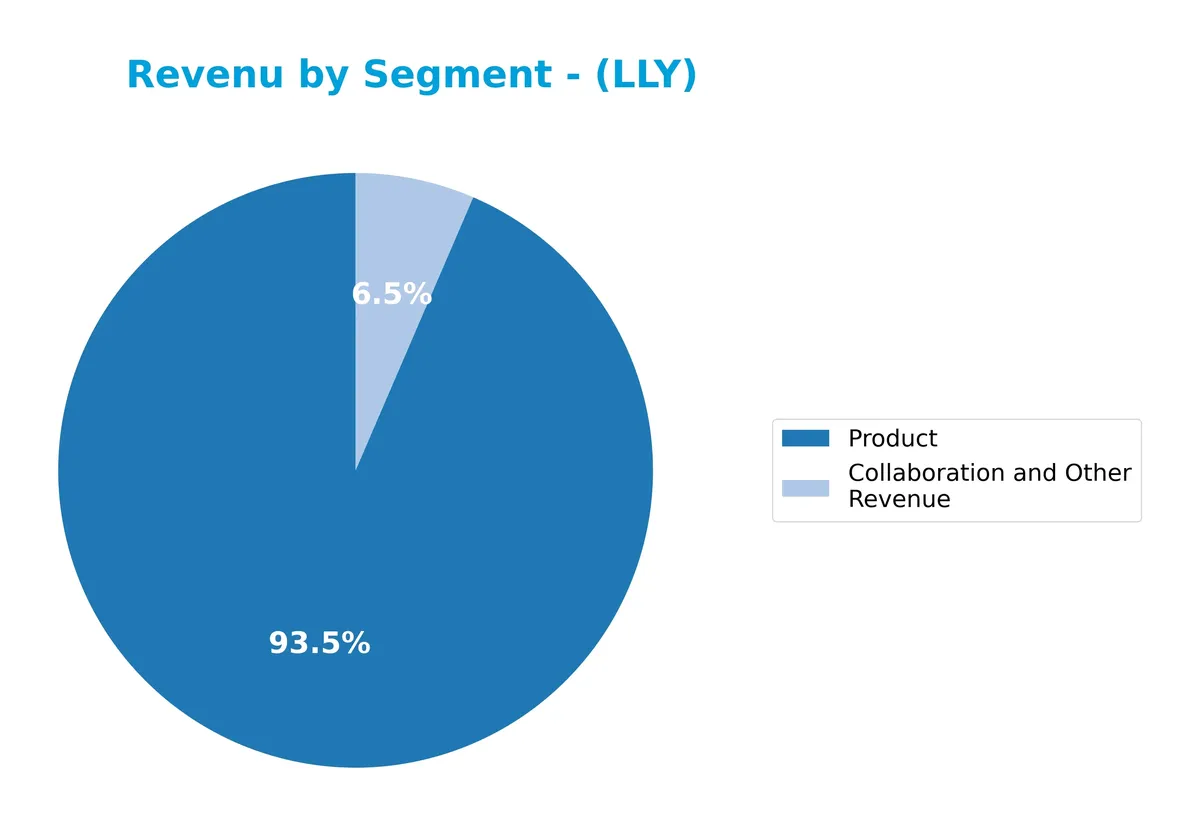
In 2025, product sales dominate Eli Lilly’s revenue, reaching $60.96B, a sharp increase from $40.75B in 2024. Collaboration and other revenue remains stable around $4.22B, showing minimal fluctuation. The data reveals a clear concentration risk, as the product segment drives most top-line growth, reflecting strong demand and successful capital allocation in core pharmaceuticals.
Key Products & Brands
The table below summarizes Eli Lilly and Company’s key products and brands with their therapeutic focus:
| Product | Description |
|---|---|
| Basaglar, Humalog, Humulin | Insulin formulations for diabetes management including rapid-acting and basal insulins. |
| Jardiance, Trajenta, Trulicity | Treatments for type 2 diabetes focusing on glucose control and cardiovascular risk reduction. |
| Alimta | Chemotherapy drug for non-small cell lung cancer and malignant pleural mesothelioma. |
| Cyramza | Targeted therapy for gastric, colorectal, lung, and liver cancers. |
| Erbitux | Monoclonal antibody for colorectal, head, and neck cancers. |
| Retevmo | Treatment for metastatic non-small cell lung cancer and thyroid cancers. |
| Tyvyt | Immunotherapy for relapsed Hodgkin’s lymphoma and non-squamous non-small cell lung cancer. |
| Verzenio | Oral medication for HR+, HER2- metastatic and early breast cancer. |
| Olumiant | Oral treatment for rheumatoid arthritis. |
| Taltz | Therapy for plaque psoriasis, psoriatic arthritis, and related inflammatory conditions. |
| Cymbalta | Antidepressant also used for diabetic neuropathic pain, anxiety, fibromyalgia, and chronic pain. |
| Emgality | Preventive treatment for migraine and episodic cluster headaches. |
| Zyprexa | Antipsychotic for schizophrenia and bipolar disorders. |
| Bamlanivimab, Etesevimab, Bebtelovimab | Monoclonal antibodies for COVID-19 treatment. |
| Cialis | Medication for erectile dysfunction and benign prostatic hyperplasia. |
| Forteo | Treatment for osteoporosis to stimulate bone growth. |
Eli Lilly’s portfolio spans diabetes, oncology, immunology, neuroscience, and infectious diseases. The company’s broad therapeutic reach supports diverse revenue streams and reflects its robust drug development and collaboration ecosystem.
Main Competitors
The Healthcare sector features 10 main competitors, with the table below showing the top 10 leaders by market capitalization:
| Competitor | Market Cap. |
|---|---|
| Eli Lilly and Company | 970B |
| Johnson & Johnson | 500B |
| AbbVie Inc. | 405B |
| AstraZeneca PLC | 285B |
| Merck & Co., Inc. | 268B |
| Amgen Inc. | 176B |
| Gilead Sciences, Inc. | 151B |
| Pfizer Inc. | 143B |
| Bristol-Myers Squibb Company | 109B |
| Biogen Inc. | 26B |
Eli Lilly and Company ranks first among its 10 main competitors. Its market cap equals 96.1% of the top leader’s scale, highlighting its dominant position. The company stands well above both the average market cap of the top 10 (303B) and the median in the sector (222B). The gap to the next competitor below is a substantial 86.6%, underscoring Eli Lilly’s significant market lead.
Comparisons with competitors
Check out how we compare the company to its competitors:
Does LLY have a competitive advantage?
Eli Lilly and Company demonstrates a very favorable competitive advantage, consistently creating value with a ROIC exceeding WACC by 24.8%. Its growing ROIC trend confirms increasing profitability and efficient capital use.
The company’s diverse pharmaceutical portfolio spans diabetes, oncology, and autoimmune diseases, with expanding revenues in the US, Europe, and China. Collaborations with biotech firms suggest future growth opportunities through innovation and market expansion.
SWOT Analysis
This SWOT analysis highlights Eli Lilly’s strategic position by identifying internal strengths and weaknesses alongside external opportunities and threats.
Strengths
- strong global revenue growth
- high ROIC well above WACC
- diversified product portfolio across key therapeutic areas
Weaknesses
- high valuation multiples (PE and PB)
- elevated debt-to-equity ratio
- moderate Piotroski score indicating room for financial strength improvement
Opportunities
- expanding presence in emerging markets like China
- pipeline innovation in oncology and diabetes
- strategic collaborations with biotech firms
Threats
- intense competition in pharma industry
- regulatory and pricing pressures
- patent expirations and generic threats
Eli Lilly demonstrates robust profitability and a durable competitive moat. However, its rich valuation and leverage warrant caution. The company should leverage innovation and geographic expansion while managing financial risks prudently.
Stock Price Action Analysis
The weekly stock chart below illustrates Eli Lilly and Company’s price fluctuations and recent momentum over the past 12 months:
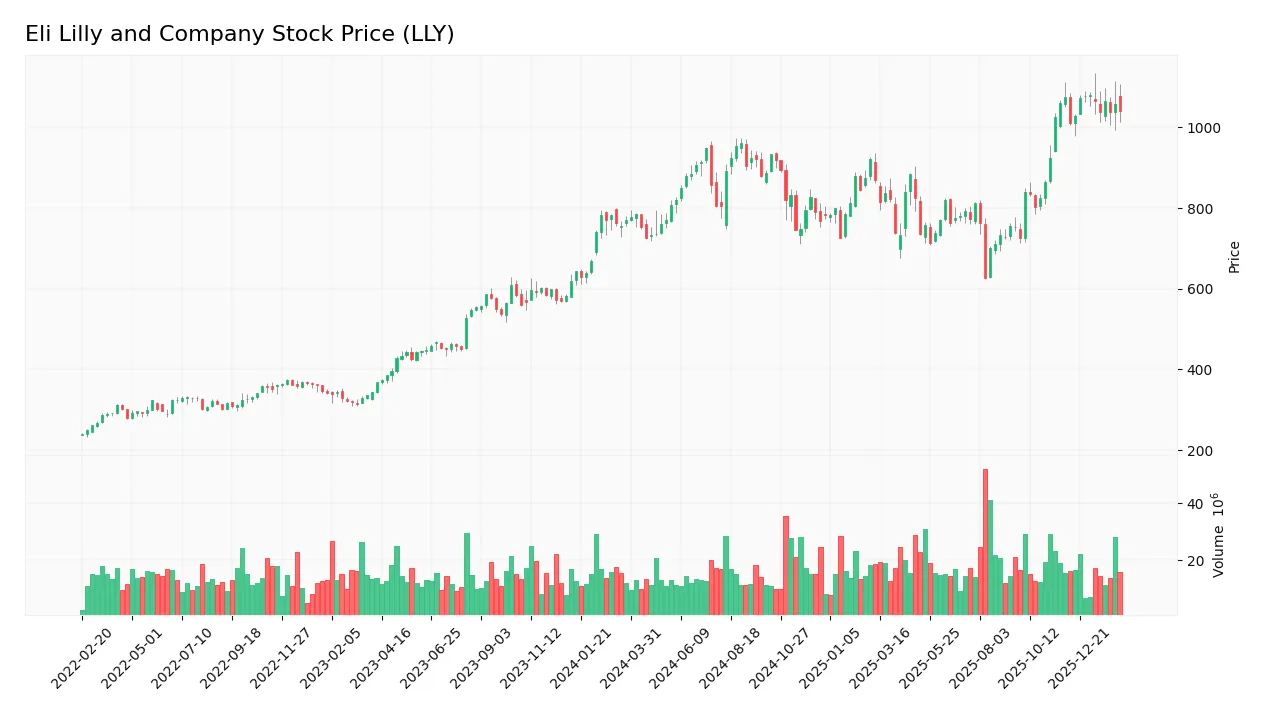
Trend Analysis
Over the past year, LLY’s stock gained 34.96%, confirming a bullish trend with price deceleration. The stock ranged from a low of 625.65 to a high of 1080.36. However, the recent 2.5-month trend shows a -3.3% decline, signaling a short-term bearish slope.
Volume Analysis
Trading volume shows an increasing trend with total buyer volume at 1.19B shares (58.09%), indicating sustained buyer dominance. Over the recent 2.5 months, buyer volume remains slightly dominant at 58.03%, suggesting cautious but persistent investor interest.
Target Prices
Analysts show a confident bullish stance on Eli Lilly and Company with robust target price expectations.
| Target Low | Target High | Consensus |
|---|---|---|
| 830 | 1300 | 1203.56 |
The target range suggests optimism, with the consensus indicating significant upside potential from current levels. This reflects strong growth prospects and market confidence in LLY’s strategic positioning.

Don’t Let Luck Decide Your Entry Point
Optimize your entry points with our advanced ProRealTime indicators. You’ll get efficient buy signals with precise price targets for maximum performance. Start outperforming now!
Analyst & Consumer Opinions
This section examines Eli Lilly and Company’s analyst ratings and consumer feedback to provide a balanced perspective.
Stock Grades
Here are the latest verified grades for Eli Lilly and Company from top financial institutions:
| Grading Company | Action | New Grade | Date |
|---|---|---|---|
| Deutsche Bank | Maintain | Buy | 2026-02-09 |
| Morgan Stanley | Maintain | Overweight | 2026-02-05 |
| JP Morgan | Maintain | Overweight | 2026-02-05 |
| Cantor Fitzgerald | Maintain | Overweight | 2026-02-05 |
| Wells Fargo | Maintain | Overweight | 2026-02-05 |
| Guggenheim | Maintain | Buy | 2026-01-20 |
| B of A Securities | Maintain | Buy | 2025-12-15 |
| Wells Fargo | Maintain | Overweight | 2025-12-10 |
| BMO Capital | Maintain | Outperform | 2025-12-04 |
| Guggenheim | Maintain | Buy | 2025-12-03 |
The grades consistently reflect a positive outlook, with a strong bias towards Buy and Overweight ratings. This steady consensus suggests confidence in Eli Lilly’s performance prospects across multiple respected firms.
Consumer Opinions
Eli Lilly and Company enjoys a strong reputation among consumers, reflecting its impact in healthcare innovation.
| Positive Reviews | Negative Reviews |
|---|---|
| “Effective medications with noticeable results.” | “High drug prices make treatments less accessible.” |
| “Reliable customer support and clear information.” | “Occasional delays in prescription fulfillment.” |
| “Consistently launches innovative therapies.” | “Side effects not always well communicated.” |
Overall, consumers praise Eli Lilly for its innovative drug portfolio and dependable service. However, concerns about pricing and communication around side effects persist as notable weaknesses.
Risk Analysis
Here is a concise overview of Eli Lilly’s key risks, ranked by likelihood and potential impact:
| Category | Description | Probability | Impact |
|---|---|---|---|
| Valuation Risk | Elevated P/E (46.76) and P/B (36.37) ratios suggest the stock is expensive relative to earnings and book value. | High | High |
| Debt Risk | Debt-to-equity ratio at 1.6 indicates higher leverage compared to industry norms, increasing financial risk. | Medium | Medium |
| Competitive Risk | Intense competition in pharma innovation and patent cliffs could pressure future growth. | Medium | High |
| Regulatory Risk | Changes in healthcare regulations or drug approvals can significantly affect revenue streams. | Medium | High |
| Dividend Yield Risk | Low dividend yield (0.56%) may deter income-focused investors and limit downside protection. | Low | Low |
The most pressing risk is valuation. Eli Lilly trades at premium multiples well above healthcare sector averages, reflecting high investor expectations. Any earnings disappointment could trigger sharp corrections. Additionally, the company’s elevated debt level warrants caution despite strong interest coverage. Regulatory and competitive pressures remain persistent threats in this tightly regulated industry.
Should You Buy Eli Lilly and Company?
Eli Lilly appears to be a profitable company with a durable competitive moat, as indicated by its growing ROIC well above WACC. While its leverage profile seems manageable, the overall rating of C- suggests cautious interpretation of its broader valuation and financial metrics.
Strength & Efficiency Pillars
Eli Lilly and Company exhibits robust profitability with a net margin of 31.66% and a return on equity of 77.78%. Its return on invested capital (ROIC) stands at 30.2%, significantly surpassing the weighted average cost of capital (WACC) at 5.37%, marking the company as a strong value creator. The firm’s gross and EBIT margins, 83.79% and 40.46% respectively, further underscore operational efficiency. This performance reflects a sustainable competitive advantage supported by a growing ROIC trend.
Weaknesses and Drawbacks
Despite solid fundamentals, Eli Lilly faces valuation challenges. Its price-to-earnings ratio of 46.76 and price-to-book ratio of 36.37 suggest a considerable premium, raising concerns about overvaluation. Leverage is elevated, with a debt-to-equity ratio of 1.6, which could pressure future financial flexibility. While liquidity ratios remain favorable, the relatively high valuation multiples expose the stock to market corrections and increased volatility, warranting caution.
Our Final Verdict about Eli Lilly and Company
Eli Lilly’s long-term fundamentals appear solid, supported by strong profitability and value creation. The overall bullish trend, combined with a safe Altman Z-Score of 7.96, suggests financial stability. However, recent price deceleration advises a cautious stance. This profile might appear attractive for long-term exposure but suggests a wait-and-see approach to optimize entry timing amid valuation risks and market fluctuations.
Disclaimer: This content is for informational purposes only and does not constitute financial, investment, or other professional advice. Investing in financial markets involves a significant risk of loss, and past performance is not indicative of future results.
Additional Resources
- Eli Lilly boosts weight loss pill inventory ahead of FDA decision – Seeking Alpha (Feb 13, 2026)
- Eli Lilly Stock (LLY) Gets New ‘Buy Rating’ After Strong Earnings – TipRanks (Feb 12, 2026)
- Eli Lilly’s 2025 Surge Sets the Stage for Another Big Year in 2026 – Yahoo Finance (Feb 10, 2026)
- Eli Lilly and Company (LLY) Gets Upgraded to Buy From Hold by Freedom Capital – Yahoo Finance (Feb 13, 2026)
- Longbow Finance SA Cuts Stake in Eli Lilly and Company $LLY – MarketBeat (Feb 13, 2026)
For more information about Eli Lilly and Company, please visit the official website: lilly.com