Home > Analyses > Healthcare > Elevance Health Inc.
Elevance Health shapes the healthcare experience for over 118 million people, weaving care, technology, and support into daily lives. As a dominant force in health benefits, it delivers a comprehensive suite of medical, digital, pharmacy, and behavioral solutions. Known for innovation and scale, Elevance commands industry respect and influence. Yet, as market dynamics shift, I ask: do its fundamentals still justify its premium valuation and growth ambitions?

Table of contents
Business Model & Company Overview
Elevance Health Inc., founded in 1944 and based in Indianapolis, Indiana, stands as a powerhouse in the Medical – Healthcare Plans sector. Serving 118M people, it connects consumers, families, and communities through an integrated ecosystem of medical, digital, pharmacy, behavioral, and clinical care solutions. This cohesive mission shapes healthier lives across the full care journey.
The company generates value through a balanced portfolio combining healthcare plans with digital and pharmacy services, driving recurring revenue streams. Its strategic footprint spans the Americas, Europe, and Asia, reinforcing its global reach. Elevance’s economic moat lies in its scale and integrated care model, positioning it to influence healthcare’s evolving landscape.
Financial Performance & Fundamental Metrics
I analyze Elevance Health Inc.’s income statement, key financial ratios, and dividend payout policy to assess its profitability and capital efficiency.
Income Statement
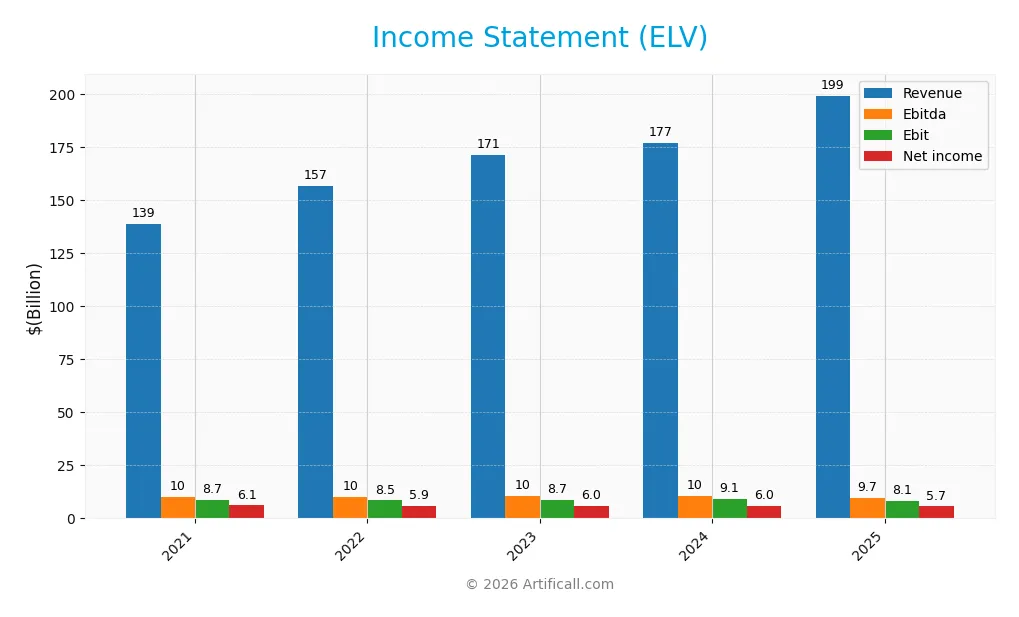
The table below presents Elevance Health Inc.’s key income statement figures for fiscal years 2021 through 2025, all amounts in USD.
| 2021 | 2022 | 2023 | 2024 | 2025 | |
|---|---|---|---|---|---|
| Revenue | 139B | 157B | 171B | 177B | 199B |
| Cost of Revenue | 103B | 117B | 124B | 128B | 148B |
| Operating Expenses | 27B | 31B | 38B | 40B | 43B |
| Gross Profit | 36B | 40B | 47B | 49B | 51B |
| EBITDA | 10B | 10B | 10B | 10B | 10B |
| EBIT | 8.7B | 8.5B | 8.7B | 9.1B | 8.1B |
| Interest Expense | 798M | 851M | 1.0B | 1.2B | 1.4B |
| Net Income | 6.1B | 5.9B | 6.0B | 6.0B | 5.7B |
| EPS | 25.25 | 24.56 | 25.38 | 25.81 | 25.18 |
| Filing Date | 2022-02-16 | 2023-02-15 | 2024-02-21 | 2025-02-20 | 2026-02-06 |
Income Statement Evolution
Elevance Health’s revenue grew steadily, rising 44% from 2021 to 2025, with a favorable 12.6% increase in the past year. Gross profit expanded modestly, supporting a stable gross margin near 25.6%. However, EBIT and net income declined, dragging margins down by 10.7% and 15.9% respectively in the last year, signaling margin pressure despite top-line growth.
Is the Income Statement Favorable?
In 2025, Elevance Health posted $199B revenue with a 2.8% net margin, reflecting neutral profitability. Interest expense remained low at 0.7% of revenue, a favorable factor. Yet, EBIT fell 10.7%, and net income dropped 7.2% over five years. Earnings per share edged up only 1.6%. Overall, fundamentals appear balanced between growth and margin challenges, yielding a neutral income statement profile.
Financial Ratios
The table below summarizes key financial ratios for Elevance Health Inc. over the past five fiscal years:
| Ratios | 2021 | 2022 | 2023 | 2024 | 2025 |
|---|---|---|---|---|---|
| Net Margin | 4.44% | 3.76% | 3.49% | 3.38% | 2.85% |
| ROE | 17.08% | 16.26% | 15.23% | 14.47% | 12.90% |
| ROIC | 7.34% | 33.36%* | 31.97%* | 296.47%* | 7.22% |
| P/E | 18.35 | 20.89 | 18.36 | 14.37 | 13.73 |
| P/B | 3.13 | 3.40 | 2.80 | 2.08 | 1.77 |
| Current Ratio | 0.94 | N/A | N/A | 0 | 1.54 |
| Quick Ratio | 0.94 | N/A | N/A | 0 | 1.54 |
| D/E | 0.64 | 0.67 | 0.64 | 0.76 | 0.73 |
| Debt-to-Assets | 23.63% | 23.47% | 23.06% | 26.72% | 26.38% |
| Interest Coverage | 10.02 | 8.93 | 7.49 | 6.67 | 4.99 |
| Asset Turnover | 1.42 | 1.52 | 1.57 | 1.51 | 1.64 |
| Fixed Asset Turnover | 35.38 | 36.28 | 39.31 | 38.01 | 42.46 |
| Dividend Yield | 0.98% | 1.00% | 1.27% | 1.76% | 1.97% |
*ROIC values for 2022-2024 appear unusually high, indicating possible data anomalies or differing calculation bases. N/A indicates data not available or not reported for that year. Current and Quick Ratios show gaps or zero values in some years, which is a noteworthy data inconsistency.
Evolution of Financial Ratios
Return on Equity (ROE) trended downward from about 17.1% in 2021 to 12.9% in 2025, indicating slowing profitability. The Current Ratio improved significantly in 2025 to 1.54 from below 1 previously, signaling better liquidity. Debt-to-Equity Ratio remained relatively stable around 0.7, reflecting consistent leverage management over the period.
Are the Financial Ratios Favorable?
In 2025, liquidity ratios like Current and Quick Ratios stand favorable at 1.54, supporting short-term financial health. Profitability metrics show mixed signals; ROE and ROIC are neutral, while Net Margin is unfavorable at 2.85%. Leverage ratios, including Debt-to-Assets at 26.4%, and Interest Coverage near 5.8, are favorable. Market valuations such as P/E at 13.7 are attractive. Overall, 57% of key ratios are favorable, suggesting a generally positive financial profile.
Shareholder Return Policy
Elevance Health Inc. pays dividends with a payout ratio around 27%, supported by a steady dividend per share increase to $6.89 in 2025 and a yield near 2%. The company also funds distributions through free cash flow, maintaining coverage above 1.6x.
The firm complements dividends with share buybacks, reinforcing capital return. This balanced approach aligns with sustainable shareholder value creation, reflecting prudent capital allocation and consistent earnings support.
Score analysis
The following radar chart illustrates Elevance Health Inc.’s key financial scores for a comprehensive overview:
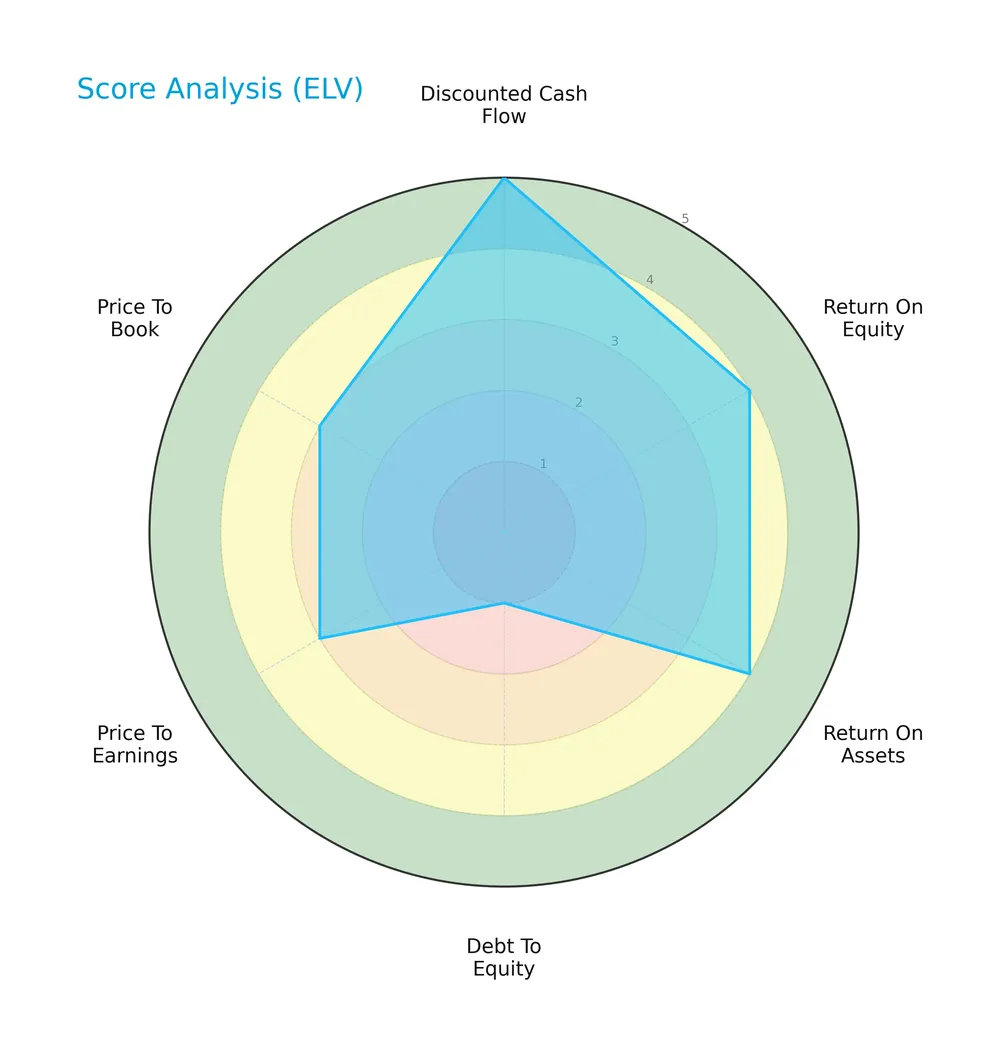
Elevance excels in discounted cash flow with a very favorable score of 5. Return on equity and assets are both favorable at 4. However, debt to equity is a red flag at 1, indicating high leverage risk. Price multiples show moderate valuation scores of 3.
Analysis of the company’s bankruptcy risk
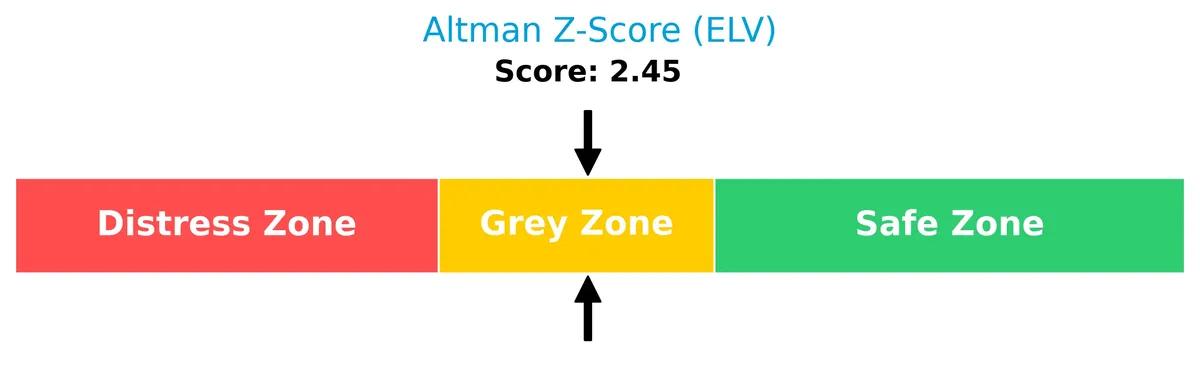
Elevance’s Altman Z-Score of 2.45 places it in the grey zone, indicating a moderate risk of bankruptcy:
Is the company in good financial health?
The Piotroski Score diagram below shows Elevance’s financial health assessment:
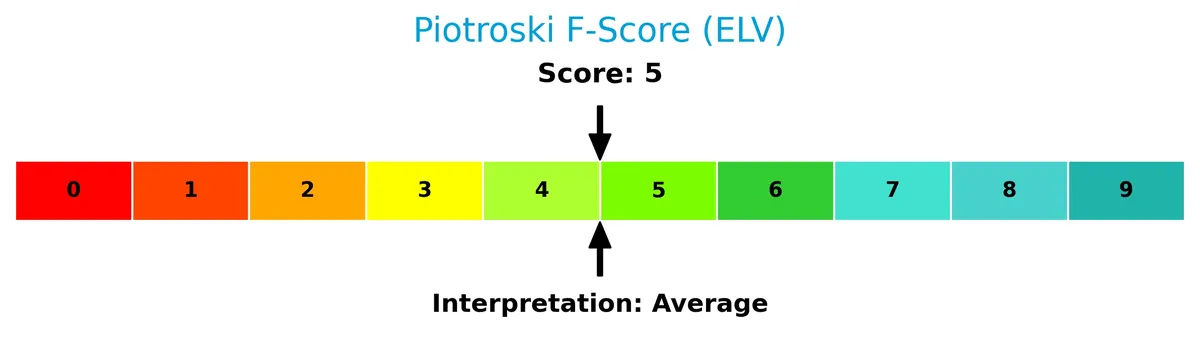
With a score of 5, Elevance sits at an average level, suggesting moderate financial strength but room for improvement.
Competitive Landscape & Sector Positioning
This sector analysis explores Elevance Health Inc.’s strategic positioning, revenue segments, and core products. I will assess if Elevance Health holds a competitive advantage over its main industry rivals.
Strategic Positioning
Elevance Health operates a diversified portfolio, primarily split between its Health Benefits segment (150B in 2024) and Carelon Services (54B). This mix spans medical, pharmacy, behavioral, and digital care, serving 118M people, reflecting broad product and service exposure within US healthcare.
Revenue by Segment
This pie chart illustrates Elevance Health Inc.’s revenue breakdown by business segment for the fiscal year 2024, highlighting the company’s dominant revenue sources.
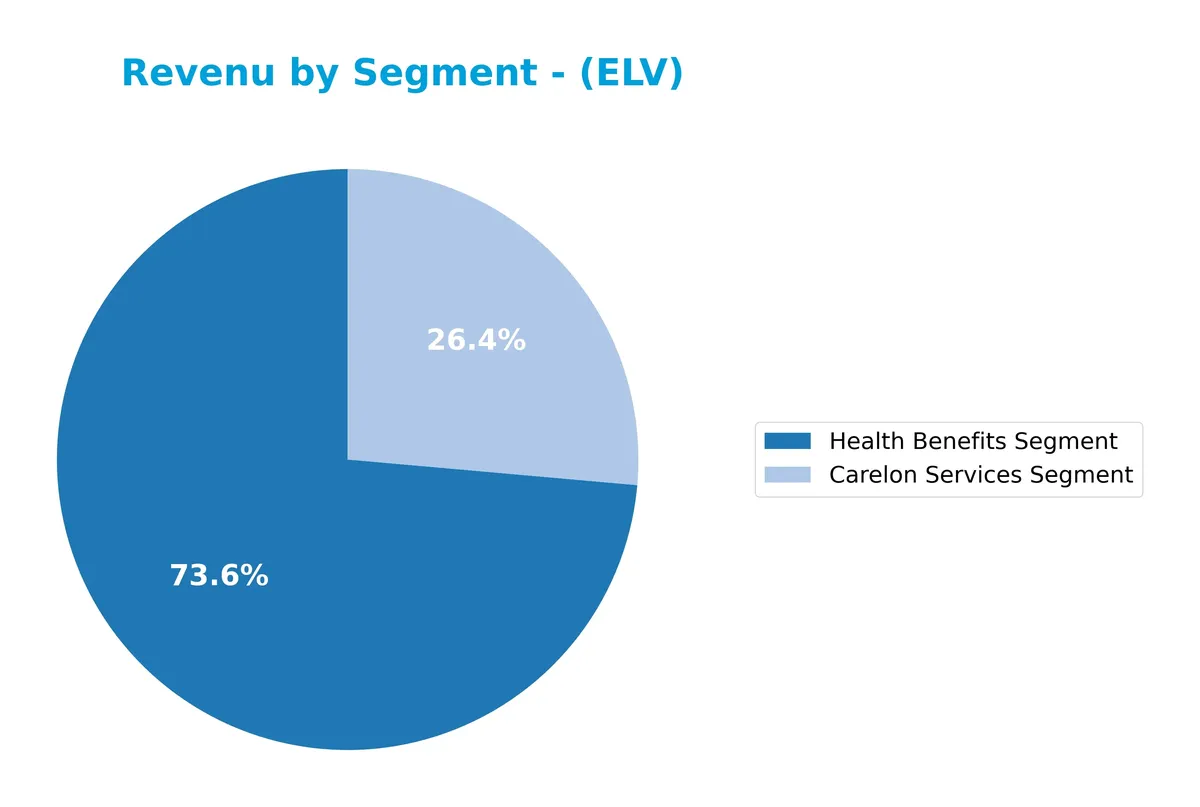
In 2024, Elevance’s Health Benefits Segment leads with $150.3B, underscoring its core role. The Carelon Services Segment contributes $53.9B, showing significant scale but a decline from 2023’s $95.9B. This shift suggests a strategic recalibration or market pressure on services. The narrowing focus on Health Benefits signals concentration risk but also specialization in a high-barrier sector. Investors should watch segment volatility closely.
Key Products & Brands
The table below outlines Elevance Health’s primary products and segments with brief descriptions:
| Product | Description |
|---|---|
| Health Benefits Segment | Provides medical, digital, pharmacy, behavioral, clinical, and care solutions to 118M people. |
| Carelon Services Segment | Offers integrated care management and clinical services to support healthier care journeys. |
| IngenioRx Segment | Focuses on pharmacy benefit management services, improving drug utilization and cost control. |
| Government Business Segment | Delivers health plans and services to government programs including Medicare and Medicaid. |
| Commercial Specialty Business Segment | Targets specialty insurance products for commercial customers. |
| Dental Vision Products And Services | Provides dental and vision insurance products and related services. |
| Other Segment | Includes miscellaneous products and services not classified under other main segments. |
Elevance Health’s product mix spans health benefits and care services, reflecting its integrated approach in healthcare plans and solutions. The company balances government and commercial business lines with specialty and pharmacy management services.
Main Competitors
There are 7 competitors in the Healthcare sector; the table lists the top 7 leaders by market capitalization:
| Competitor | Market Cap. |
|---|---|
| UnitedHealth Group Incorporated | 305B |
| CVS Health Corporation | 102B |
| Elevance Health Inc. | 79B |
| Cigna Corporation | 75B |
| Humana Inc. | 32B |
| Centene Corporation | 21B |
| Molina Healthcare, Inc. | 9.7B |
Elevance Health ranks 3rd among its 7 competitors. It holds about 25% of UnitedHealth’s market cap, the sector leader. The company’s market cap is below the average top 10 competitor (88.8B) but above the sector median (74.6B). It sits comfortably +35% above its nearest rival, Cigna Corporation.
Comparisons with competitors
Check out how we compare the company to its competitors:
Does Elevance Health Inc. have a competitive advantage?
Elevance Health does not currently exhibit a strong competitive advantage. Its ROIC trails WACC by 1.9%, indicating value erosion and a declining profitability trend over 2021-2025.
Future opportunities may arise from expanding its comprehensive healthcare portfolio serving 118M people. New digital, pharmacy, and behavioral care solutions could drive growth in evolving healthcare markets.
SWOT Analysis
This SWOT analysis highlights Elevance Health Inc.’s key strategic factors shaping its competitive position and growth prospects.
Strengths
- Large market reach with 118M served
- Favorable revenue growth of 12.6% in 2025
- Strong financial ratios including low debt and high asset turnover
Weaknesses
- Declining EBIT and net margin growth
- ROIC below sustainable value creation threshold
- Moderate Piotroski score indicating average financial strength
Opportunities
- Expansion in digital and behavioral health solutions
- Growing demand for integrated care services
- Potential margin recovery through operational efficiency
Threats
- Intense regulatory scrutiny in healthcare sector
- Rising operational costs impacting margins
- Competitive pressure from innovative healthcare players
Elevance Health’s strengths in scale and growth provide a solid foundation, but margin erosion and value creation challenges require strategic focus. The company must leverage digital transformation and integrated care to offset regulatory and cost pressures.
Stock Price Action Analysis
The weekly stock chart for Elevance Health Inc. reveals price movements and recent volatility trends over the past 12 months:
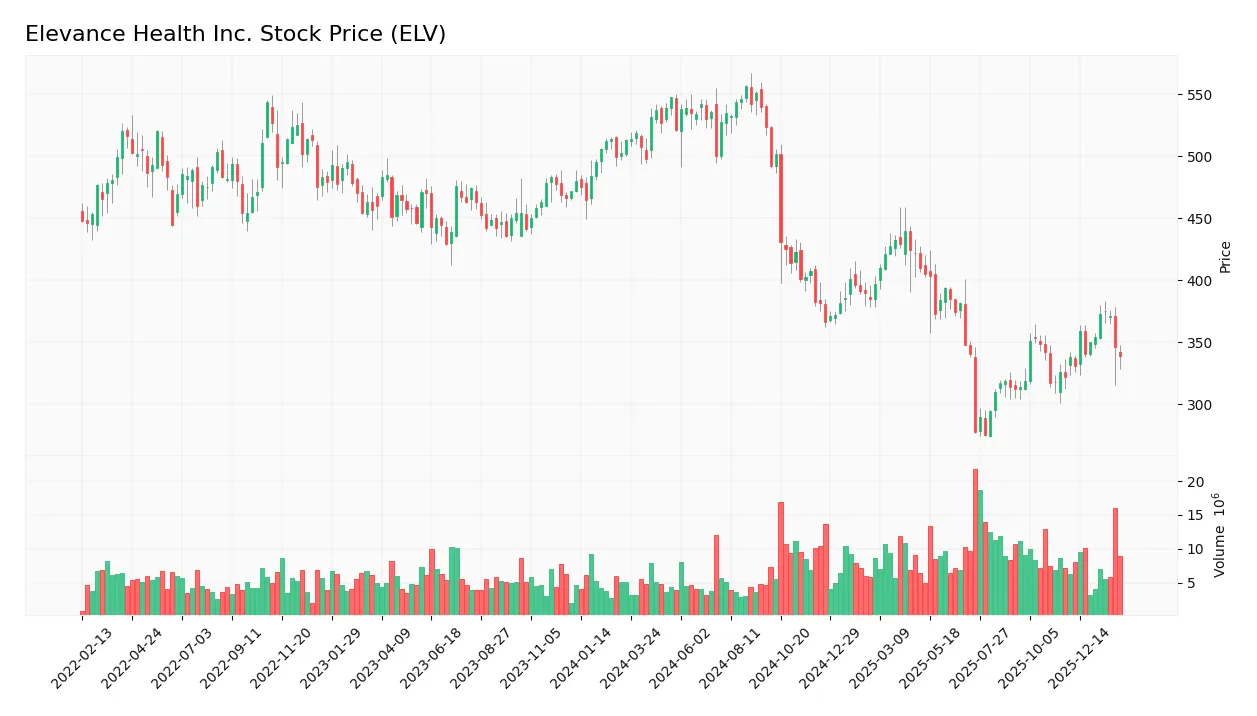
Trend Analysis
Over the past 12 months, ELV’s stock price declined by 33.93%, indicating a bearish trend with accelerating downward momentum. The stock reached a high of 556.89 and a low of 274.66, reflecting significant volatility with an 82.59 standard deviation.
Volume Analysis
In the last three months, trading volume increased but remained seller-dominant, with sellers accounting for 61.28% of volume. This suggests cautious investor sentiment and stronger selling pressure despite rising market participation.
Target Prices
Analysts set a solid target consensus for Elevance Health Inc., reflecting confidence in its growth trajectory.
| Target Low | Target High | Consensus |
|---|---|---|
| 332 | 425 | 387.14 |
The target range signals robust upside potential, with the consensus price implying a substantial premium over recent levels.

Don’t Let Luck Decide Your Entry Point
Optimize your entry points with our advanced ProRealTime indicators. You’ll get efficient buy signals with precise price targets for maximum performance. Start outperforming now!
Analyst & Consumer Opinions
This section examines Elevance Health Inc. (ELV) through analyst ratings and consumer feedback to gauge market sentiment.
Stock Grades
Here is a concise summary of the latest verified stock grades for Elevance Health Inc. from leading financial institutions:
| Grading Company | Action | New Grade | Date |
|---|---|---|---|
| JP Morgan | Maintain | Overweight | 2026-02-02 |
| Truist Securities | Maintain | Buy | 2026-02-02 |
| Barclays | Maintain | Overweight | 2026-01-30 |
| Wells Fargo | Maintain | Overweight | 2026-01-30 |
| Guggenheim | Maintain | Buy | 2026-01-29 |
| Guggenheim | Maintain | Buy | 2026-01-22 |
| Wolfe Research | Upgrade | Outperform | 2026-01-08 |
| Wells Fargo | Maintain | Overweight | 2026-01-07 |
| Barclays | Maintain | Overweight | 2026-01-05 |
| Deutsche Bank | Downgrade | Hold | 2025-12-19 |
The majority of recent grades maintain a favorable outlook, primarily “Overweight” or “Buy,” reflecting confidence in Elevance Health’s prospects. A solitary downgrade to “Hold” from Deutsche Bank contrasts with Wolfe Research’s upgrade, indicating some divergence in analyst sentiment.
Consumer Opinions
Consumers express a mix of admiration and frustration toward Elevance Health Inc., reflecting real-world service challenges and strengths.
| Positive Reviews | Negative Reviews |
|---|---|
| Efficient customer service teams resolve issues fast. | Claims processing delays cause significant stress. |
| Comprehensive coverage options meet diverse needs. | High premiums strain household budgets. |
| User-friendly digital platforms simplify access. | Confusing policy language leads to misunderstandings. |
Overall, consumers appreciate Elevance Health’s extensive coverage and digital ease but frequently cite delays and cost concerns. These issues warrant attention to maintain customer loyalty.
Risk Analysis
Below is a detailed table highlighting key risks Elevance Health faces, including their likelihood and potential impact:
| Category | Description | Probability | Impact |
|---|---|---|---|
| Regulatory Risk | Healthcare regulations may tighten, increasing compliance costs | Medium | High |
| Profitability | Net margin remains low at 2.85%, signaling margin pressure | High | Medium |
| Financial Health | Altman Z-Score in grey zone (2.45) indicates moderate distress | Medium | High |
| Leverage | Debt-to-equity score is very unfavorable, raising solvency concerns | Medium | Medium |
| Market Volatility | Beta of 0.50 suggests lower stock volatility but limited upside | Low | Low |
Elevance’s most pressing risks are profitability constraints and moderate financial distress signals. The low net margin contrasts with its favorable ROIC-WACC spread, suggesting operational efficiency struggles. Regulatory shifts in healthcare remain a persistent threat, potentially driving costs higher. Investors should monitor debt levels closely given the weak debt-to-equity score.
Should You Buy Elevance Health Inc.?
Elevance Health Inc. appears to show robust profitability with improving operational efficiency, yet its slightly unfavorable moat suggests value erosion. Despite a manageable leverage profile, its overall A- rating reflects a cautiously favorable investment profile amid moderate financial strength indicators.
Strength & Efficiency Pillars
Elevance Health Inc. shows operational resilience with a gross margin of 25.56% and a favorable interest expense at 0.7%. Its ROIC of 7.22% exceeds the WACC of 5.33%, marking it as a value creator, although the margin is modest. The company maintains an efficient asset turnover of 1.64 and strong fixed asset turnover at 42.46, signaling effective use of capital. Despite a neutral net margin of 2.85%, the firm sustains a balanced current ratio of 1.54, supporting operational stability.
Weaknesses and Drawbacks
Elevance Health’s Altman Z-Score of 2.45 places it in the grey zone, indicating moderate bankruptcy risk. This cautionary signal tempers enthusiasm despite operational metrics. The company’s debt-to-equity ratio of 0.73 is neutral but combined with a modest net margin decline (-15.93% YoY) suggests pressure on profitability. Additionally, seller dominance at 61.28% in recent trading creates short-term headwinds. Valuation metrics are moderate: P/E at 13.73 and P/B at 1.77 offer limited margin for error amid market uncertainty.
Our Final Verdict about Elevance Health Inc.
Elevance Health presents a fundamentally mixed profile with operational strengths but mounting solvency concerns as flagged by the grey zone Altman Z-Score. Despite moderate valuation and a value-creating ROIC, recent bearish price trends and seller dominance suggest caution. The company might appear suitable for investors with a tolerance for moderate financial risk, but the solvency risk advises a wait-and-see approach before committing capital.
Disclaimer: This content is for informational purposes only and does not constitute financial, investment, or other professional advice. Investing in financial markets involves a significant risk of loss, and past performance is not indicative of future results.
Additional Resources
- Elevance Health, Inc. SEC 10-K Report – TradingView (Feb 06, 2026)
- Elevance Health: It Has Been Painful, But This Too Shall Pass (ELV) – Seeking Alpha (Feb 03, 2026)
- Elevance Health Inc (ELV) Q4 2025 Earnings Call Highlights: Strong Financial Performance Amid … – Yahoo Finance (Jan 28, 2026)
- Elevance Health, Inc. (ELV) Investigation: Bronstein, Gewirtz & Grossman, LLC Encourages Stockholders to Contact the Firm to Learn More About the Investigation – accessnewswire.com (Feb 06, 2026)
- Earnings call transcript: Elevance Health Q4 2025 beats EPS forecast – Investing.com (Feb 03, 2026)
For more information about Elevance Health Inc., please visit the official website: elevancehealth.com