Home > Analyses > Technology > Elastic N.V.
Elastic N.V. transforms how businesses harness data, powering real-time search and analytics across diverse industries. As a trailblazer in application software, Elastic’s flagship Elastic Stack—featuring Elasticsearch and Kibana—enables organizations to extract actionable insights from complex, multi-cloud environments. Renowned for innovation and robust data solutions, Elastic shapes the future of digital intelligence. But in a rapidly evolving tech landscape, the question remains: do Elastic’s fundamentals justify its current valuation and growth prospects?
Table of contents
Business Model & Company Overview
Elastic N.V., founded in 2012 and headquartered in Mountain View, California, stands as a dominant player in the software application industry. The company’s core mission revolves around its Elastic Stack, a cohesive ecosystem of products designed to ingest, store, and analyze diverse data types in real time. This suite includes Elasticsearch, Kibana, Beats, Elastic Agent, and Logstash, collectively enabling advanced search, visualization, and data management across multiple cloud environments.
Elastic’s revenue engine balances software sales with recurring service offerings, leveraging the Elastic Stack platform to address use cases like application search, logging, and performance monitoring. Its strategic global footprint spans the Americas, Europe, and Asia, fueling growth across varied markets. This integrated approach creates a sustainable economic moat, positioning Elastic as a pivotal force shaping the future of enterprise data search and analytics.
Financial Performance & Fundamental Metrics
In this section, I analyze Elastic N.V.’s income statement, key financial ratios, and dividend payout policy to assess its overall financial health and investment potential.
Income Statement
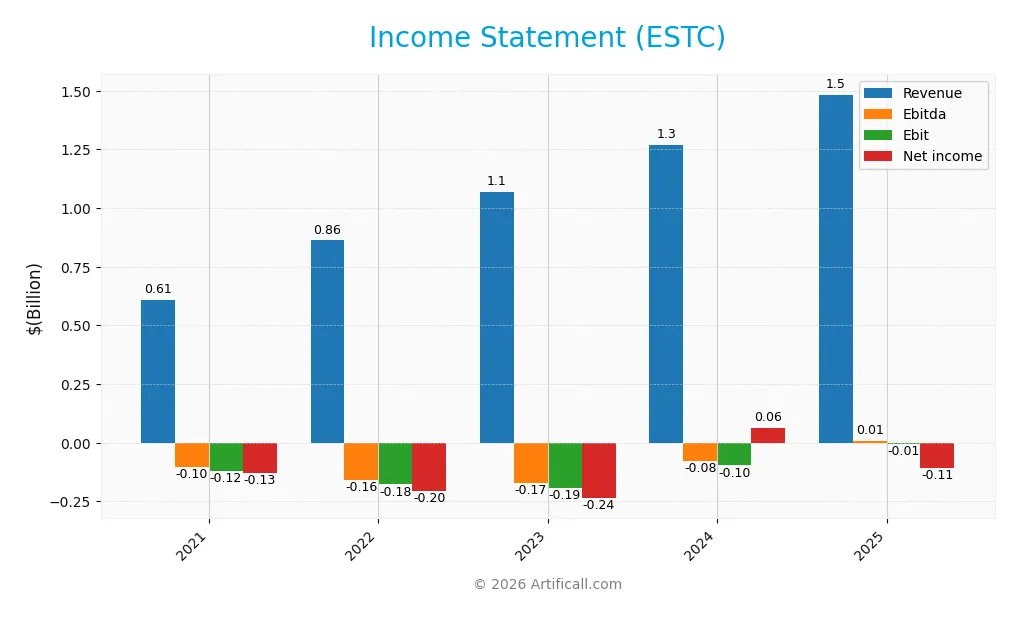
Below is the Income Statement for Elastic N.V. (ESTC) covering fiscal years 2021 to 2025, presented in USD.
| 2021 | 2022 | 2023 | 2024 | 2025 | |
|---|---|---|---|---|---|
| Revenue | 608M | 862M | 1.07B | 1.27B | 1.48B |
| Cost of Revenue | 161M | 232M | 297M | 330M | 380M |
| Operating Expenses | 577M | 804M | 992M | 1.07B | 1.16B |
| Gross Profit | 447M | 630M | 772M | 937M | 1.10B |
| EBITDA | -104M | -157M | -171M | -79M | 6.1M |
| EBIT | -122M | -177M | -192M | -97M | -6.3M |
| Interest Expense | 0.2M | 21M | 25M | 26M | 25M |
| Net Income | -129M | -204M | -236M | 62M | -108M |
| EPS | -1.48 | -2.20 | -2.47 | 0.62 | -1.04 |
| Filing Date | 2021-06-25 | 2022-06-21 | 2023-06-16 | 2024-06-14 | 2025-06-10 |
Income Statement Evolution
From 2021 to 2025, Elastic N.V. (ESTC) saw a favorable revenue growth of 144%, reaching $1.48B in 2025. Gross profit increased accordingly, maintaining a strong gross margin of 74.39%. However, net income showed volatility, with negative results in 2023 and 2025, despite a positive net income in 2024. Margins reflect this instability as the net margin remained negative at -7.29% in 2025.
Is the Income Statement Favorable?
The 2025 income statement reveals mixed fundamentals. While revenue and gross profit growth are favorable, the company recorded a net loss of $108M and a negative EBIT margin of -0.42%. Interest expenses are well controlled at 1.71% of revenue, but operating losses persist. Overall, 71% of the income statement metrics are favorable, supporting a generally favorable evaluation despite recent profitability challenges.
Financial Ratios
The table below presents key financial ratios for Elastic N.V. (ESTC) over the fiscal years 2021 to 2025, reflecting profitability, valuation, liquidity, leverage, and operational efficiency:
| Ratios | 2021 | 2022 | 2023 | 2024 | 2025 |
|---|---|---|---|---|---|
| Net Margin | -21% | -24% | -22% | 5% | -7% |
| ROE | -29% | -49% | -59% | 8% | -12% |
| ROIC | -24% | -16% | -21% | 5% | -3% |
| P/E | -81.3 | -34.6 | -22.9 | 165.0 | -82.7 |
| P/B | 23.3 | 17.0 | 13.5 | 13.8 | 9.6 |
| Current Ratio | 1.42 | 1.96 | 1.78 | 1.76 | 1.92 |
| Quick Ratio | 1.42 | 1.96 | 1.78 | 1.76 | 1.92 |
| D/E | 0.06 | 1.43 | 1.49 | 0.80 | 0.64 |
| Debt-to-Assets | 3% | 36% | 34% | 26% | 23% |
| Interest Coverage | -700 | -8.4 | -8.7 | -5.0 | -2.2 |
| Asset Turnover | 0.63 | 0.52 | 0.61 | 0.57 | 0.57 |
| Fixed Asset Turnover | 17.7 | 26.4 | 42.6 | 48.8 | 51.3 |
| Dividend Yield | 0 | 0 | 0 | 0 | 0 |
All figures are approximated and expressed in compact numeric or percentage format as appropriate.
Evolution of Financial Ratios
From 2021 to 2025, Elastic N.V. experienced fluctuating profitability with Return on Equity (ROE) remaining negative and deteriorating from -28.7% in 2021 to -11.7% in 2025, indicating persistent losses but some improvement. The Current Ratio showed an overall increase, reaching 1.92 in 2025, suggesting enhanced liquidity. The Debt-to-Equity Ratio decreased notably from 1.49 in 2023 to 0.64 in 2025, reflecting a reduction in financial leverage.
Are the Financial Ratios Favorable?
In 2025, profitability ratios such as net margin (-7.29%) and ROE (-11.66%) were unfavorable, highlighting ongoing losses. Liquidity ratios were favorable, with a strong current and quick ratio of 1.92, supporting short-term financial stability. Leverage was neutral, with a moderate debt-to-equity of 0.64 and favorable debt-to-assets at 22.95%. Efficiency showed mixed signals: favorable fixed asset turnover at 51.28 but neutral asset turnover at 0.57. Market valuation ratios included a favorable P/E despite negative earnings, but an unfavorable high price-to-book ratio at 9.64. Overall, the financial ratios present a neutral profile.
Shareholder Return Policy
Elastic N.V. does not pay dividends, reflecting its ongoing net losses and reinvestment focus amid a high-growth phase. The company has no dividend payout, and no share buyback programs are reported, consistent with prioritizing cash preservation for operations and growth initiatives.
This approach aligns with long-term value creation for shareholders by emphasizing investment over immediate returns. However, the absence of distributions means investors rely on capital gains, which depend on future profitability and sustainable cash flow improvements.
Score analysis
The following radar chart presents an overview of Elastic N.V.’s key financial scores as of 2026:
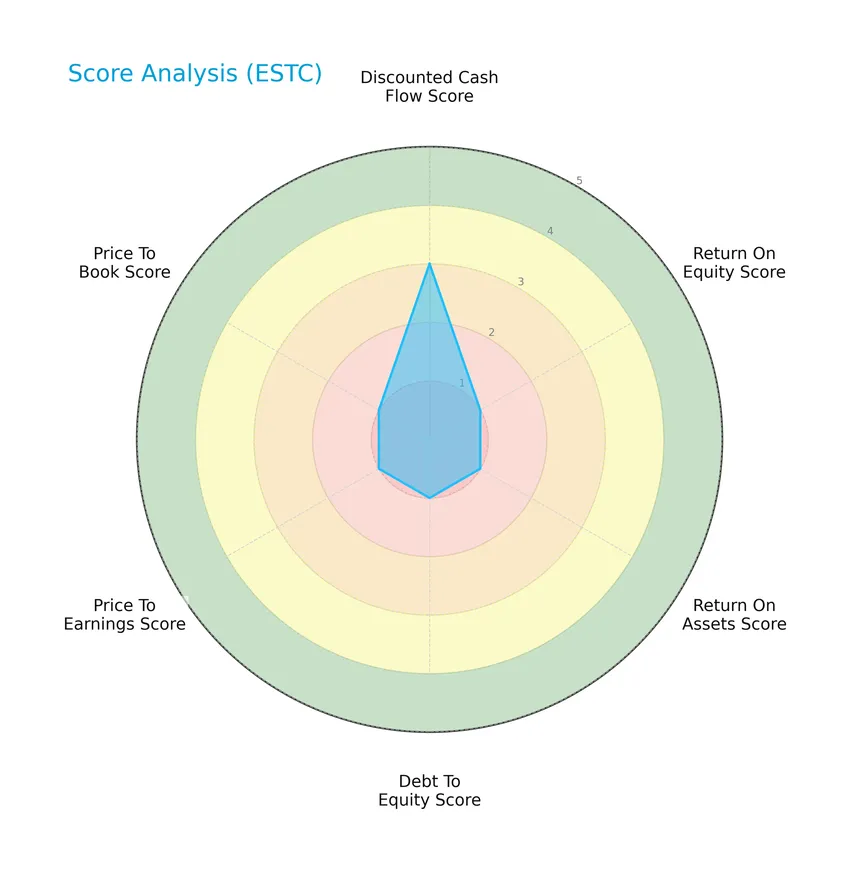
Elastic N.V. shows a moderate discounted cash flow score of 3, while all other metrics—including return on equity, return on assets, debt to equity, price to earnings, and price to book ratios—are rated very unfavorable with scores of 1, indicating significant financial challenges across these areas.
Analysis of the company’s bankruptcy risk
Elastic N.V.’s Altman Z-Score places it in the safe zone, indicating a low risk of bankruptcy and financial distress:

Is the company in good financial health?
The Piotroski diagram illustrates Elastic N.V.’s financial health based on a score of 4, reflecting an average status:

With a Piotroski Score of 4, Elastic N.V. demonstrates moderate financial strength, suggesting neither a strong nor a weak financial position according to this metric.
Competitive Landscape & Sector Positioning
This sector analysis will examine Elastic N.V.’s strategic positioning, revenue segments, key products, and main competitors. I will assess whether Elastic N.V. holds a competitive advantage over its peers in the software application industry.
Strategic Positioning
Elastic N.V. maintains a concentrated product portfolio focused on its Elastic Stack software suite, generating over $1.38B from subscriptions and $99M from professional services in 2025. Geographically, it shows moderate diversification, with 55% of revenues from the US ($836M) and 45% from non-US markets ($647M).
Revenue by Segment
This pie chart illustrates Elastic N.V.’s revenue breakdown by segment for the fiscal year 2025, highlighting the contribution of Subscription and Professional Services.
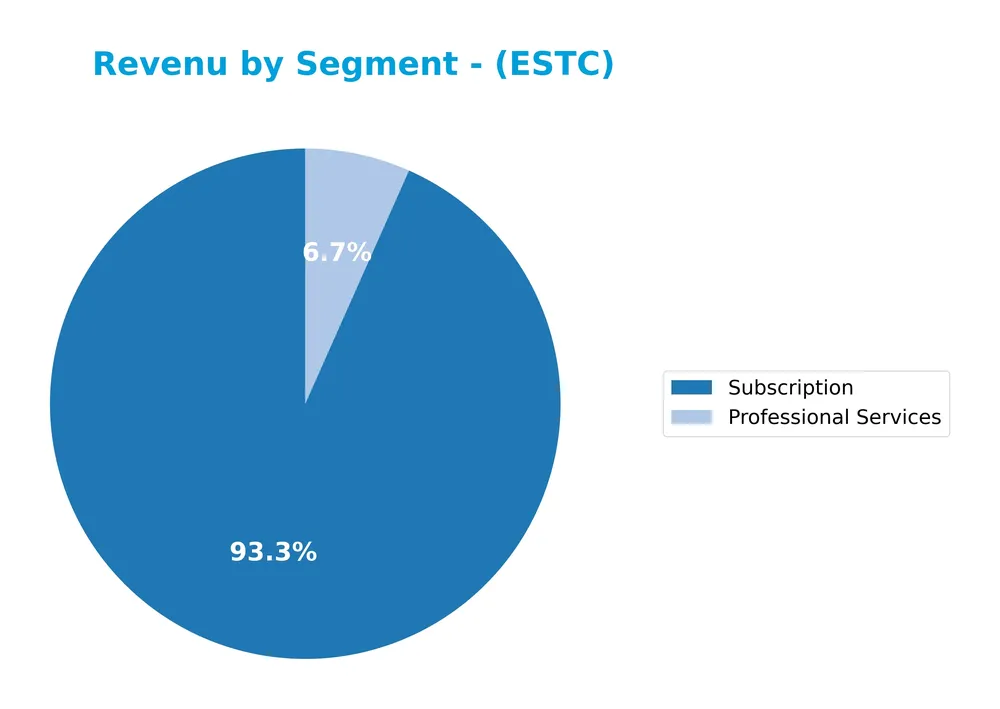
Elastic’s revenue is predominantly driven by the Subscription segment, which reached $1.38B in 2025, showing consistent growth from $248M in 2019. Professional Services, while smaller at $99M in 2025, also grew steadily. The Subscription business demonstrates strong acceleration, indicating a solid recurring revenue base, though the high concentration in this segment suggests some dependency risk if growth slows.
Key Products & Brands
The following table summarizes Elastic N.V.’s key products and brands with their descriptions:
| Product | Description |
|---|---|
| Elastic Stack | A suite of software products for data ingestion, storage, search, analysis, and visualization across multi-cloud environments. |
| Elasticsearch | A distributed, real-time search and analytics engine and data store for textual, numerical, geospatial, structured, and unstructured data. |
| Kibana | A user interface for management, configuration, and visualization of data within the Elastic Stack. |
| Beats | Single-purpose data shippers that send data from edge machines to Elasticsearch or Logstash. |
| Elastic Agent | Provides integrated host protection and central management services. |
| Logstash | A data processing pipeline tool for ingesting data into Elasticsearch or other storage systems. |
| Software Solutions | Applications on the Elastic Stack addressing app search, workplace search, logging, metrics, application performance management, and synthetic monitoring. |
Elastic N.V.’s product portfolio centers on the Elastic Stack, supporting diverse data management needs with scalable cloud-native software and specialized solutions for search, analytics, and monitoring.
Main Competitors
There are 33 competitors in the sector, with the table below listing the top 10 leaders by market capitalization:
| Competitor | Market Cap. |
|---|---|
| Salesforce, Inc. | 242.5B |
| Shopify Inc. | 209.6B |
| AppLovin Corporation | 209.0B |
| Intuit Inc. | 175.2B |
| Uber Technologies, Inc. | 172.2B |
| ServiceNow, Inc. | 153.0B |
| Cadence Design Systems, Inc. | 84.5B |
| Snowflake Inc. | 73.4B |
| Autodesk, Inc. | 61.2B |
| Workday, Inc. | 54.9B |
Elastic N.V. ranks 26th among 33 competitors, with a market capitalization approximately 3.12% of the top player, Salesforce. It is positioned below both the average market cap of the top 10 competitors (143.6B) and the sector median (18.8B). The company maintains a 12.93% market cap advantage over its closest competitor above, indicating a modest gap in scale.
Comparisons with competitors
Check out how we compare the company to its competitors:
Does Elastic have a competitive advantage?
Elastic N.V. currently does not present a strong competitive advantage, as its return on invested capital (ROIC) is below its weighted average cost of capital (WACC), indicating value destruction despite growing profitability. The company’s profitability remains slightly unfavorable, reflecting challenges in generating excess returns on capital invested.
Looking ahead, Elastic’s expansion in multi-cloud technology and its comprehensive Elastic Stack software portfolio targeting diverse data types and applications position it well for future growth opportunities. Continued development of platform solutions and geographic revenue growth, especially outside the US, support a positive outlook for market and product expansion.
SWOT Analysis
This SWOT analysis highlights Elastic N.V.’s key internal and external factors to inform investment decisions.
Strengths
- Strong revenue growth (17% YoY, 144% over 5 years)
- Robust gross margin (74%)
- Leading product portfolio in search and analytics software
Weaknesses
- Negative net margin (-7.3%)
- Unfavorable returns (ROE -11.7%, ROIC -3.5%)
- High price-to-book ratio (9.64)
Opportunities
- Expanding multi-cloud adoption
- Growing international sales (Non-US revenue rising steadily)
- Increasing demand for data analytics and security solutions
Threats
- Intense competition in cloud and software sectors
- Economic uncertainty impacting IT budgets
- Potential margin pressure from high operating expenses
Elastic N.V. demonstrates strong growth and product leadership but faces profitability challenges and valuation concerns. Strategic focus should be on improving margins and leveraging global expansion while managing competitive and economic risks.
Stock Price Action Analysis
The weekly stock chart for Elastic N.V. (ESTC) over the past 12 months displays significant price fluctuations and trend developments:
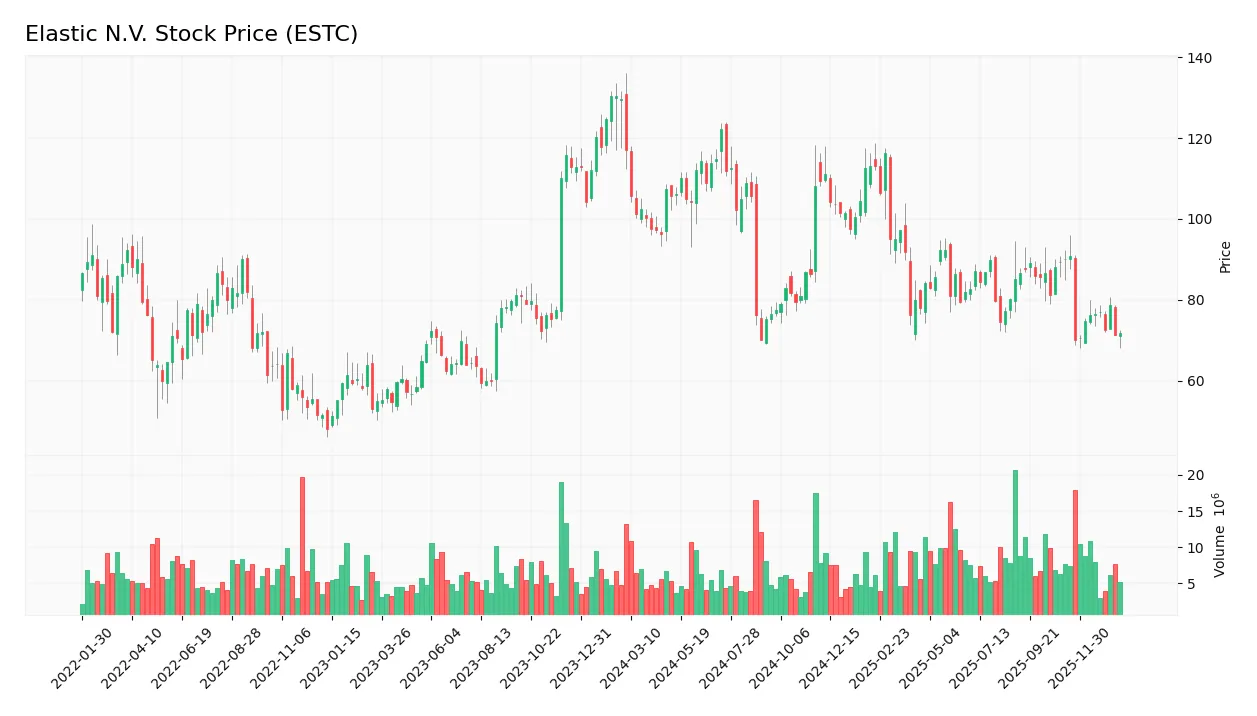
Trend Analysis
Over the past 12 months, ESTC’s stock price declined by 38.65%, indicating a bearish trend. The price ranged between a high of 122.27 and a low of 70.04, with volatility measured by a standard deviation of 13.76. The trend shows deceleration, suggesting the downtrend may be losing momentum.
Volume Analysis
Trading volume over the last three months is increasing, with a total buyer volume of 67.1M versus seller volume of 29.5M, reflecting a buyer-dominant market at 69.45%. This rising volume suggests growing investor interest and potential accumulation despite the prevailing bearish price trend.
Target Prices
The consensus target prices for Elastic N.V. indicate a positive outlook among analysts.
| Target High | Target Low | Consensus |
|---|---|---|
| 134 | 76 | 108 |
Analysts expect Elastic’s stock price to trade between 76 and 134, with an average target around 108, reflecting moderate growth potential.

Don’t Let Luck Decide Your Entry Point
Optimize your entry points with our advanced ProRealTime indicators. You’ll get efficient buy signals with precise price targets for maximum performance. Start outperforming now!
Analyst & Consumer Opinions
This section examines the latest analyst ratings and consumer feedback surrounding Elastic N.V. (ESTC).
Stock Grades
The following table presents the latest verified stock grades for Elastic N.V. from reputable financial institutions:
| Grading Company | Action | New Grade | Date |
|---|---|---|---|
| Barclays | Maintain | Overweight | 2026-01-12 |
| RBC Capital | Maintain | Outperform | 2026-01-05 |
| Jefferies | Maintain | Buy | 2026-01-05 |
| Citigroup | Maintain | Buy | 2025-11-24 |
| Scotiabank | Maintain | Sector Perform | 2025-11-21 |
| Piper Sandler | Maintain | Overweight | 2025-11-21 |
| Wedbush | Maintain | Outperform | 2025-11-21 |
| B of A Securities | Maintain | Neutral | 2025-11-21 |
| Guggenheim | Maintain | Buy | 2025-11-21 |
| Jefferies | Maintain | Buy | 2025-11-21 |
Overall, the grades show a consistent pattern of positive sentiment with multiple “Buy,” “Outperform,” and “Overweight” ratings maintained, reflecting confidence in the stock’s prospects across major analysts.
Consumer Opinions
Consumer sentiment around Elastic N.V. (ESTC) reveals a mix of appreciation and areas for improvement, reflecting its evolving market position.
| Positive Reviews | Negative Reviews |
|---|---|
| Excellent scalability and flexibility in search solutions. | Customer support response times can be slow. |
| Strong open-source community backing enhances innovation. | Pricing structure may be complex for smaller businesses. |
| Robust data analytics capabilities improve decision-making. | Occasional bugs reported in latest software updates. |
Overall, consumers praise Elastic N.V. for its powerful and adaptable technology, while some express concerns about support and pricing complexity, indicating opportunities for the company to enhance user experience and accessibility.
Risk Analysis
Below is a table summarizing key risks associated with Elastic N.V., highlighting their probability and potential impact on investors:
| Category | Description | Probability | Impact |
|---|---|---|---|
| Financial Health | Negative net margin (-7.29%) and return on equity (-11.66%) indicate ongoing profitability issues. | High | High |
| Valuation | Elevated price-to-book ratio (9.64) suggests possible overvaluation risk amid negative earnings. | Medium | Medium |
| Debt and Liquidity | Moderate debt-to-equity ratio (0.64) with unfavorable interest coverage (-0.25) risks financial strain. | Medium | High |
| Market Volatility | Beta of 0.925 indicates stock price closely follows market, exposing it to sector downturns. | Medium | Medium |
| Growth and Competition | Operating in a competitive software application sector with pressure to innovate and retain clients. | High | Medium |
The most pressing risks for Elastic N.V. stem from its continued unprofitability and weak returns, despite a solid liquidity position. Its Altman Z-Score of 3.23 places it in the safe zone, reducing bankruptcy risk, but the average Piotroski Score of 4 signals moderate financial strength. Investors should monitor profitability trends and market valuation carefully.
Should You Buy Elastic N.V.?
Elastic N.V. appears to be a company with deteriorating profitability but improving operational efficiency, suggesting a profile of value destruction despite a growing return on invested capital. While the leverage profile seems manageable with a safe Altman Z-Score, the overall financial rating could be seen as weak, reflecting cautious investor sentiment.
Strength & Efficiency Pillars
Elastic N.V. exhibits mixed financial health with a strong Altman Z-score of 3.23, placing it firmly in the safe zone, which indicates low bankruptcy risk. The company’s gross margin stands at an impressive 74.39%, underscoring operational efficiency. Liquidity metrics are robust, with a current and quick ratio of 1.92 each, reflecting solid short-term financial stability. However, profitability remains challenged, with a negative ROE of -11.66% and ROIC of -3.45%, trailing the WACC at 7.85%, signaling the company is currently a value destroyer rather than creator.
Weaknesses and Drawbacks
Elastic faces significant profitability concerns, reflected in a net margin of -7.29% and EBIT margin of -0.42%, which weigh heavily on earnings quality. The company’s valuation metrics raise caution, with a high price-to-book ratio of 9.64 indicating expensive equity relative to book value. Interest coverage is negative at -0.25, heightening financial risk despite moderate debt-to-equity at 0.64. Market pressure is evident as the stock has declined 38.65% overall with a bearish trend, despite recent buyer dominance, suggesting investor uncertainty and potential liquidity risks.
Our Verdict about Elastic N.V.
The long-term fundamental profile of Elastic N.V. appears unfavorable due to ongoing losses and value destruction despite strong liquidity and operational margins. While the recent period shows buyer dominance and increased volume, the overall bearish trend and weak profitability metrics suggest caution. Therefore, despite pockets of strength, Elastic’s profile may appear speculative and might suggest a wait-and-see approach for more favorable entry points.
Disclaimer: This content is for informational purposes only and does not constitute financial, investment, or other professional advice. Investing in financial markets involves a significant risk of loss, and past performance is not indicative of future results.
Additional Resources
- Elastic: AI Tailwinds And Undervalued (NYSE:ESTC) – Seeking Alpha (Jan 22, 2026)
- New Elastic tools let companies build AI agents on their own data – Stock Titan (Jan 22, 2026)
- Elastic to Present at Upcoming Investor Conference – Business Wire (Jan 06, 2026)
- Elastic NV (ESTC) Q2 2026 Earnings Call Highlights: Strong Revenue Growth and AI Expansion … – Yahoo Finance (Nov 20, 2025)
- Elastic (NYSE:ESTC) Launches Agent Builder for Enterprise AI Agent Development – Intellectia AI (Jan 22, 2026)
For more information about Elastic N.V., please visit the official website: elastic.co