Home > Analyses > Utilities > Edison International
Edison International powers the lives of 15 million Californians, weaving electricity into every corner of daily life. As a regulated electric utility, it commands a vast transmission and distribution network spanning tens of thousands of circuit-miles. The company pairs its century-plus heritage with innovation, reinforcing its reputation for reliable service and energy solutions. But as market dynamics evolve, I ask: does Edison’s financial foundation still justify its current valuation and growth prospects?

Table of contents
Business Model & Company Overview
Edison International, founded in 1886 and based in Rosemead, California, stands as a dominant player in the regulated electric sector. It powers 15M customers across Southern, Central, and Coastal California through an extensive network of transmission lines and substations. The company’s ecosystem integrates generation, distribution, and energy solutions, creating a seamless service platform that supports residential, commercial, and industrial users alike.
The company’s revenue engine balances regulated electricity sales with value-added energy services, leveraging about 70K circuit-miles of overhead and underground lines. Edison International strategically anchors its presence in a high-demand U.S. market, benefiting from steady regulatory frameworks. Its economic moat lies in its vast infrastructure and regulated market position, securing long-term cash flows and shaping California’s energy future.
Financial Performance & Fundamental Metrics
I analyze Edison International’s income statement, key financial ratios, and dividend payout policy to reveal its operational efficiency and shareholder value approach.
Income Statement
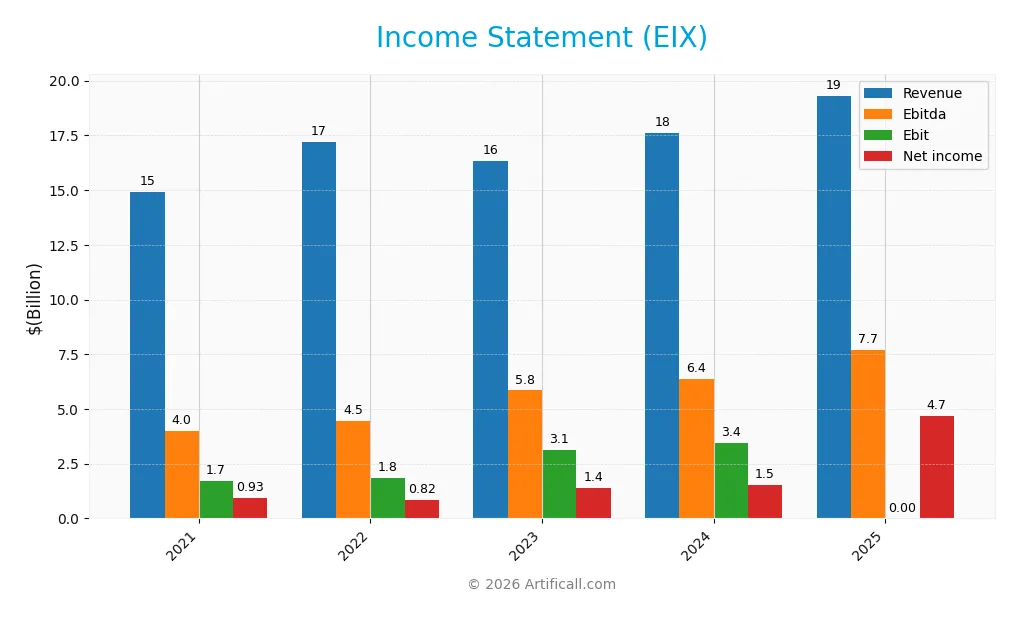
This table summarizes Edison International’s key income statement items for fiscal years 2021 through 2025, highlighting revenue, expenses, and profitability metrics.
| 2021 | 2022 | 2023 | 2024 | 2025 | |
|---|---|---|---|---|---|
| Revenue | 14.9B | 17.2B | 16.3B | 17.6B | 19.3B |
| Cost of Revenue | 9.2B | 11.1B | 9.6B | 10.4B | 0 |
| Operating Expenses | 4.2B | 4.6B | 4.1B | 4.3B | 12.2B |
| Gross Profit | 5.7B | 6.1B | 6.7B | 7.2B | 0 |
| EBITDA | 4.0B | 4.5B | 5.8B | 6.4B | 7.7B |
| EBIT | 1.7B | 1.8B | 3.1B | 3.4B | 0 |
| Interest Expense | 925M | 1.2B | 1.6B | 1.9B | 1.5B |
| Net Income | 925M | 824M | 1.4B | 1.5B | 4.7B |
| EPS | 2.00 | 1.61 | 3.13 | 3.33 | 11.58 |
| Filing Date | 2022-02-24 | 2023-02-23 | 2024-02-22 | 2025-02-27 | 2026-02-18 |
Income Statement Evolution
Edison International’s revenue rose steadily by 29.6% from 2021 to 2025, with a notable 9.76% jump in the last year. Net income grew sharply, increasing over 400% across the period. Despite these gains, gross profit and EBIT margins dropped significantly in 2025, signaling margin pressure even as net margin expanded to 24.3%.
Is the Income Statement Favorable?
The 2025 income statement reflects strong fundamentals, driven by a 24.3% net margin and robust net income growth. Interest expense improved favorably, supporting profitability despite higher operating expenses. However, the absence of reported gross profit and EBIT in 2025 flags margin erosion risks. Overall, the income statement performance leans favorable but warrants cautious monitoring of underlying cost structures.
Financial Ratios
The table below presents key financial ratios for Edison International (EIX) over the past five fiscal years, helping to assess profitability, liquidity, valuation, and leverage trends:
| Ratios | 2021 | 2022 | 2023 | 2024 | 2025 |
|---|---|---|---|---|---|
| Net Margin | 6.21% | 4.79% | 8.61% | 8.78% | 24.34% |
| ROE | 5.82% | 5.27% | 9.08% | 9.93% | 26.74% |
| ROIC | 2.11% | 2.04% | 3.17% | 3.61% | 33.46% |
| P/E | 28.04 | 29.42 | 19.46 | 19.93 | 4.92 |
| P/B | 1.63 | 1.55 | 1.77 | 1.98 | 1.31 |
| Current Ratio | 0.64 | 0.68 | 0.79 | 0.85 | 0.05 |
| Quick Ratio | 0.59 | 0.64 | 0.73 | 0.78 | 0.05 |
| D/E | 1.86 | 2.12 | 2.28 | 2.43 | 0.20 |
| Debt-to-Assets | 39.5% | 42.4% | 43.2% | 44.1% | 13.8% |
| Interest Coverage | 1.60 | 1.27 | 1.63 | 1.57 | -4.61 |
| Asset Turnover | 0.20 | 0.22 | 0.20 | 0.21 | 0.78 |
| Fixed Asset Turnover | 0.28 | 0.31 | 0.29 | 0.29 | 0.00 |
| Dividend Yield | 3.94% | 4.74% | 4.46% | 4.17% | 0.59% |
The current ratio and quick ratio in 2025 show an unusually low liquidity position. Interest coverage turns negative in 2025, signaling potential difficulty in covering interest expenses. Asset turnover jumps significantly in 2025, while fixed asset turnover drops to zero, indicating possible changes in asset base or reporting.
Evolution of Financial Ratios
Edison International’s Return on Equity (ROE) improved significantly, rising to 26.7% in 2025 from under 10% in prior years. The Current Ratio, however, declined sharply to 0.05, indicating deteriorating liquidity. Debt-to-Equity Ratio improved notably, dropping to 0.20 in 2025, reflecting reduced leverage and better capital structure stability. Profitability margins expanded steadily over the period.
Are the Financial Ratios Favorable?
In 2025, Edison International shows favorable profitability with a high ROE of 26.7% and solid Return on Invested Capital (ROIC) at 33.5%, well above the 7.1% WACC. Leverage ratios are conservative, with debt-to-equity at 0.20 and debt-to-assets at 13.85%. Liquidity ratios are unfavorable, with current and quick ratios near 0.05, signaling potential short-term financial stress. Market valuation metrics like P/E of 4.92 and P/B of 1.31 are attractive. Overall, 57% of ratios are favorable, but liquidity and interest coverage remain concerns.
Shareholder Return Policy
Edison International pays dividends with a low payout ratio near 3%, and a modest dividend yield below 0.6% in 2025. The dividend per share shows a steady increase, supported by positive net income, though free cash flow coverage is negative, signaling potential sustainability concerns.
The company also engages in share buybacks, complementing its shareholder returns. Balancing dividends and buybacks amid tight free cash flow suggests a cautious approach. This policy appears aligned with preserving long-term value, but free cash flow deficits warrant close monitoring.
Score analysis
The following radar chart illustrates Edison International’s key financial scores across multiple valuation and performance metrics:

Edison International scores very low on discounted cash flow, return on equity, return on assets, price-to-earnings, and price-to-book metrics, signaling weak profitability and valuation. Its debt-to-equity score stands out as very favorable, indicating conservative leverage management.
Analysis of the company’s bankruptcy risk
Edison International’s Altman Z-Score places it in the grey zone, suggesting a moderate risk of financial distress and potential bankruptcy:

Is the company in good financial health?
The Piotroski Score diagram offers insight into Edison International’s overall financial strength and stability:

With a score of 7, Edison International demonstrates strong financial health, reflecting solid profitability, efficient asset use, and prudent leverage despite some valuation weaknesses.
Competitive Landscape & Sector Positioning
This section examines Edison International’s strategic positioning, revenue segments, key products, and main competitors in the utilities sector. I will assess whether Edison International holds a competitive advantage over its peers.
Strategic Positioning
Edison International focuses primarily on regulated electric utility services in California, serving 15M customers across diverse sectors. Its revenue relies heavily on electric utility operations, with a smaller contribution from competitive power generation, indicating a concentrated product portfolio and regional exposure.
Revenue by Segment
This pie chart illustrates Edison International’s revenue distribution by business segment for fiscal year 2011, highlighting the relative contributions of each operational area.
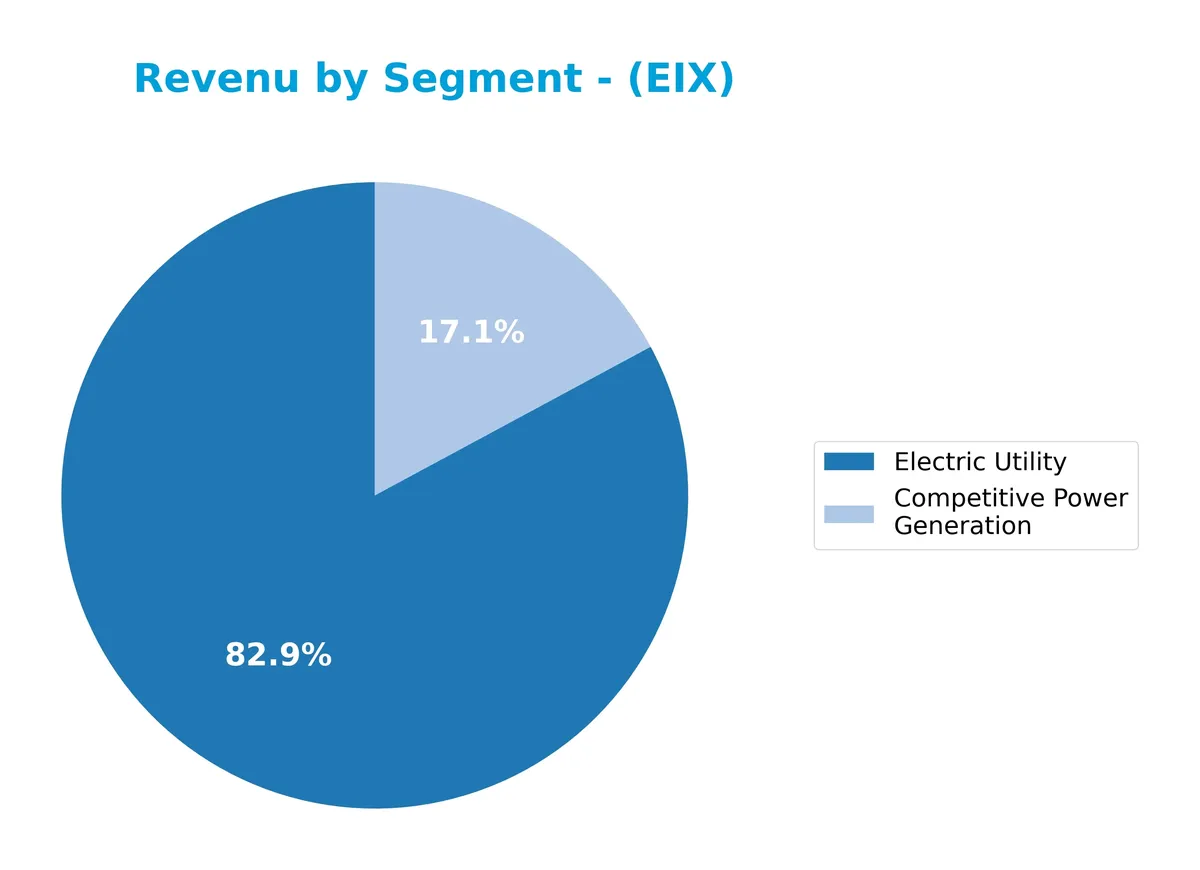
In 2011, Edison International’s Electric Utility segment dominated with $10.6B, reflecting its core stable cash flow. Competitive Power Generation declined to $2.2B from $2.4B in 2010, signaling a slight slowdown. Negative contributions from Parent and Other segments remain minimal. The business relies heavily on its utility operations, emphasizing a concentrated revenue base with modest exposure to power generation volatility.
Key Products & Brands
Edison International operates through key products and brands focused on power generation and distribution:
| Product | Description |
|---|---|
| Electric Utility | Delivers electricity to 15M customers across Southern, Central, and Coastal California through a vast distribution network. |
| Competitive Power Generation | Generates electric power competitively, contributing over $2B in annual revenue, supporting diverse energy needs. |
| Parent And Other | Corporate-level activities with minor negative revenue impact, reflecting non-operating items or adjustments. |
Edison International’s core business revolves around regulated electric utility services and competitive power generation. The company’s extensive infrastructure and customer base underpin stable revenue streams in a mature, capital-intensive sector.
Main Competitors
There are 23 competitors in the Regulated Electric industry. The table lists the top 10 leaders by market capitalization:
| Competitor | Market Cap. |
|---|---|
| NextEra Energy, Inc. | 169B |
| The Southern Company | 96B |
| Duke Energy Corporation | 91B |
| American Electric Power Company, Inc. | 62B |
| Dominion Energy, Inc. | 51B |
| Exelon Corporation | 44B |
| Xcel Energy Inc. | 44B |
| Entergy Corporation | 42B |
| Public Service Enterprise Group Incorporated | 40B |
| Consolidated Edison, Inc. | 36B |
Edison International ranks 18th among 23 competitors. Its market cap is about 16% of the leader, NextEra Energy. The company sits below both the average market cap of the top 10 (67.5B) and the sector median (34B). Edison International maintains a moderate 6.46% gap to the next competitor above, reflecting a competitive but lower scale position.
Comparisons with competitors
Check out how we compare the company to its competitors:
Does Edison International have a competitive advantage?
Edison International presents a strong competitive advantage, evidenced by a ROIC exceeding WACC by 26.4%, signaling consistent value creation and efficient capital use. Its growing ROIC trend further confirms a sustainable economic moat, highlighting increasing profitability over 2021-2025.
Looking ahead, Edison International’s extensive transmission and distribution network supports expansion opportunities in California’s diverse energy markets. The company’s scale and infrastructure position it well to capitalize on evolving energy demands and regulatory environments.
SWOT Analysis
This SWOT analysis highlights Edison International’s key strategic factors to guide investment decisions.
Strengths
- strong net margin of 24%
- high ROIC at 33% well above WACC
- stable, regulated electric utility with 15M customers
Weaknesses
- very low current and quick ratios at 0.05
- negative interest coverage ratio
- unfavorable gross and EBIT margins
Opportunities
- 10%+ recent revenue growth
- expanding energy solutions market
- rising net income and EPS growth over 400% overall period
Threats
- regulatory risk in California utilities
- high capital expenditure needs
- competition from renewables and tech disruptors
Edison International’s robust profitability and strong moat position it well for long-term value creation. However, liquidity constraints and regulatory exposure warrant caution. The company should focus on capital discipline and innovation to mitigate risks and capitalize on growth opportunities.
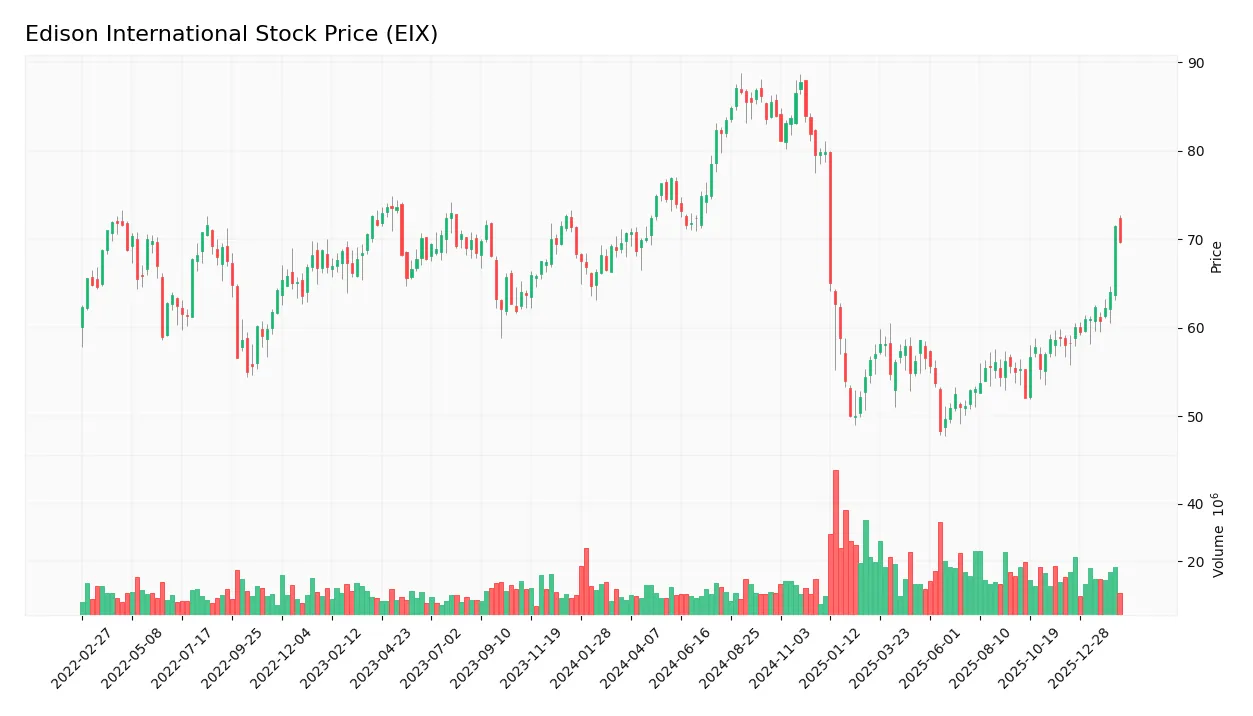
Stock Price Action Analysis
The weekly stock chart of Edison International (EIX) highlights recent price movements and volatility patterns from late 2025 into early 2026:
Trend Analysis
Over the past 12 months, Edison International’s stock declined by 1.46%, indicating a neutral trend despite the numeric bearish classification. The trend accelerated, with prices fluctuating between 48.32 and 87.75, and volatility remained elevated at a 12.13 standard deviation.
Volume Analysis
In the last three months, trading volume increased, driven by strong buyer dominance at 74.24%. Buyer volume outpaced sellers 129M to 45M, signaling heightened market participation and positive investor sentiment during this period.
Target Prices
Analysts set a clear target consensus for Edison International, reflecting moderate upside potential.
| Target Low | Target High | Consensus |
|---|---|---|
| 57 | 78 | 64.2 |
The target range of $57 to $78 indicates cautious optimism, with a consensus price suggesting a 10-15% upside from current levels.

Don’t Let Luck Decide Your Entry Point
Optimize your entry points with our advanced ProRealTime indicators. You’ll get efficient buy signals with precise price targets for maximum performance. Start outperforming now!
Analyst & Consumer Opinions
This section reviews Edison International’s analyst ratings and consumer feedback to provide a balanced perspective.
Stock Grades
Here are the latest verified analyst grades for Edison International from leading financial firms:
| Grading Company | Action | New Grade | Date |
|---|---|---|---|
| UBS | Downgrade | Neutral | 2026-02-13 |
| JP Morgan | Maintain | Neutral | 2026-01-28 |
| Jefferies | Maintain | Hold | 2026-01-28 |
| Barclays | Maintain | Overweight | 2026-01-22 |
| Wells Fargo | Downgrade | Underweight | 2026-01-20 |
| Morgan Stanley | Maintain | Underweight | 2025-12-17 |
| JP Morgan | Maintain | Neutral | 2025-12-12 |
| UBS | Maintain | Buy | 2025-12-02 |
| Ladenburg Thalmann | Maintain | Neutral | 2025-10-30 |
| Barclays | Maintain | Overweight | 2025-10-29 |
The trend reveals a cautious shift with downgrades from UBS and Wells Fargo, though Barclays remains bullish at Overweight. Most firms maintain Neutral or Hold, reflecting moderate confidence amid mixed signals.
Consumer Opinions
Edison International draws mixed reactions from its customer base, reflecting its complex operational landscape.
| Positive Reviews | Negative Reviews |
|---|---|
| Reliable power supply with minimal outages. | Customer service response times are slow. |
| Transparent billing and clear communication. | High rates compared to regional competitors. |
| Strong commitment to renewable energy. | Occasional delays in infrastructure upgrades. |
Overall, consumers praise Edison International’s reliability and green initiatives. However, slow customer support and pricing remain consistent concerns, signaling areas for operational improvement.
Risk Analysis
Below is a summary table highlighting key risks facing Edison International, including their likelihood and potential impact:
| Category | Description | Probability | Impact |
|---|---|---|---|
| Liquidity Risk | Extremely low current and quick ratios (0.05) indicate tight liquidity. | High | High |
| Interest Coverage | Near-zero interest coverage signals vulnerability to rising rates. | Medium | High |
| Valuation Risk | Very low P/E (4.92) and P/B (1.31) ratios suggest possible undervaluation or market skepticism. | Medium | Medium |
| Financial Distress | Altman Z-Score in grey zone (1.81) implies moderate bankruptcy risk. | Medium | High |
| Dividend Yield | Low dividend yield (0.59%) may disappoint income-focused investors. | High | Medium |
| Operational Risk | Fixed asset turnover of zero flags potential inefficiencies or asset write-downs. | Low | Medium |
Edison’s most urgent risks are its critically weak liquidity and interest coverage ratios, which expose it to financial stress if market conditions tighten. The grey-zone Altman Z-Score further underscores moderate distress risk despite favorable profitability metrics. Investors should monitor liquidity closely and weigh the risk/reward tradeoff given the company’s low valuation multiples and tepid dividend yield.
Should You Buy Edison International?
Edison International appears to be generating strong value creation through a durable competitive moat supported by a significantly growing ROIC versus WACC. While its leverage profile seems manageable, the overall rating could be seen as cautious, reflecting mixed operational efficiency signals.
Strength & Efficiency Pillars
Edison International posts robust profitability, with a net margin of 24.34% and a strong return on equity of 26.74%. Its return on invested capital (ROIC) stands at an impressive 33.46%, comfortably above its weighted average cost of capital (WACC) at 7.1%. This differential confirms the company as a clear value creator. Historically in the utilities sector, such a spread signals sustainable competitive advantage and effective capital allocation. The firm’s growing ROIC trend further reinforces its operational efficiency and long-term value generation.
Weaknesses and Drawbacks
Edison International’s Altman Z-Score of 1.81 places it in the grey zone, indicating moderate bankruptcy risk and warranting caution. The company faces liquidity challenges, reflected in a critically low current ratio of 0.05 and quick ratio of 0.05, signaling potential short-term solvency concerns. Despite a favorable debt-to-equity ratio of 0.2, the interest coverage ratio is negative, which raises red flags about its ability to service debt comfortably. Valuation metrics remain attractive, with a P/E of 4.92 and P/B of 1.31, yet these could mask underlying financial risks amid market volatility.
Our Final Verdict about Edison International
Despite Edison International’s operational strength and status as a value creator, the grey zone Altman Z-Score of 1.81 signals moderate solvency risk that cannot be ignored. This profile may appear attractive given its profitability and valuation, but the liquidity constraints and debt servicing concerns suggest a cautious stance. The recent period shows strong buyer dominance, supporting potential upside, yet investors might consider a wait-and-see approach until financial health improves.
Disclaimer: This content is for informational purposes only and does not constitute financial, investment, or other professional advice. Investing in financial markets involves a significant risk of loss, and past performance is not indicative of future results.
Additional Resources
- Edison International Reports Fourth Quarter and Full-Year 2025 Results – Edison International | Newsroom (Feb 18, 2026)
- Edison International (EIX) Q4 Earnings and Revenues Surpass Estimates – Yahoo Finance (Feb 18, 2026)
- Edison International: Q4 Earnings Snapshot – kare11.com (Feb 18, 2026)
- Edison International, Southern California Edison Declare Dividends – Business Wire (Feb 18, 2026)
- Edison International maps out March and April dividend checks – Stock Titan (Feb 18, 2026)
For more information about Edison International, please visit the official website: edison.com