Home > Analyses > Consumer Defensive > Edgewell Personal Care Company
Edgewell Personal Care Company shapes daily routines worldwide by delivering trusted personal care essentials that millions rely on. As a prominent player in the household and personal products industry, Edgewell’s portfolio spans wet shave, sun and skin care, and feminine care, featuring well-known brands like Schick, Banana Boat, and Playtex. Renowned for innovation and quality, the company’s ability to adapt in a competitive market invites a closer look at whether its current valuation reflects sustainable growth and solid fundamentals.
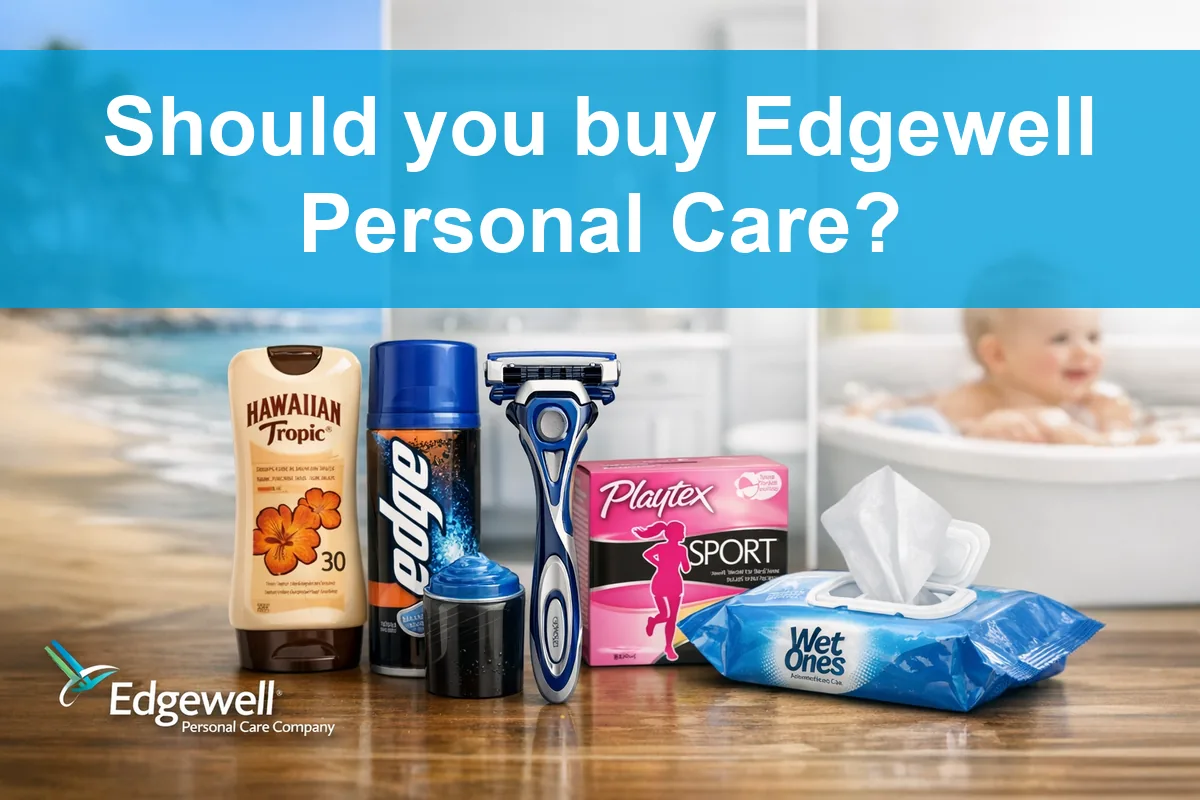
Table of contents
Business Model & Company Overview
Edgewell Personal Care Company, founded in 1772 and headquartered in Shelton, Connecticut, stands as a dominant player in the Household & Personal Products industry. Its portfolio forms an integrated ecosystem spanning wet shave, sun and skin care, and feminine care segments, delivering trusted brands like Schick, Banana Boat, and Playtex worldwide. With 6,700 employees, the company leverages its legacy and innovation to serve diverse consumer needs in personal grooming and protection.
The company’s revenue engine balances recurring sales of razor systems and blades with broad-based skin and feminine care products, generating steady cash flow across the Americas, Europe, and Asia. Its mix of hardware (razor handles) and consumables (blades, wipes, skincare) ensures resilient demand. Edgewell’s extensive brand equity and global footprint create a durable economic moat, positioning it to shape the evolving personal care market confidently.
Financial Performance & Fundamental Metrics
I will analyze Edgewell Personal Care Company’s income statement, key financial ratios, and dividend payout policy to provide a comprehensive view of its fundamentals.
Income Statement
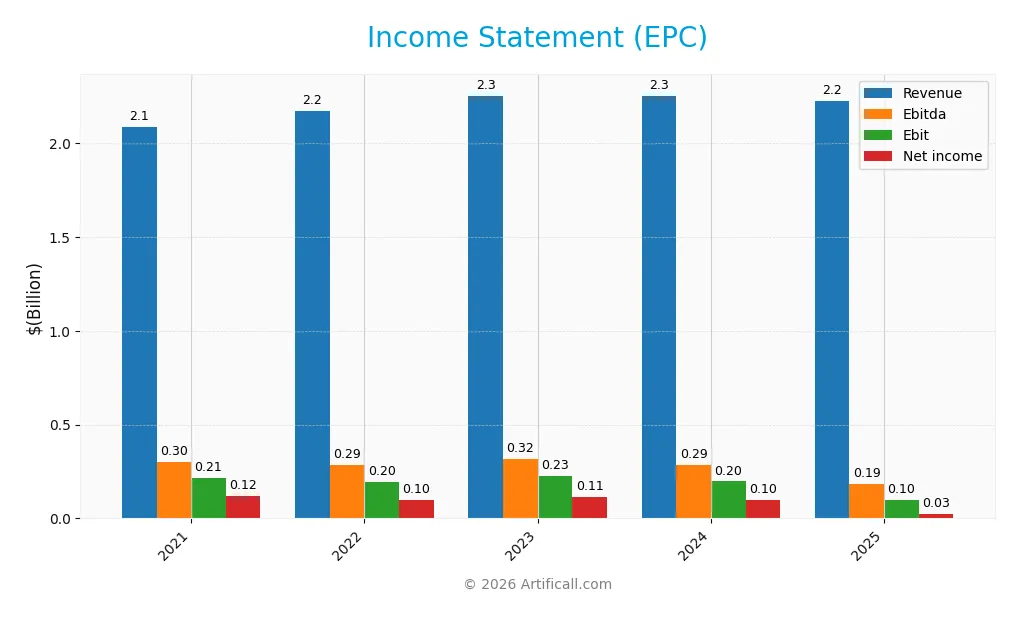
The table below summarizes Edgewell Personal Care Company’s key income statement figures for fiscal years 2021 through 2025, presented in USD.
| 2021 | 2022 | 2023 | 2024 | 2025 | |
|---|---|---|---|---|---|
| Revenue | 2.09B | 2.17B | 2.25B | 2.25B | 2.22B |
| Cost of Revenue | 1.14B | 1.29B | 1.31B | 1.30B | 1.30B |
| Operating Expenses | 711M | 698M | 714M | 756M | 828M |
| Gross Profit | 951M | 881M | 941M | 956M | 925M |
| EBITDA | 302M | 285M | 318M | 285M | 186M |
| EBIT | 215M | 196M | 226M | 197M | 97M |
| Interest Expense | 68M | 71M | 79M | 77M | 73M |
| Net Income | 118M | 100M | 115M | 99M | 25M |
| EPS | 2.15 | 1.87 | 2.24 | 1.98 | 0.53 |
| Filing Date | 2021-11-19 | 2022-11-16 | 2023-11-28 | 2024-11-14 | 2025-11-18 |
Income Statement Evolution
Between 2021 and 2025, Edgewell Personal Care’s revenue showed modest growth of 6.53%, but this slowed and declined by 1.34% in the most recent year. Gross profit margins remained relatively stable at 41.6%, considered favorable, while EBIT and net margins weakened, reflecting operating challenges. Net income declined significantly by 78.44% over the period, with margins deteriorating accordingly.
Is the Income Statement Favorable?
The 2025 income statement reveals unfavorable fundamentals, marked by a revenue decline to $2.22B and net income plunging to $25.4M, down 74% year-on-year. EBIT margin held at a neutral 4.35%, but net margin contracted to 1.14%, showing limited profitability. Interest expenses remain manageable at 3.29% of revenue, yet overall income metrics indicate operational pressures that have adversely impacted profitability and earnings per share.
Financial Ratios
The following table presents key financial ratios of Edgewell Personal Care Company (ticker: EPC) for the fiscal years 2021 through 2025:
| Ratios | 2021 | 2022 | 2023 | 2024 | 2025 |
|---|---|---|---|---|---|
| Net Margin | 5.64% | 4.58% | 5.09% | 4.38% | 1.14% |
| ROE | 7.44% | 6.78% | 7.45% | 6.22% | 1.64% |
| ROIC | 6.05% | 4.57% | 5.42% | 5.07% | 3.00% |
| P/E | 16.76 | 19.96 | 16.50 | 18.32 | 38.07 |
| P/B | 1.25 | 1.35 | 1.23 | 1.14 | 0.62 |
| Current Ratio | 2.12 | 1.75 | 1.84 | 1.66 | 1.76 |
| Quick Ratio | 1.47 | 0.91 | 0.90 | 0.81 | 0.90 |
| D/E | 0.83 | 1.00 | 0.94 | 0.87 | 0.91 |
| Debt-to-Assets | 36% | 39% | 39% | 37% | 38% |
| Interest Coverage | 3.53 | 2.55 | 2.89 | 2.61 | 1.32 |
| Asset Turnover | 0.57 | 0.58 | 0.60 | 0.60 | 0.59 |
| Fixed Asset Turnover | 5.76 | 6.29 | 6.66 | 5.19 | 6.02 |
| Dividend Yield | 1.30% | 1.64% | 1.66% | 1.70% | 3.03% |
Evolution of Financial Ratios
Over the period from 2021 to 2025, Edgewell Personal Care Company’s Return on Equity (ROE) declined significantly from 7.44% in 2021 to 1.64% in 2025, indicating a slowdown in profitability growth. The Current Ratio remained relatively stable, fluctuating between 1.66 and 2.12, suggesting consistent liquidity. The Debt-to-Equity Ratio showed moderate variation, ending at 0.91 in 2025, reflecting a stable but leveraged capital structure.
Are the Financial Ratios Favorable?
In 2025, profitability indicators such as net margin (1.14%) and ROE (1.64%) are considered unfavorable, while the weighted average cost of capital (WACC) at 5.3% is favorable. Liquidity ratios show a favorable Current Ratio of 1.76 but a neutral Quick Ratio of 0.9. Leverage measures including Debt-to-Equity (0.91) and Debt-to-Assets (37.61%) are neutral. Efficiency is mixed with a favorable fixed asset turnover of 6.02 and neutral asset turnover of 0.59. The dividend yield at 3.03% is favorable. Overall, the financial ratios present a neutral stance.
Shareholder Return Policy
Edgewell Personal Care Company maintains a dividend policy with a payout ratio exceeding 100% in 2025 at 115%, accompanied by a 3.03% dividend yield and share buybacks. The dividend per share has risen moderately over recent years, supported but closely matched by free cash flow coverage.
The elevated payout ratio suggests potential risk in sustaining dividends without increased cash flow or earnings. However, the combination of dividends and buybacks indicates a balanced approach aiming to return capital to shareholders, though the sustainability depends on future profitability and cash generation trends.
Score analysis
Here is an overview of Edgewell Personal Care Company’s key financial scores represented in a radar chart:
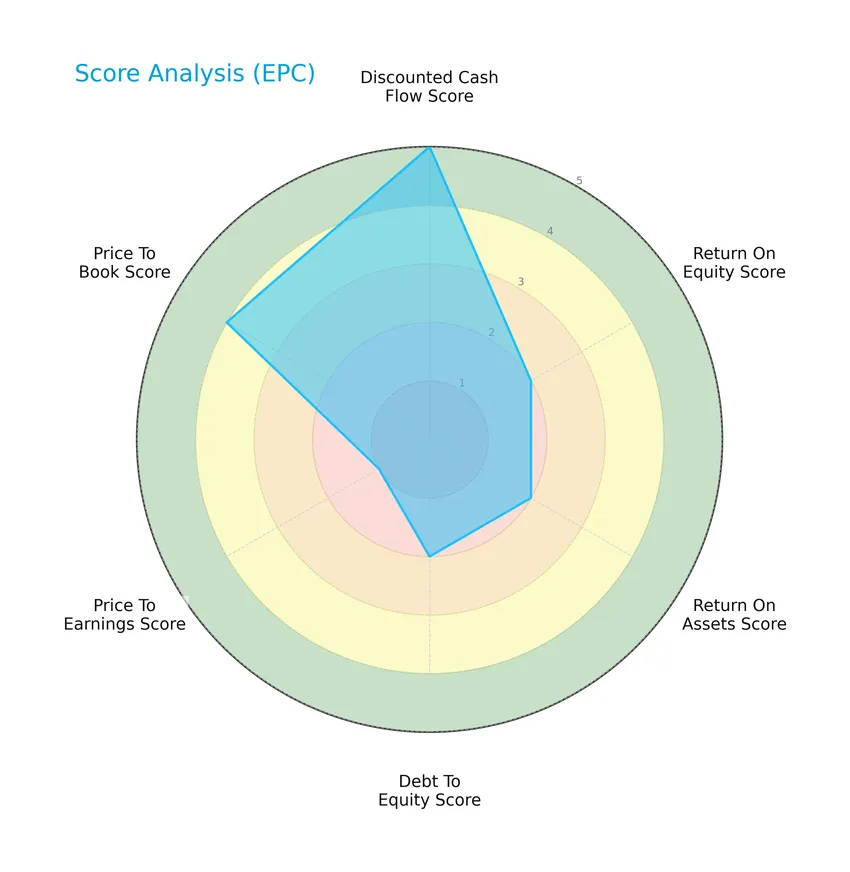
The company shows a very favorable discounted cash flow score of 5, while profitability metrics like return on equity and return on assets stand at moderate levels of 2 each. Debt to equity is also moderate at 2, but the price-to-earnings score is very unfavorable at 1, contrasting with a favorable price-to-book score of 4.
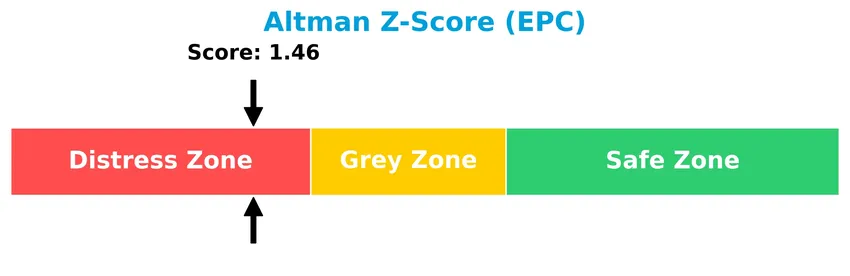
Analysis of the company’s bankruptcy risk
Edgewell Personal Care is currently in the distress zone based on its Altman Z-Score, indicating a higher risk of financial distress and potential bankruptcy:
Is the company in good financial health?
The Piotroski Score diagram provides insight into the company’s financial strength and operational efficiency:

With a Piotroski Score of 6, Edgewell Personal Care is in the average category, suggesting moderate financial health but leaving room for improvement in key performance areas.
Competitive Landscape & Sector Positioning
This sector analysis will examine Edgewell Personal Care Company’s strategic positioning, revenue breakdown, key products, main competitors, competitive advantages, and a SWOT analysis. I will assess whether Edgewell holds a competitive advantage over its peers in the household and personal products industry.
Strategic Positioning
Edgewell Personal Care Company maintains a diversified product portfolio across wet shave, sun and skin care, and feminine care segments, with significant revenue from razors and blades ($1.1B in 2025) and sun care ($459M). Geographically, it balances US ($1.2B) and non-US ($1.0B) markets, reflecting a broad consumer base.
Revenue by Segment
The pie chart illustrates Edgewell Personal Care Company’s revenue distribution by product segment for the fiscal year 2025.
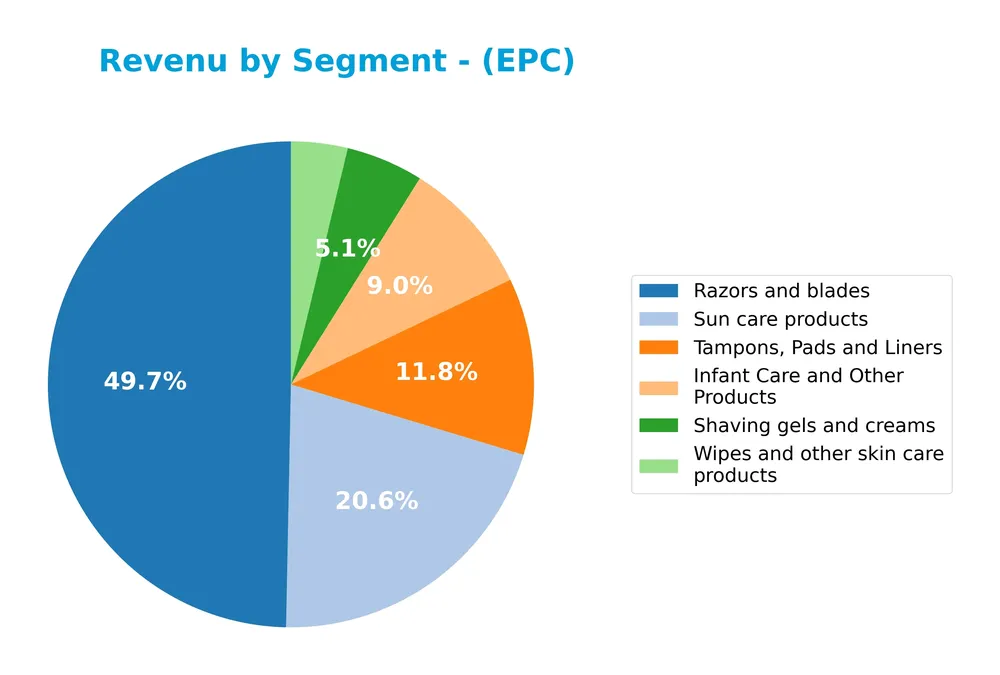
In 2025, razors and blades remain the dominant revenue driver with 1.1B, maintaining steady sales compared to previous years. Sun care products generated 459M, showing slight contraction from 2024’s 484M, while tampons, pads, and liners declined to 262M from 284M. Infant care and other products showed moderate growth to 201M. Shaving gels and creams and wipes/skin care products contribute smaller shares, reflecting a concentrated portfolio with limited diversification risk.
Key Products & Brands
The table below presents Edgewell Personal Care Company’s main products and brands with their respective descriptions:
| Product | Description |
|---|---|
| Razors and blades | Razor systems including handles and refillable blades, disposable shave products for men and women under Schick, Wilkinson Sword, Edge, Skintimate, Shave Guard, and Personna brands. |
| Shaving gels and creams | Products complementing shaving routines, sold under various brands. |
| Sun care products | General protection, sport, kids, baby, tanning, and after-sun products under Banana Boat and Hawaiian Tropic brands. |
| Wipes and other skin care products | Antibacterial hand wipes, sanitizing wipes, hand sanitizer gels under Wet Ones; skin care for men under Bulldog and Jack Black; grooming under Cremo. |
| Tampons, Pads and Liners | Feminine care products including tampons under Playtex Gentle Glide 360°, Playtex Sport, Playtex, and o.b.; pads and liners under Stayfree and Carefree. |
| Infant Care and Other Products | Includes various personal care items for infants and other miscellaneous products. |
Edgewell’s portfolio spans wet shave, sun and skin care, and feminine care segments, supported by well-known brands catering to diverse consumer needs worldwide.
Main Competitors
There are 17 competitors in total, with the table below listing the top 10 leaders by market capitalization:
| Competitor | Market Cap. |
|---|---|
| The Procter & Gamble Company | 331.3B |
| Unilever PLC | 143.2B |
| Colgate-Palmolive Company | 62.6B |
| The Estée Lauder Companies Inc. | 38.5B |
| Kimberly-Clark Corporation | 33.7B |
| Kenvue Inc. | 33.2B |
| Church & Dwight Co., Inc. | 20.2B |
| The Clorox Company | 12.3B |
| e.l.f. Beauty, Inc. | 4.3B |
| Inter Parfums, Inc. | 2.7B |
Edgewell Personal Care Company ranks 14th among 17 competitors, with a market cap roughly 0.28% that of the sector leader, The Procter & Gamble Company. It is positioned below both the average market cap of the top 10 competitors (68.2B) and the sector median (4.3B). The company is notably 56.52% smaller than its next closest competitor above in rank, highlighting a substantial gap in scale.
Comparisons with competitors
Check out how we compare the company to its competitors:
Does EPC have a competitive advantage?
Edgewell Personal Care Company does not currently present a competitive advantage, as it is experiencing declining profitability and is shedding value with a very unfavorable economic moat assessment. Its return on invested capital (ROIC) is significantly below its weighted average cost of capital (WACC), indicating inefficient use of invested capital.
Looking ahead, Edgewell operates in diverse personal care segments including wet shave, sun and skin care, and feminine care, with established brands like Schick, Banana Boat, and Playtex. Future opportunities may arise from expanding product offerings and tapping into new markets, although recent financial trends suggest caution regarding growth prospects.
SWOT Analysis
This SWOT analysis highlights the key internal and external factors affecting Edgewell Personal Care Company, helping investors assess its strategic positioning.
Strengths
- Strong brand portfolio including Schick and Playtex
- Favorable gross margin at 41.6%
- Diversified product segments (Wet shave, Skin care, Feminine care)
Weaknesses
- Declining revenue and net income growth
- Low net margin at 1.14%
- Weak profitability ratios (ROE 1.64%, ROIC 3%)
Opportunities
- Expansion in international markets
- Growth in male grooming and skin care segments
- Innovation in sustainable and health-conscious products
Threats
- Intense competition in personal care industry
- Economic pressures reducing consumer spending
- Financial distress risk indicated by Altman Z-Score in distress zone
Edgewell’s strong brand presence and diversified portfolio provide a solid foundation, but recent financial weaknesses and profitability decline pose challenges. Strategic focus on innovation and international growth, while managing financial risks, is crucial for sustainable value creation.
Stock Price Action Analysis
The weekly stock chart for Edgewell Personal Care Company (EPC) illustrates price movements and volume trends over the past 12 months:
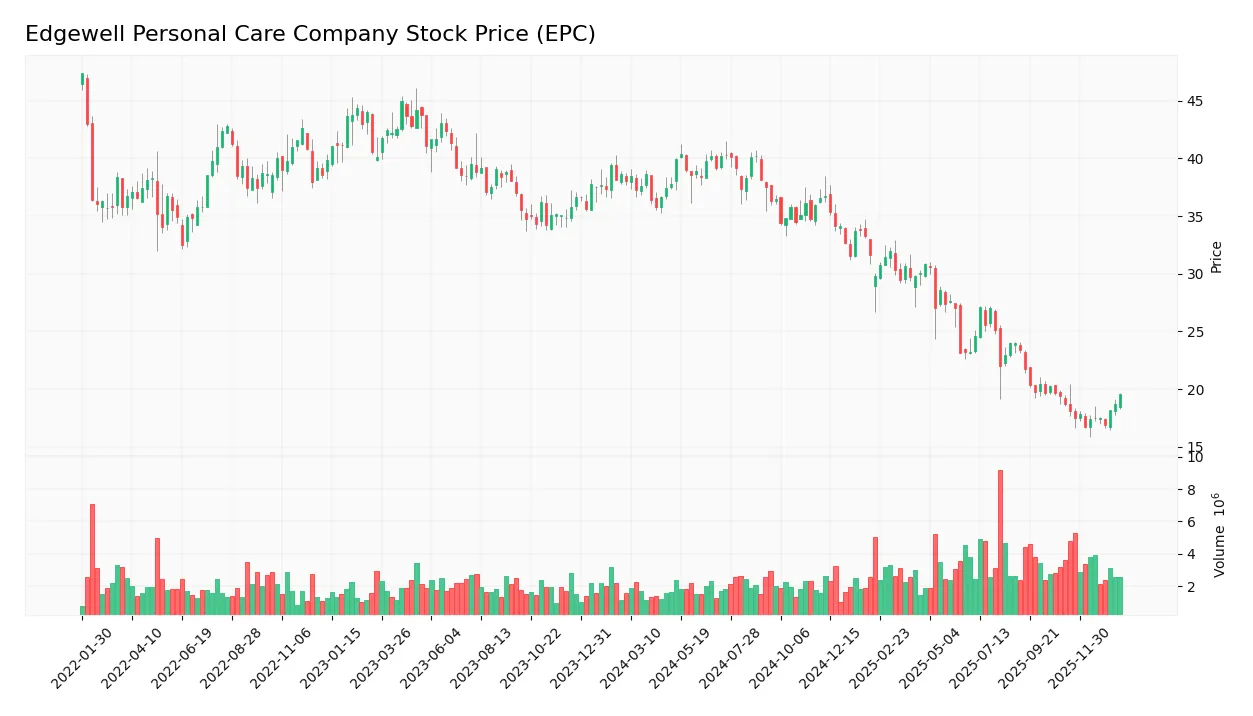
Trend Analysis
Over the past 12 months, EPC’s stock price declined by 48.59%, indicating a clear bearish trend with price acceleration. The stock reached a high of 40.38 and a low of 16.73, with volatility measured by a standard deviation of 7.57. A recent short-term trend from November 2025 to January 2026 shows a 4.43% increase, suggesting a mild recovery phase.
Volume Analysis
Trading volume for EPC has increased overall, totaling 301.85M shares. Buyer volume constitutes 48.68%, slightly less than seller volume, indicating a seller-driven activity. In the recent period (Nov 2025–Jan 2026), seller dominance persisted with 46.71% buyer share, reflecting cautious investor sentiment and moderate market participation.
Target Prices
The consensus target prices for Edgewell Personal Care Company (EPC) reflect moderate upside potential based on current analyst estimates.
| Target High | Target Low | Consensus |
|---|---|---|
| 23 | 20 | 21.5 |
Analysts expect EPC’s stock to trade between 20 and 23, with a consensus target price of 21.5, indicating a cautiously optimistic outlook.

Don’t Let Luck Decide Your Entry Point
Optimize your entry points with our advanced ProRealTime indicators. You’ll get efficient buy signals with precise price targets for maximum performance. Start outperforming now!
Analyst & Consumer Opinions
This section reviews the latest analyst ratings and consumer feedback regarding Edgewell Personal Care Company (EPC).
Stock Grades
Here are the latest verified stock grades for Edgewell Personal Care Company provided by leading financial institutions:
| Grading Company | Action | New Grade | Date |
|---|---|---|---|
| Wells Fargo | Maintain | Overweight | 2026-01-05 |
| Morgan Stanley | Maintain | Equal Weight | 2025-11-18 |
| Barclays | Maintain | Equal Weight | 2025-11-14 |
| RBC Capital | Maintain | Outperform | 2025-11-14 |
| Wells Fargo | Maintain | Overweight | 2025-11-14 |
| Wells Fargo | Maintain | Overweight | 2025-09-25 |
| Barclays | Maintain | Equal Weight | 2025-08-06 |
| UBS | Maintain | Neutral | 2025-08-06 |
| Morgan Stanley | Upgrade | Equal Weight | 2025-08-06 |
| Canaccord Genuity | Maintain | Buy | 2025-08-06 |
The consensus trend reflects a predominantly neutral to moderately positive outlook, with most ratings clustered around hold (equal weight/neutral) and a few overweight or outperform grades, indicating cautious optimism among analysts.
Consumer Opinions
Consumer sentiment around Edgewell Personal Care Company (EPC) reflects a mix of appreciation for product quality and concerns about pricing.
| Positive Reviews | Negative Reviews |
|---|---|
| “Edgewell’s razors offer a smooth shave with minimal irritation.” | “Some products feel overpriced compared to competitors.” |
| “The variety of personal care items caters well to different skin types.” | “Customer service response times can be slow.” |
| “Packaging is eco-friendly, which aligns with my values.” | “Occasional issues with product availability in stores.” |
Overall, consumers praise Edgewell for effective products and eco-conscious packaging but frequently mention pricing and customer service as areas needing improvement.
Risk Analysis
The following table summarizes key risks related to Edgewell Personal Care Company, highlighting their likelihood and potential impact:
| Category | Description | Probability | Impact |
|---|---|---|---|
| Financial Health | Altman Z-Score in distress zone (1.46), indicating a moderate to high bankruptcy risk. | High | High |
| Profitability | Low net margin (1.14%) and return on equity (1.64%) signal weak profitability performance. | High | Medium |
| Valuation | Elevated P/E ratio (38.07) suggests overvaluation risk; price may correct downward. | Medium | Medium |
| Leverage & Liquidity | Moderate debt-to-equity (0.91) and interest coverage ratio (1.32) imply financial strain. | Medium | Medium |
| Market Volatility | Beta of 0.616 indicates below-market volatility but exposes stock to sector cyclicality risks. | Low | Low |
| Competitive Risk | Intense competition in personal care products may pressure margins and market share. | Medium | Medium |
The most pressing concerns are the company’s distressed Altman Z-Score and weak profitability metrics, which signal financial fragility despite a favorable weighted average cost of capital. Investors should carefully weigh these risks against the moderate valuation and manageable leverage when considering EPC for their portfolio.
Should You Buy Edgewell Personal Care Company?
Edgewell Personal Care Company appears to exhibit a challenging profile with eroding profitability and a very unfavorable competitive moat, suggesting value destruction. Despite a manageable leverage profile, the distress zone Altman Z-Score tempers the overall very favorable B rating, indicating cautious operational efficiency.
Strength & Efficiency Pillars
Edgewell Personal Care Company exhibits moderate financial health with a Piotroski score of 6, indicating average operational strength. The company maintains a favorable weighted average cost of capital at 5.3%, supported by a solid current ratio of 1.76, reflecting adequate liquidity. While the net margin is low at 1.14% and return on equity is modest at 1.64%, the price-to-book ratio of 0.62 suggests the stock is undervalued relative to its book value. However, the return on invested capital (3.0%) falls below the WACC, indicating that Edgewell is currently not a value creator.
Weaknesses and Drawbacks
Several metrics raise concerns about the company’s financial and market positioning. The price-to-earnings ratio stands at an elevated 38.07, signaling a premium valuation that may not be justified by earnings performance. Edgewell’s Altman Z-Score of 1.46 places it in the distress zone, implying heightened bankruptcy risk. The interest coverage ratio is weak at 1.32, suggesting limited capacity to meet interest obligations. Furthermore, recent revenue and net income growth trends are unfavorable, with declines of -1.34% and -78.44%, respectively. The slightly seller-dominant market behavior, with only 46.71% buyer volume recently, adds short-term pressure on the stock.
Our Verdict about Edgewell Personal Care Company
Edgewell’s long-term fundamental profile may appear unfavorable due to weak profitability and value destruction indicated by ROIC below WACC and a distressed Altman Z-Score. Despite a neutral overall ratio assessment and slight improvement in recent price trend (+4.43%), the recent seller dominance combined with bearish stock trend suggests caution. Therefore, although the stock could hold some value appeal given its low price-to-book, investors might consider a wait-and-see approach before committing to long-term exposure.
Disclaimer: This content is for informational purposes only and does not constitute financial, investment, or other professional advice. Investing in financial markets involves a significant risk of loss, and past performance is not indicative of future results.
Additional Resources
- Edgewell Personal Care Announces Sale of Feminine Care Business to Essity for $340M – PR Newswire (Nov 12, 2025)
- Edgewell Personal Care Company’s (NYSE:EPC) Popularity With Investors Is Clear – simplywall.st (Jan 10, 2026)
- Edgewell Personal Care (EPC) Misses Q4 Earnings Estimates – Yahoo Finance (Nov 13, 2025)
- Edgewell Personal Care Company’s Transformation Yields Potential – Seeking Alpha (Nov 09, 2025)
- Edgewell Personal Care Company to Webcast a Discussion of First Quarter Fiscal Year 2026 Results on February 9, 2026 – Finviz (Jan 12, 2026)
For more information about Edgewell Personal Care Company, please visit the official website: edgewell.com