Home > Analyses > Basic Materials > Ecolab Inc.
Ecolab Inc. safeguards the health and efficiency of countless industries globally by delivering critical water, hygiene, and infection prevention solutions. Its leadership spans diverse sectors, from food processing to healthcare, powered by cutting-edge technology and an unwavering commitment to quality. As environmental and regulatory demands intensify, I examine whether Ecolab’s robust market position and innovation pipeline continue to justify its premium valuation and growth prospects.
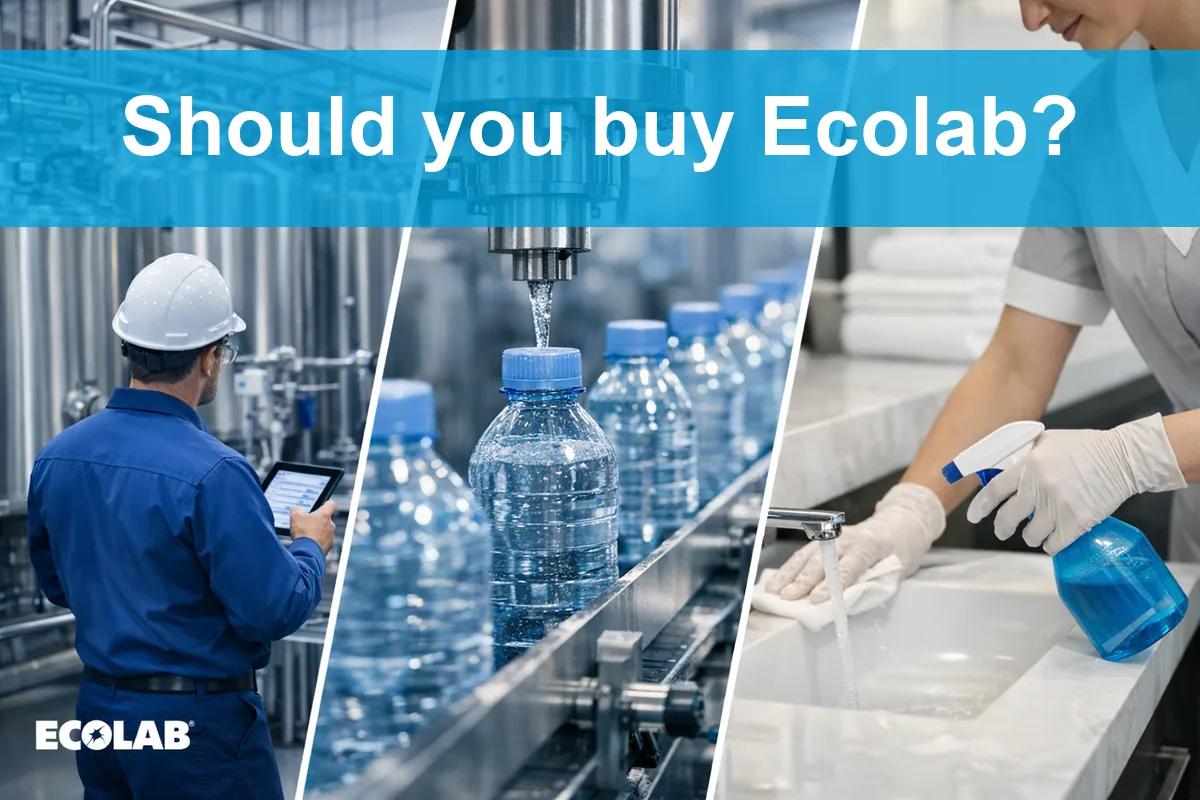
Table of contents
Business Model & Company Overview
Ecolab Inc., founded in 1923 and headquartered in Saint Paul, Minnesota, stands as a global leader in the specialty chemicals sector. It delivers a cohesive ecosystem of water, hygiene, and infection prevention solutions across industrial, institutional, and healthcare markets. With 48K employees, Ecolab integrates cleaning, sanitizing, and pest elimination services under a unified mission to safeguard health and operational efficiency worldwide.
Ecolab’s revenue engine balances product sales with recurring services, driven by specialized chemical solutions and customized programs. Its strategic footprint spans the Americas, Europe, and Asia, serving manufacturing, hospitality, healthcare, and more. The company’s robust economic moat stems from its deep customer relationships, proprietary technologies, and critical role in global sanitation standards.
Financial Performance & Fundamental Metrics
I will analyze Ecolab Inc.’s income statement, key financial ratios, and dividend payout policy to assess its overall financial health and shareholder value.
Income Statement
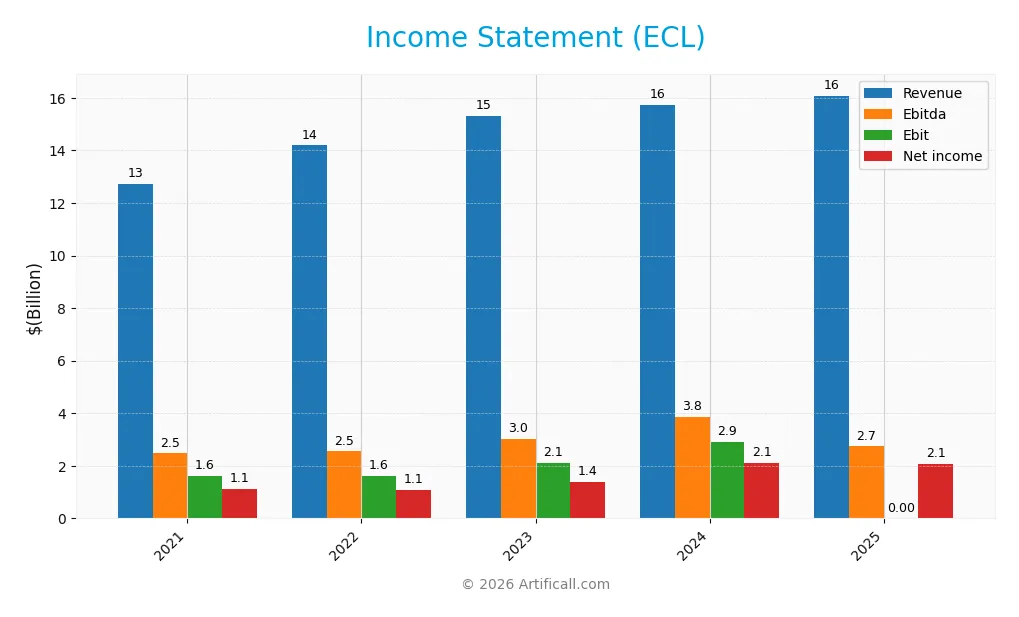
The table below presents Ecolab Inc.’s key income statement figures for fiscal years 2021 through 2025, reflecting revenue, expenses, and profitability metrics in USD.
| 2021 | 2022 | 2023 | 2024 | 2025 | |
|---|---|---|---|---|---|
| Revenue | 12.7B | 14.2B | 15.3B | 15.7B | 16.1B |
| Cost of Revenue | 7.5B | 8.8B | 9.1B | 8.9B | 8.9B |
| Operating Expenses | 3.5B | 3.8B | 4.0B | 4.2B | 4.2B |
| Gross Profit | 5.2B | 5.4B | 6.2B | 6.8B | 7.2B |
| EBITDA | 2.5B | 2.5B | 3.0B | 3.8B | 2.8B |
| EBIT | 1.6B | 1.6B | 2.1B | 2.9B | 2.8B |
| Interest Expense | 216M | 264M | 355M | 338M | 241M |
| Net Income | 1.1B | 1.1B | 1.4B | 2.1B | 2.1B |
| EPS | 3.95 | 3.83 | 4.82 | 7.43 | 7.33 |
| Filing Date | 2022-02-25 | 2023-02-24 | 2024-02-23 | 2025-02-21 | 2026-02-23 |
Income Statement Evolution
Ecolab’s revenue rose 26.3% from 2021 to 2025, though growth slowed to 2.2% in the last year. Net income surged 83.7% over five years but declined 1.7% from 2024 to 2025. Margins improved significantly overall, with net margin up 45.5%, though the recent year showed a slight margin contraction. Operating efficiency remained stable.
Is the Income Statement Favorable?
In 2025, Ecolab reported $16.1B revenue and $2.08B net income, yielding a 12.9% net margin—strong by industry standards. EBIT margin held favorably at 17.3%, with interest expense low at 1.5% of revenue. Despite a minor dip in EPS and net margin growth last year, the fundamentals reflect solid profitability and disciplined cost control.
Financial Ratios
The following table presents key financial ratios for Ecolab Inc. from 2021 to 2025, offering a snapshot of profitability, valuation, liquidity, leverage, and efficiency metrics:
| Ratios | 2021 | 2022 | 2023 | 2024 | 2025 |
|---|---|---|---|---|---|
| Net Margin | 8.9% | 7.7% | 8.96% | 13.4% | 12.9% |
| ROE | 15.6% | 15.1% | 17.1% | 24.1% | 21.2% |
| ROIC | 7.5% | 7.4% | 9.4% | 11.8% | 11.9% |
| P/E | 59.4 | 38.0 | 41.2 | 31.5 | 35.8 |
| P/B | 9.3 | 5.7 | 7.0 | 7.6 | 7.6 |
| Current Ratio | 1.32 | 1.30 | 1.30 | 1.26 | 1.08 |
| Quick Ratio | 0.90 | 0.88 | 0.95 | 0.95 | 0.81 |
| D/E | 1.27 | 1.25 | 1.09 | 0.95 | 0.90 |
| Debt-to-Assets | 43.2% | 42.1% | 40.0% | 37.0% | 35.8% |
| Interest Coverage | 7.8 | 6.1 | 6.1 | 7.7 | 12.1 |
| Asset Turnover | 0.60 | 0.66 | 0.70 | 0.70 | 0.65 |
| Fixed Asset Turnover | 3.46 | 3.79 | 3.80 | 3.52 | 3.19 |
| Dividend Yield | 0.84% | 1.45% | 1.09% | 1.00% | 1.01% |
Evolution of Financial Ratios
From 2021 to 2025, Ecolab’s Return on Equity (ROE) improved steadily, peaking at 21.24% in 2025. The Current Ratio declined from about 1.32 to 1.08, indicating slightly reduced liquidity but remaining above 1. Debt-to-Equity Ratio decreased from 1.27 to 0.90, reflecting moderate deleveraging. Profitability margins increased, with net margin rising to 12.91% in 2025, showing stronger bottom-line performance.
Are the Financial Ratios Fovorable?
In 2025, profitability ratios like ROE (21.24%) and net margin (12.91%) are favorable, supported by a solid interest coverage ratio of 11.57. Liquidity ratios, including Current Ratio (1.08) and Quick Ratio (0.81), are neutral, suggesting adequate short-term assets. Leverage metrics such as Debt-to-Equity (0.90) and Debt-to-Assets (35.77%) are neutral. However, valuation multiples like P/E (35.83) and P/B (7.61) appear unfavorable, signaling high market expectations. Overall, ratios are slightly favorable.
Shareholder Return Policy
Ecolab Inc. maintains a consistent dividend payout ratio around 36%, with dividend per share rising from $1.98 in 2021 to $2.66 in 2025. The annual yield hovers near 1%, supported by free cash flow coverage above 60%, indicating prudent distribution practices.
The company also engages in share buybacks, balancing capital return with reinvestment. This measured policy aligns with sustainable long-term value creation, avoiding excessive payouts or aggressive repurchases that could strain cash flow.
Score analysis
The radar chart below highlights Ecolab Inc.’s key financial metric scores for a comprehensive evaluation:
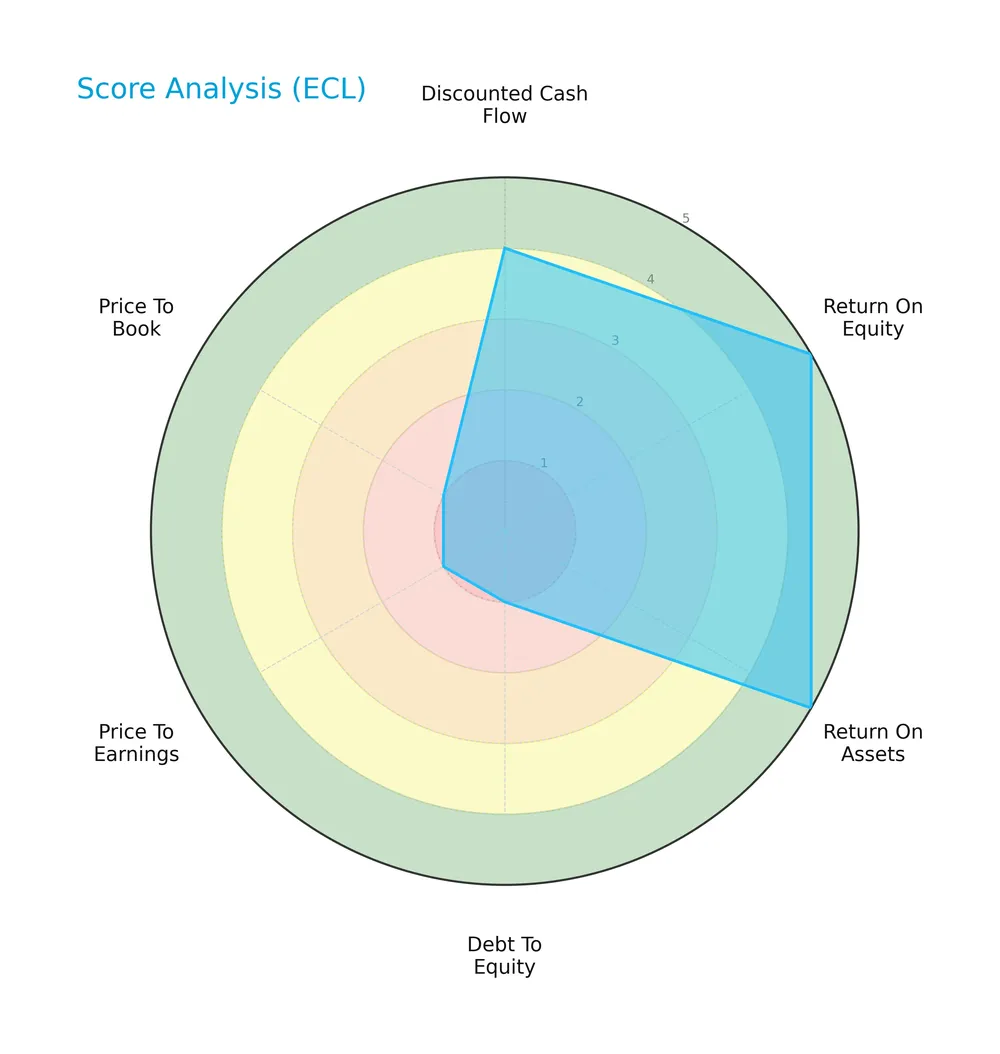
Ecolab shows very favorable profitability scores with a 5 in both ROE and ROA. Its discounted cash flow is favorable at 4. However, valuation and leverage scores are very unfavorable, each scoring 1, indicating potential risk areas.
Analysis of the company’s bankruptcy risk
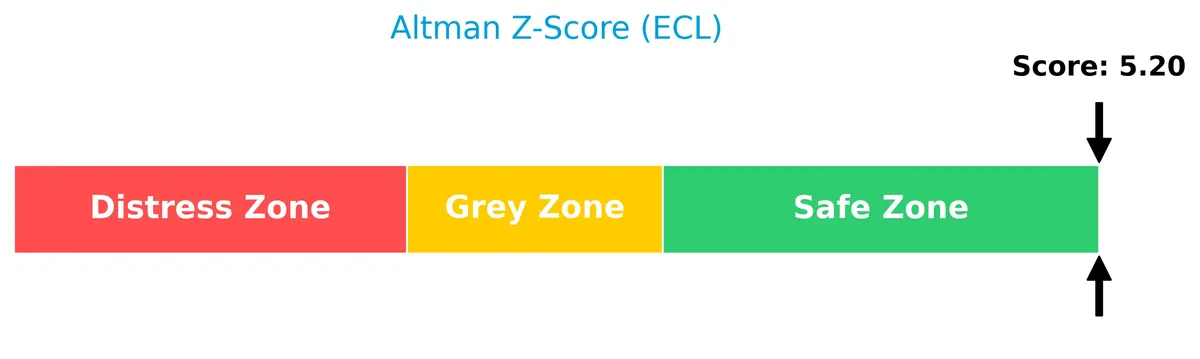
Ecolab’s Altman Z-Score places it well within the safe zone, signaling a low bankruptcy risk and strong financial stability:
Is the company in good financial health?
The Piotroski Score diagram illustrates Ecolab’s financial health based on nine fundamental criteria:
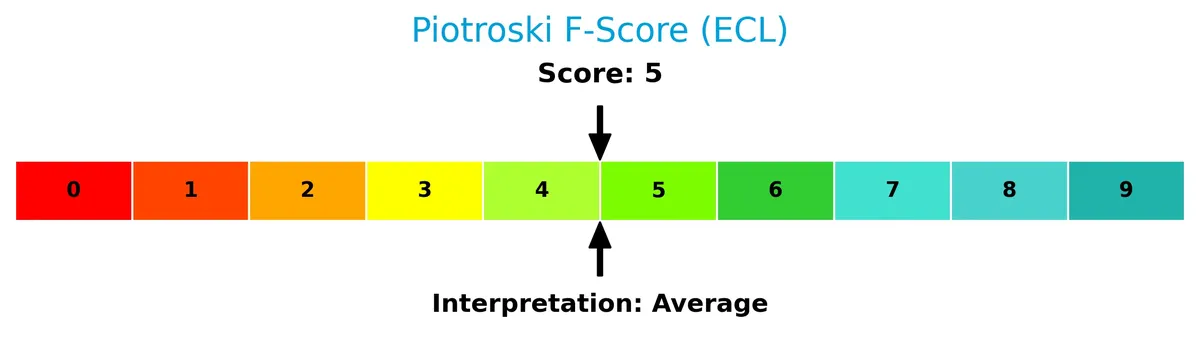
With a score of 6, Ecolab ranks as average in financial strength. This suggests moderate operational efficiency and profitability but not a standout in terms of financial robustness.
Competitive Landscape & Sector Positioning
This analysis examines Ecolab Inc.’s strategic positioning and revenue streams across its key business segments. We will explore its main products, competitors, and competitive advantages. I aim to determine whether Ecolab holds a sustainable competitive advantage versus its peers.
Strategic Positioning
Ecolab Inc. maintains a diversified product portfolio across water treatment, institutional cleaning, pest elimination, and healthcare segments. Geographically, it balances strong U.S. revenue (8.5B in 2025) with significant exposure in Europe (3.3B) and emerging markets, reflecting broad industrial and institutional reach.
Revenue by Segment
The pie chart displays Ecolab Inc.’s revenue distribution by segment for the fiscal year 2025, highlighting the company’s diverse business streams and their relative contributions.
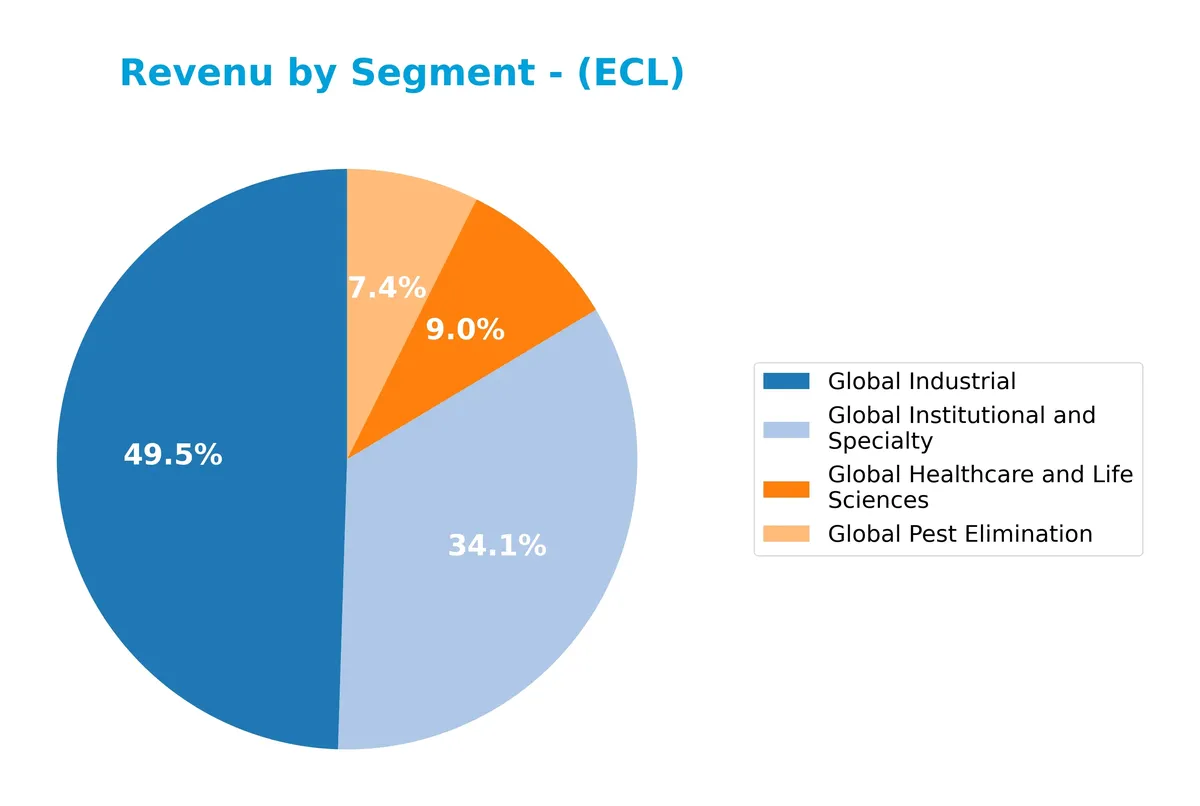
In 2025, Global Water leads with $7.98B, followed by Global Institutional and Specialty at $6.1B. Global Pest Elimination and Global Life Sciences contribute $1.25B and $748M respectively. The shift from prior years shows a clear focus on water and institutional services, signaling strong demand in those areas. The growing concentration in Global Water suggests reliance on sustainable resource management as a core growth driver.
Key Products & Brands
The following table summarizes Ecolab Inc.’s key products and brands across its major business segments:
| Product | Description |
|---|---|
| Global Industrial | Water treatment, process applications, cleaning and sanitizing for manufacturing and heavy industries. |
| Global Institutional & Specialty | Specialized cleaning and sanitizing products for foodservice, hospitality, lodging, government, and retail sectors. |
| Global Healthcare & Life Sciences | Infection prevention, surgical solutions, and contamination control for healthcare and pharmaceutical industries. Brands include Ecolab, Microtek, and Anios. |
| Global Pest Elimination | Pest detection, elimination, and prevention services for restaurants, healthcare, education, and commercial customers. |
| Other | Colloidal silica for industrial applications and wash process management including water and energy reduction programs. |
Ecolab’s product portfolio spans essential hygiene, water treatment, and pest control solutions. Its brands serve diverse industries, from healthcare to heavy manufacturing, underpinning the company’s broad industrial footprint.
Main Competitors
There are 9 competitors in total, with the table below listing the top 10 leaders by market capitalization:
| Competitor | Market Cap. |
|---|---|
| Linde plc | 200.4B |
| The Sherwin-Williams Company | 81.5B |
| Ecolab Inc. | 74.4B |
| Air Products and Chemicals, Inc. | 55.8B |
| PPG Industries, Inc. | 23.4B |
| International Flavors & Fragrances Inc. | 17.4B |
| DuPont de Nemours, Inc. | 17.1B |
| Albemarle Corporation | 16.9B |
| LyondellBasell Industries N.V. | 14.3B |
Ecolab Inc. ranks 3rd among its competitors with a market cap at 43.3% of the leader, Linde plc. The company sits above both the average market cap of the top 10 (55.7B) and the median market cap of the sector (23.4B). It holds a narrow gap of approximately 6.05% below The Sherwin-Williams Company, its nearest competitor above.
Comparisons with competitors
Check out how we compare the company to its competitors:
Does Ecolab Inc. have a competitive advantage?
Ecolab Inc. demonstrates a very favorable competitive advantage, evidenced by a ROIC exceeding WACC by 4.2% and a strong upward ROIC trend of 59.4% from 2021 to 2025. This indicates efficient capital allocation and sustainable value creation in its specialty chemicals sector.
Looking ahead, Ecolab’s diversified segments—including industrial water treatment and healthcare sanitation—offer growth opportunities across global markets such as the US, Europe, and Asia-Pacific. Continued innovation in infection prevention and energy management supports its expanding presence and resilience in evolving industries.
SWOT Analysis
This analysis highlights Ecolab Inc.’s core strengths, weaknesses, opportunities, and threats to guide strategic decisions.
Strengths
- strong global brand
- diverse industrial and healthcare segments
- consistent profitability with 12.9% net margin
Weaknesses
- high valuation multiples (PE 35.8, PB 7.6)
- moderate liquidity ratios (current ratio 1.08)
- dependence on raw material costs
Opportunities
- expanding water and hygiene markets
- growth in emerging markets like Asia Pacific
- increasing demand for sustainability solutions
Threats
- raw material price volatility
- regulatory pressures on chemicals
- competition from lower-cost providers
Ecolab’s durable competitive advantages and growing ROIC suggest strong value creation. However, elevated valuation and moderate liquidity require caution. Strategic focus on emerging markets and sustainability can drive future growth while managing cost and regulatory risks.
Stock Price Action Analysis
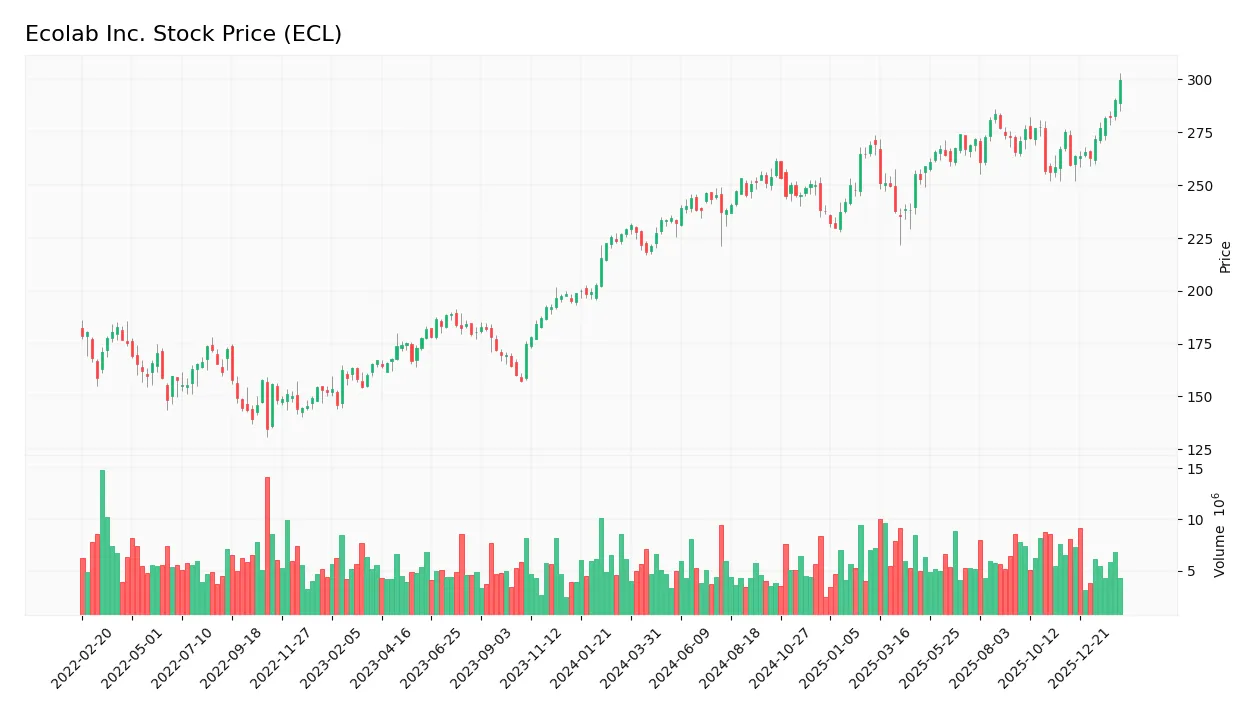
The weekly stock chart illustrates Ecolab Inc.’s price movements and volatility over the past 12 months:
Trend Analysis
Over the past 12 months, ECL’s stock price rose by 34.21%, indicating a bullish trend with acceleration. Price volatility remains elevated at a 17.9% standard deviation. The highest price reached 305.67, and the lowest was 218.16, confirming strong upward momentum.
Volume Analysis
Trading volume has increased, with buyers accounting for 62.48% of total activity over the past year. The recent three months show even stronger buyer dominance at 80.57%, signaling robust investor confidence and heightened market participation.
Target Prices
Analysts present a confident target consensus for Ecolab Inc., reflecting solid growth expectations.
| Target Low | Target High | Consensus |
|---|---|---|
| 300 | 345 | 326.3 |
The target range between 300 and 345 indicates moderate upside potential. The consensus at 326.3 suggests steady investor confidence in Ecolab’s future performance.

Don’t Let Luck Decide Your Entry Point
Optimize your entry points with our advanced ProRealTime indicators. You’ll get efficient buy signals with precise price targets for maximum performance. Start outperforming now!
Analyst & Consumer Opinions
This section reviews recent analyst grades and consumer feedback related to Ecolab Inc., ticker ECL.
Stock Grades
The following table presents recent verified analyst grades for Ecolab Inc., reflecting current market sentiment and consensus:
| Grading Company | Action | New Grade | Date |
|---|---|---|---|
| Evercore ISI Group | Maintain | Outperform | 2026-02-18 |
| BMO Capital | Maintain | Outperform | 2026-02-13 |
| BNP Paribas | Maintain | Outperform | 2026-02-12 |
| Exane BNP Paribas | Maintain | Outperform | 2026-02-12 |
| Wells Fargo | Maintain | Equal Weight | 2026-02-11 |
| Citigroup | Maintain | Buy | 2026-02-11 |
| UBS | Maintain | Neutral | 2026-02-11 |
| JP Morgan | Maintain | Neutral | 2026-02-11 |
| Jefferies | Maintain | Buy | 2026-02-11 |
| RBC Capital | Maintain | Outperform | 2026-02-11 |
Grades predominantly cluster around Outperform and Buy, indicating broad confidence. A minority maintain Neutral or Equal Weight, reflecting some caution but no significant downgrades.
Consumer Opinions
Consumers express a mix of appreciation and concern about Ecolab Inc., reflecting its operational strengths and areas needing attention.
| Positive Reviews | Negative Reviews |
|---|---|
| Reliable products with consistent quality. | Customer service response times lag. |
| Strong commitment to sustainability and safety. | Pricing can be high compared to competitors. |
| Effective solutions for industrial cleaning. | Occasional delays in order fulfillment. |
Overall, consumers praise Ecolab’s product quality and sustainability focus. However, customer service delays and pricing remain common pain points, suggesting room for operational improvements.
Risk Analysis
Below is a summary of key risks facing Ecolab Inc., categorized by likelihood and potential impact:
| Category | Description | Probability | Impact |
|---|---|---|---|
| Valuation Risk | High P/E of 35.8 and P/B of 7.6 suggest the stock trades at a premium, risking multiple contraction. | Medium | High |
| Leverage Risk | Debt-to-equity near 0.9 signals moderate leverage; interest coverage is favorable but warrants caution. | Medium | Medium |
| Liquidity Risk | Current ratio at 1.08 and quick ratio 0.81 indicate tight short-term liquidity buffers. | Medium | Medium |
| Market Volatility | Beta near 1 implies stock moves roughly with the market; sector cyclicality may amplify swings. | High | Medium |
| Operational Risk | Exposure to diverse industrial and healthcare segments mitigates, but supply chain disruptions remain a threat. | Low | Medium |
Valuation stands out as the most pressing risk. Historically in specialty chemicals, overpaying leads to sharp drawdowns when growth slows. Ecolab’s premium multiples reflect optimism but demand strong execution. Its solid Altman Z-score of 5.26 confirms financial safety, yet moderate liquidity ratios warrant monitoring. I observe that interest coverage at 11.6x cushions debt risks well, but leverage near unity could limit flexibility in downturns. Overall, investors must weigh growth potential against valuation and moderate financial constraints.
Should You Buy Ecolab Inc.?
Ecolab appears to be a profitable company with growing ROIC, indicating strong value creation and a durable competitive moat. Despite a substantial leverage profile, its overall rating of B suggests a very favorable financial health profile, though some valuation risks remain.
Strength & Efficiency Pillars
Ecolab Inc. exhibits solid operational efficiency with a net margin of 12.91% and a return on equity of 21.24%. Its return on invested capital (ROIC) stands at 11.95%, comfortably above the weighted average cost of capital (WACC) at 7.75%, confirming the company as a clear value creator. I note the company’s growing ROIC trend, indicating expanding profitability and a sustainable competitive advantage. Interest coverage at 11.57 further underscores efficient capital management and operational resilience.
Weaknesses and Drawbacks
Ecolab’s valuation metrics raise caution. The price-to-earnings ratio at 35.83 and price-to-book ratio at 7.61 signal a premium valuation that could limit upside. While leverage appears moderate with a debt-to-equity ratio of 0.9, these elevated multiples increase sensitivity to market corrections. The current ratio of 1.08 and quick ratio of 0.81 offer only neutral liquidity comfort, which requires monitoring amid fluctuating market conditions. These factors suggest potential short-term headwinds despite operational strengths.
Our Final Verdict about Ecolab Inc.
Ecolab’s strong profitability and value creation suggest an attractive long-term fundamental profile. The bullish overall trend, combined with strong buyer dominance at 80.57% recently, supports positive momentum. This profile may appear appealing for investors seeking growth exposure, though the elevated valuation advises a measured approach. I suggest a wait-and-see stance to capture a more favorable entry point as the market digests its premium multiples.
Disclaimer: This content is for informational purposes only and does not constitute financial, investment, or other professional advice. Investing in financial markets involves a significant risk of loss, and past performance is not indicative of future results.
Additional Resources
- Decoding Ecolab Inc (ECL): A Strategic SWOT Insight – GuruFocus (Feb 24, 2026)
- Ecolab Inc. (NYSE: ECL) files shelf registration to sell debt securities – Stock Titan (Feb 23, 2026)
- ECOLAB INC. SEC 10-K Report – TradingView (Feb 23, 2026)
- Ecolab Declares Cash Dividend – Business Wire (Feb 19, 2026)
- Do Wall Street Analysts Like Ecolab Stock? – Yahoo Finance (Feb 19, 2026)
For more information about Ecolab Inc., please visit the official website: ecolab.com