Home > Analyses > Consumer Cyclical > eBay Inc.
eBay revolutionizes how millions buy and sell worldwide, transforming retail into a dynamic marketplace. It leads specialty retail with a robust online platform, blending innovation and convenience. Known for its diverse listings and seamless user experience, eBay shapes consumer habits and retail trends. As competition intensifies, I ask: does eBay’s financial strength and strategic vision still justify its current market valuation and future growth potential?

Table of contents
Business Model & Company Overview
eBay Inc., founded in 1995 and headquartered in San Jose, California, commands a leading role in the specialty retail sector. Its core business revolves around a dynamic marketplace ecosystem that seamlessly connects buyers and sellers worldwide. The platform integrates online, mobile, and offline channels, fostering a diverse commerce environment spanning retailers, auctioneers, and distributors.
The company’s revenue engine balances transaction fees from its marketplace with value-added services. eBay’s global footprint spans the Americas, Europe, and Asia, maximizing market reach and user engagement. This broad presence, combined with a network effect from millions of active users, builds a formidable economic moat that shapes the future of digital commerce.
Financial Performance & Fundamental Metrics
I analyze eBay Inc.’s income statement, key financial ratios, and dividend payout policy to assess its profitability, efficiency, and shareholder returns.
Income Statement
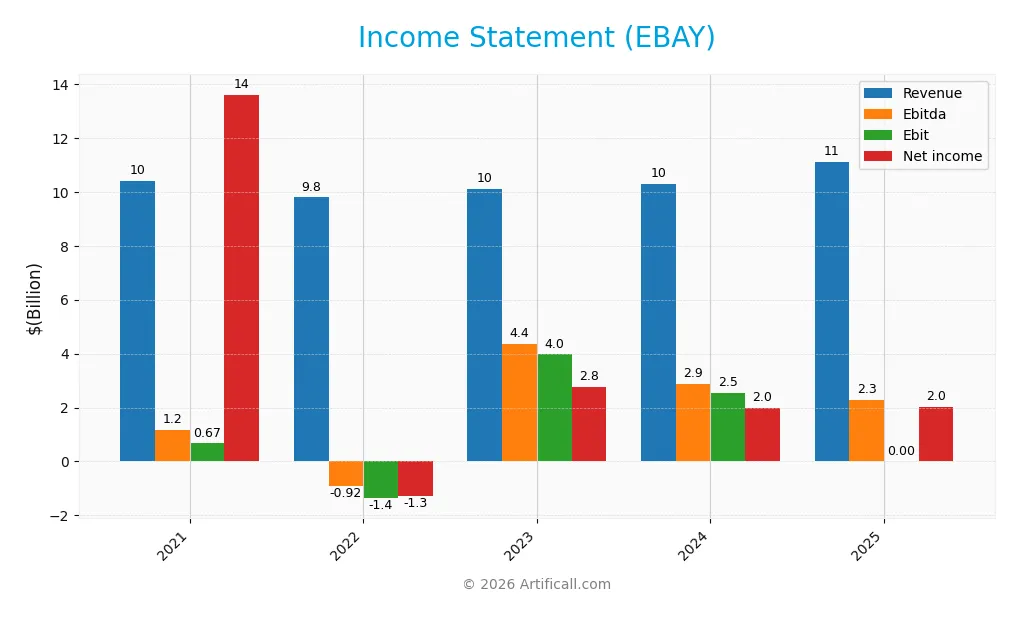
The table below presents eBay Inc.’s key income statement items for fiscal years 2021 through 2025, reflecting revenue, expenses, and profitability metrics.
| 2021 | 2022 | 2023 | 2024 | 2025 | |
|---|---|---|---|---|---|
| Revenue | 10.42B | 9.80B | 10.11B | 10.28B | 11.10B |
| Cost of Revenue | 2.65B | 2.68B | 2.83B | 2.88B | 3.17B |
| Operating Expenses | 4.85B | 4.77B | 5.34B | 5.08B | 5.23B |
| Gross Profit | 7.77B | 7.12B | 7.28B | 7.40B | 7.93B |
| EBITDA | 1.17B | -924M | 4.37B | 2.86B | 2.28B |
| EBIT | 667M | -1.37B | 3.97B | 2.54B | 0 |
| Interest Expense | 269M | 235M | 263M | 259M | 246M |
| Net Income | 13.61B | -1.27B | 2.77B | 1.98B | 2.03B |
| EPS | 20.87 | -2.28 | 5.22 | 3.98 | 4.43 |
| Filing Date | 2022-02-24 | 2023-05-12 | 2024-05-29 | 2025-02-27 | 2026-02-18 |
Income Statement Evolution
From 2021 to 2025, eBay’s revenue grew modestly with a 6.5% overall increase, while net income declined sharply by 85%. Gross margins remained strong near 71%, showing some stability despite fluctuating operating expenses. However, EBIT fell dramatically in the last year, erasing prior gains and signaling margin pressure.
Is the Income Statement Favorable?
In 2025, revenue rose 8% year-over-year to $11.1B, supporting a healthy gross profit increase of 7%. Operating expenses grew proportionally, but EBIT dropped to zero, a clear red flag. Net margin held at 18.3%, and EPS grew 10%, suggesting mixed fundamentals. Overall, the income statement presents a neutral profile with both strengths and notable weaknesses.
Financial Ratios
The following table presents key financial ratios for eBay Inc. over the last four fiscal years, illustrating profitability, valuation, liquidity, leverage, and efficiency metrics:
| Ratios | 2022 | 2023 | 2024 | 2025 |
|---|---|---|---|---|
| Net Margin | -12.96% | 27.36% | 19.21% | 18.30% |
| ROE | -24.63% | 43.26% | 38.29% | 0 |
| ROIC | 10.47% | 8.09% | 13.39% | 0 |
| P/E | -18.24 | 8.36 | 15.56 | 19.68 |
| P/B | 4.49 | 3.61 | 5.96 | 0 |
| Current Ratio | 2.18 | 2.44 | 1.24 | 0 |
| Quick Ratio | 2.18 | 2.44 | 1.24 | 0 |
| D/E | 1.83 | 1.29 | 1.52 | 0 |
| Debt-to-Assets | 45.18% | 38.06% | 40.60% | 0 |
| Interest Coverage | 10.00 | 7.38 | 8.95 | -9.26 |
| Asset Turnover | 0.47 | 0.47 | 0.53 | 0 |
| Fixed Asset Turnover | 5.59 | 5.82 | 6.08 | 0 |
| Dividend Yield | 2.11% | 2.28% | 1.73% | 1.33% |
Evolution of Financial Ratios
Between 2021 and 2025, eBay’s Return on Equity (ROE) deteriorated significantly, reaching zero in 2025. The Current Ratio also declined, hitting zero in 2025, signaling reduced liquidity. Debt-to-Equity ratio showed a sharp improvement, dropping to zero in 2025 after peaking earlier. Profitability margins softened, with net profit margin falling from 27.4% in 2023 to 18.3% in 2025.
Are the Financial Ratios Fovorable?
In 2025, eBay’s profitability is favorable with an 18.3% net margin but ROE and ROIC are absent, marking a red flag. Liquidity ratios are unfavorable, with current and quick ratios at zero. Leverage ratios appear favorable due to zero debt metrics. Market valuation metrics like P/E and dividend yield are neutral. Overall, the ratios suggest a slightly unfavorable financial profile.
Shareholder Return Policy
eBay maintains a consistent dividend policy with a payout ratio around 26%, supported by a dividend yield near 1.3% in 2025. The dividend per share has steadily increased from 0.71 in 2021 to 1.16 in 2025, backed by free cash flow coverage above 70%.
The company also engages in share buybacks, complementing dividends to return value to shareholders. This balanced approach, combining moderate dividends and buybacks, supports sustainable long-term value creation without risking excessive distributions or cash flow strain.
Score analysis
The radar chart below visualizes key financial scores reflecting valuation, profitability, and leverage aspects for eBay Inc.:
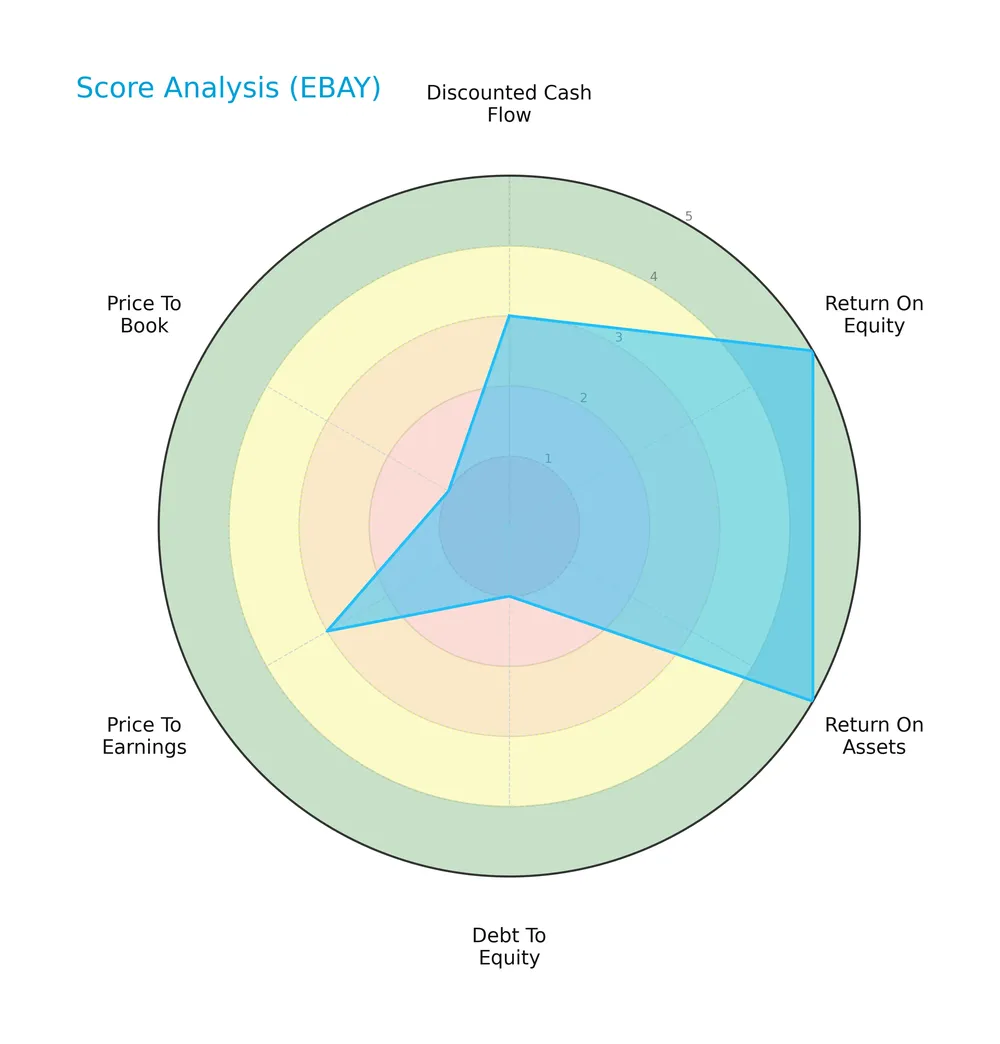
eBay shows strong profitability with high scores in ROE and ROA at 5 each. Its valuation metrics (DCF and PE) are moderate at 3. However, leverage and book value metrics score poorly, with Debt/Equity and Price/Book each scoring only 1, indicating potential balance sheet concerns.
Analysis of the company’s bankruptcy risk
The Altman Z-Score places eBay in the grey zone, indicating moderate bankruptcy risk and a cautious outlook on financial stability:

Is the company in good financial health?
The Piotroski Score diagram highlights eBay’s average financial health based on nine key accounting criteria:

With a Piotroski Score of 5, eBay demonstrates moderate financial strength but lacks the robustness associated with strong or very strong scores, suggesting room for improvement in operational efficiency and balance sheet management.
Competitive Landscape & Sector Positioning
This analysis explores eBay Inc.’s strategic positioning within the specialty retail sector, focusing on its key products and revenue segments. We will examine its main competitors and competitive advantages to assess market standing. I will evaluate whether eBay holds a true competitive advantage over its peers.
Strategic Positioning
eBay Inc. concentrates its revenue primarily in its Marketplaces segment, which generated $8.6B in 2024, supported by $1.6B from advertising. Geographically, it maintains a diversified footprint with a strong U.S. base ($5.2B) complemented by significant exposure in the UK, Germany, China, and other regions.
Revenue by Segment
This pie chart illustrates eBay Inc.’s revenue distribution by business segment for the fiscal year 2024, highlighting the company’s core income sources.
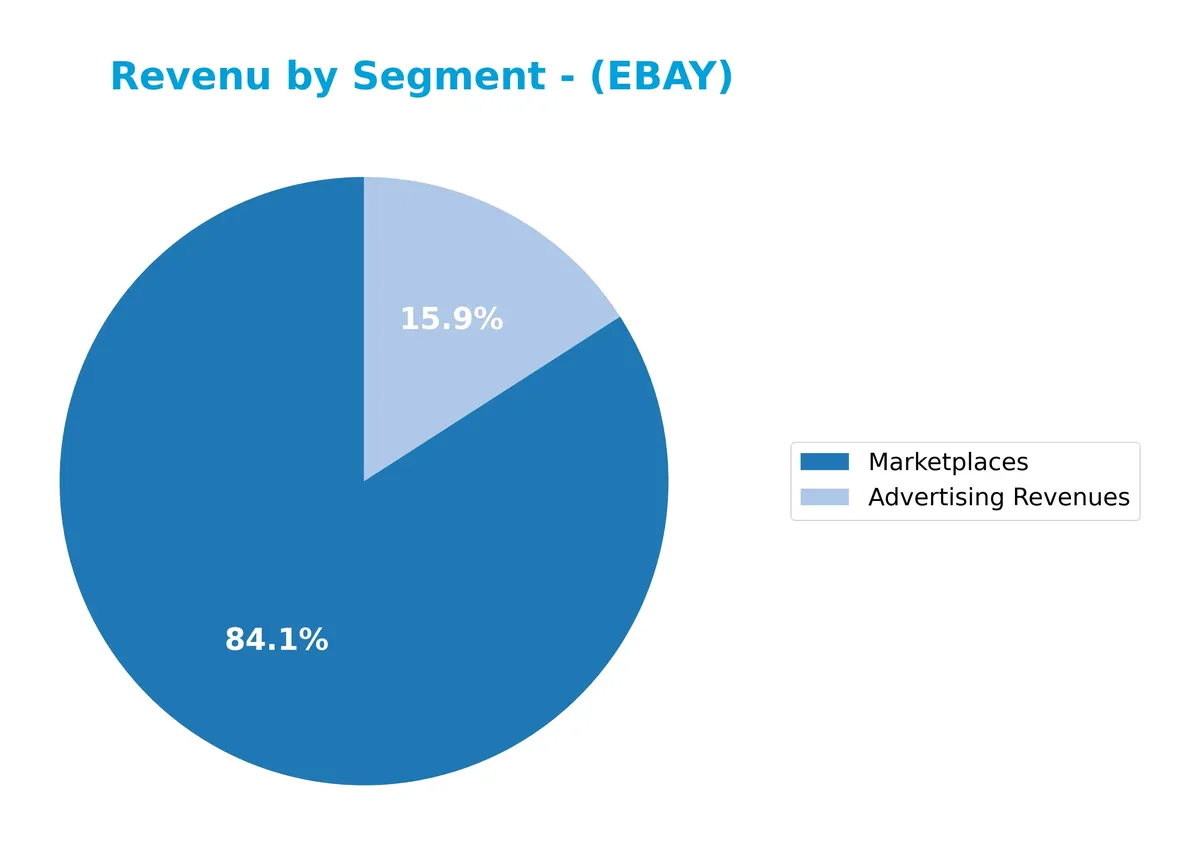
In 2024, Marketplaces dominate eBay’s revenue with $8.6B, showing a slight decline from $10.1B in 2023, indicating some deceleration. Advertising Revenues contribute $1.6B, emerging as a meaningful secondary stream. Historically, Marketplaces have driven growth, but this recent dip suggests rising concentration risk. The shift toward advertising signals diversification but also highlights reliance on core marketplace operations.
Key Products & Brands
The table below lists eBay Inc.’s core products and brands along with their descriptions:
| Product | Description |
|---|---|
| Marketplace Platform | eBay.com and mobile apps that connect buyers and sellers globally through online and mobile channels. |
| Advertising Revenues | Income from marketing services offered to sellers and third parties on eBay’s platform. |
| Marketplaces | Core e-commerce transaction revenues generated from listing, buying, and selling activities. |
| Payments | Payment processing services associated with transactions on eBay’s platform (historical). |
| StubHub | Ticket resale platform formerly owned by eBay, generating revenue until divestiture (historical). |
eBay’s revenue primarily derives from its Marketplace platform, which includes online listings and transactions. Advertising and payment services supplement this core business. StubHub contributed revenue before its divestiture.
Main Competitors
There are 10 main competitors in the Specialty Retail industry; below is a table of the top 10 leaders by market capitalization:
| Competitor | Market Cap. |
|---|---|
| Amazon.com, Inc. | 2.4T |
| Alibaba Group Holding Limited | 340B |
| PDD Holdings Inc. | 159B |
| MercadoLibre, Inc. | 102B |
| eBay Inc. | 39.4B |
| Ulta Beauty, Inc. | 27.8B |
| Tractor Supply Company | 26.9B |
| Williams-Sonoma, Inc. | 23.0B |
| Genuine Parts Company | 17.2B |
| Best Buy Co., Inc. | 14.5B |
eBay Inc. ranks 5th among its top 10 competitors in Specialty Retail. Its market cap stands at just 1.53% of Amazon’s, the sector leader. eBay is below the average market cap of the top 10 competitors (317B) but above the sector median (33.6B). It holds a significant gap of +174.91% above its closest rival above, indicating a clear buffer in market scale.
Comparisons with competitors
Check out how we compare the company to its competitors:
Does EBAY have a competitive advantage?
EBAY does not present a clear competitive advantage based on available data. The company shows a declining return on invested capital (ROIC) trend and lacks ROIC versus WACC comparison, signaling potential value erosion.
Looking ahead, EBAY’s marketplace platform connects buyers and sellers globally, with steady revenue from the United States and Europe. Future growth may hinge on expanding product offerings and international market penetration.
SWOT Analysis
This SWOT analysis highlights eBay Inc.’s core strategic factors influencing its market position and growth potential.
Strengths
- strong brand recognition
- large active user base
- high gross margin (71.45%)
Weaknesses
- declining ROIC
- weak liquidity ratios
- zero EBIT margin
Opportunities
- expanding international markets
- growth in mobile commerce
- leveraging data analytics for personalization
Threats
- intense competition from Amazon and Shopify
- regulatory risks in global markets
- margin pressure from increased marketing spend
eBay’s strengths in brand and margin provide a solid foundation. However, declining returns and liquidity issues require strategic focus. Growth opportunities lie in international expansion and tech innovation, but competition and regulatory risks pose significant challenges.
Stock Price Action Analysis
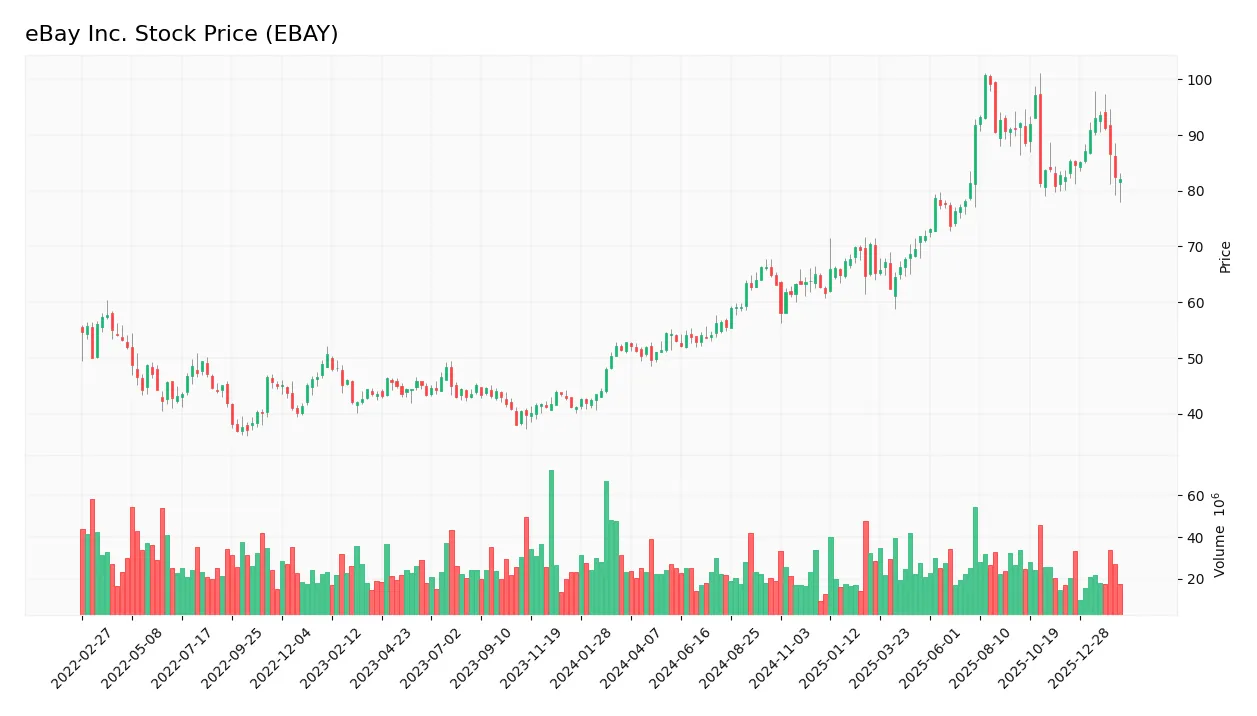
The weekly stock chart illustrates eBay Inc.’s price movements and volatility during the past 12 months:
Trend Analysis
Over the past year, eBay’s stock surged 55.7%, confirming a bullish trend despite decelerating momentum. Price volatility remains elevated with a 13.98% standard deviation. The stock peaked at 100.7 and bottomed at 49.65, reflecting wide trading ranges but sustained upward pressure overall.
Volume Analysis
Trading volume totals 3.1B shares, with buyers accounting for 63.5%, indicating strong buyer-driven activity. However, volume is decreasing, suggesting waning market participation. In the recent three-month period, sellers slightly dominate at 57.8%, reflecting cautious investor sentiment heading into 2026.
Target Prices
Analysts set a clear price range reflecting cautious optimism for eBay Inc.
| Target Low | Target High | Consensus |
|---|---|---|
| 65 | 115 | 96.54 |
The target prices indicate expectations for moderate growth, with a consensus suggesting a near 10% upside from recent levels.

Don’t Let Luck Decide Your Entry Point
Optimize your entry points with our advanced ProRealTime indicators. You’ll get efficient buy signals with precise price targets for maximum performance. Start outperforming now!
Analyst & Consumer Opinions
This section examines analyst ratings and consumer feedback to provide insight into eBay Inc.’s market perception.
Stock Grades
Here is the latest summary of analyst grades for eBay Inc. from recognized firms and their recent actions:
| Grading Company | Action | New Grade | Date |
|---|---|---|---|
| UBS | Maintain | Neutral | 2026-02-17 |
| Citizens | Maintain | Market Outperform | 2026-01-28 |
| Morgan Stanley | Maintain | Overweight | 2026-01-13 |
| Wells Fargo | Maintain | Equal Weight | 2026-01-08 |
| Truist Securities | Maintain | Hold | 2025-11-03 |
| Piper Sandler | Maintain | Overweight | 2025-10-30 |
| Cantor Fitzgerald | Maintain | Neutral | 2025-10-30 |
| Wells Fargo | Maintain | Equal Weight | 2025-10-30 |
| Benchmark | Maintain | Buy | 2025-10-30 |
| UBS | Maintain | Neutral | 2025-10-30 |
The overall grading trend remains stable with no recent upgrades or downgrades. Most analysts maintain a neutral to moderately positive stance, reflecting balanced expectations for eBay’s near-term performance.
Consumer Opinions
Consumers express mixed feelings about eBay, reflecting its broad marketplace appeal and occasional service frustrations.
| Positive Reviews | Negative Reviews |
|---|---|
| “Wide variety of products at competitive prices.” | “Occasional delays in shipping times.” |
| “User-friendly platform with helpful buyer protections.” | “Customer service can be slow to respond.” |
| “Great deals on rare and vintage items.” | “Seller reliability varies significantly.” |
Overall, buyers appreciate eBay’s extensive selection and buyer protections. However, shipping delays and inconsistent seller quality remain persistent concerns.
Risk Analysis
Below is a summary table highlighting key risks facing eBay Inc. as of 2026:
| Category | Description | Probability | Impact |
|---|---|---|---|
| Financial Health | Altman Z-Score in grey zone indicates moderate bankruptcy risk | Medium | High |
| Liquidity | Current and quick ratios unavailable, signaling liquidity issues | High | Medium |
| Profitability | ROE and ROIC at zero, showing weak capital returns | Medium | Medium |
| Leverage | Debt-to-equity score very unfavorable, potential over-leverage | Medium | High |
| Market Volatility | Beta at 1.38, stock is more volatile than the market | High | Medium |
| Dividend Yield | Yield at 1.33%, neutral but limited income appeal | Low | Low |
The most pressing risks are eBay’s moderate bankruptcy risk and liquidity concerns. The grey-zone Altman Z-Score near 2.84 warns of financial distress if market conditions worsen. Zero reported ROE and ROIC suggest weak capital efficiency, while excessive leverage threatens stability. These factors require cautious monitoring amid eBay’s volatile stock behavior.
Should You Buy eBay Inc.?
eBay appears to show improving profitability and operational efficiency, yet its competitive moat could be seen as eroding given declining ROIC trends. Despite a manageable leverage profile, debt metrics suggest caution. The overall B+ rating indicates a very favorable, yet moderate risk profile.
Strength & Efficiency Pillars
eBay Inc. sustains robust profitability with a net margin of 18.3%, reflecting operational strength despite flat EBIT margins. The company’s Piotroski Score of 5 signals average financial health, while strong gross margin at 71.45% underscores pricing power and cost control. However, the absence of ROIC data and unavailable WACC preclude confirming eBay as a value creator. Nonetheless, its solid net margin and favorable interest expense (-2.22%) highlight operational resilience amid a challenging environment.
Weaknesses and Drawbacks
eBay’s Altman Z-Score stands at 2.84, placing it in the grey zone—signaling moderate bankruptcy risk that warrants caution. The company’s debt-to-equity ratio is very unfavorable, hinting at leverage concerns that could pressure solvency. Valuation metrics show mixed signals with a neutral P/E of 19.68 but a very unfavorable P/B ratio, which may reflect market skepticism or asset undervaluation. Additionally, slight recent seller dominance (42.19% buyers) and decelerating price momentum suggest mounting short-term headwinds.
Our Final Verdict about eBay Inc.
Despite a fundamentally bullish long-term trend and operational profitability, eBay’s moderate Altman Z-Score and leverage issues introduce uncertainty. The recent slight seller dominance and valuation concerns suggest a cautious stance. Thus, eBay’s profile may appear suitable for investors with an appetite for moderate risk but warrants a wait-and-see approach for a more favorable entry point.
Disclaimer: This content is for informational purposes only and does not constitute financial, investment, or other professional advice. Investing in financial markets involves a significant risk of loss, and past performance is not indicative of future results.
Additional Resources
- eBay to Acquire Depop from Etsy – PR Newswire (Feb 18, 2026)
- eBay Inc. Reports Fourth Quarter and Full Year 2025 Results – eBay Inc. (Feb 18, 2026)
- EBay Buys Fashion Marketplace Depop, Reports Robust Results – Bloomberg.com (Feb 18, 2026)
- eBay Inc. Reports Fourth Quarter and Full Year 2025 Results – PR Newswire (Feb 18, 2026)
- EBay Inc. Reveals Fall In Q4 Profit – Nasdaq (Feb 18, 2026)
For more information about eBay Inc., please visit the official website: ebayinc.com