Home > Analyses > Industrials > Eaton Corporation plc
Eaton Corporation powers the world’s infrastructure with critical energy management solutions that keep industries and homes running safely and efficiently. It commands leadership in industrial machinery through cutting-edge electrical components, aerospace systems, and vehicle technologies. Renowned for innovation and quality, Eaton shapes vital sectors from power distribution to eMobility. As market dynamics evolve, I explore whether Eaton’s robust fundamentals continue to support its premium valuation and growth ambitions.
Table of contents
Business Model & Company Overview
Eaton Corporation plc, founded in 1911 and headquartered in Dublin, Ireland, stands as a global leader in power management solutions. Its diverse portfolio spans electrical components, aerospace systems, vehicle transmissions, and eMobility products, forming a cohesive ecosystem that addresses industrial, commercial, and military needs. With nearly 95K employees worldwide, Eaton drives innovation across multiple sectors, embedding itself deeply within critical infrastructure.
The company’s revenue engine balances hardware sales with growing software and recurring service offerings across the Americas, Europe, and Asia. Eaton’s Electrical, Aerospace, Vehicle, and eMobility segments collectively deliver robust cash flow through product diversity and after-market support. Its economic moat lies in its integrated product suite and long-standing industry relationships, positioning Eaton to shape the future of power management globally.
Financial Performance & Fundamental Metrics
I analyze Eaton Corporation plc’s income statement, key financial ratios, and dividend payout policy to assess its operational efficiency and shareholder value creation.
Income Statement
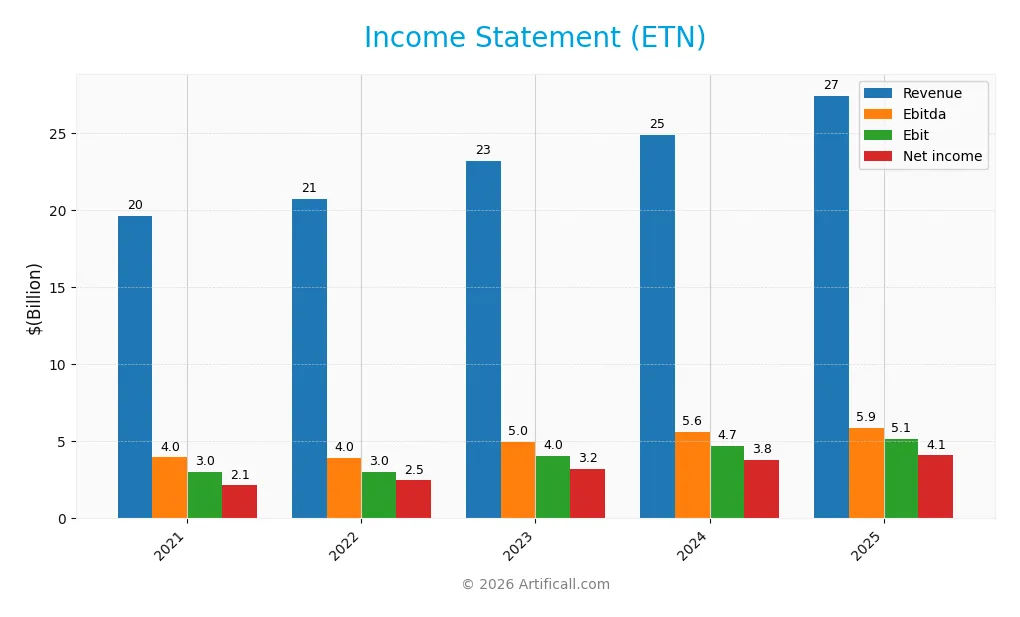
The table below summarizes Eaton Corporation plc’s key income statement figures for fiscal years 2021 through 2025, reported in USD.
| 2021 | 2022 | 2023 | 2024 | 2025 | |
|---|---|---|---|---|---|
| Revenue | 19.6B | 20.8B | 23.2B | 24.9B | 27.4B |
| Cost of Revenue | 13.3B | 13.8B | 14.8B | 15.4B | 17.1B |
| Operating Expenses | 3.4B | 3.7B | 4.4B | 4.6B | 5.1B |
| Gross Profit | 6.3B | 6.9B | 8.4B | 9.5B | 10.3B |
| EBITDA | 4.0B | 3.9B | 5.0B | 5.6B | 5.9B |
| EBIT | 3.0B | 3.0B | 4.0B | 4.7B | 5.1B |
| Interest Expense | 144M | 88M | 208M | 144M | 264M |
| Net Income | 2.1B | 2.5B | 3.2B | 3.8B | 4.1B |
| EPS | 5.38 | 6.18 | 8.06 | 9.54 | 10.49 |
| Filing Date | 2022-02-23 | 2023-02-23 | 2024-02-29 | 2025-02-27 | 2026-02-26 |
Income Statement Evolution
Eaton’s revenue grew steadily from $19.6B in 2021 to $27.4B in 2025, a 40% increase overall. Net income nearly doubled, rising from $2.1B to $4.1B, reflecting strong margin expansion. Gross margin improved to 37.6%, while EBIT margin climbed to 18.8%, indicating enhanced operational efficiency and cost control.
Is the Income Statement Favorable?
The 2025 income statement shows solid fundamentals. Revenue growth of 10.3% outpaced cost increases, supporting a gross profit rise of 8.6%. Operating expenses grew in line with revenue, preserving margin integrity. Despite a slight 2.3% net margin dip year-over-year, net income and EPS growth remained robust. Overall, the income statement is favorable with high profitability and efficient capital allocation.
Financial Ratios
The table below summarizes Eaton Corporation plc’s key financial ratios for 2021 through 2025, providing insight into profitability, liquidity, leverage, and market valuation:
| Ratios | 2021 | 2022 | 2023 | 2024 | 2025 |
|---|---|---|---|---|---|
| Net Margin | 11% | 12% | 14% | 15% | 15% |
| ROE | 13% | 14% | 17% | 21% | 21% |
| ROIC | 7% | 9% | 11% | 13% | 13% |
| P/E | 32.1 | 25.4 | 29.9 | 34.8 | 30.2 |
| P/B | 4.2 | 3.7 | 5.0 | 7.1 | 6.4 |
| Current Ratio | 1.04 | 1.38 | 1.51 | 1.50 | 1.32 |
| Quick Ratio | 0.63 | 0.84 | 1.02 | 0.96 | 0.81 |
| D/E | 0.54 | 0.53 | 0.51 | 0.53 | 0.57 |
| Debt-to-Assets | 26% | 26% | 26% | 26% | 27% |
| Interest Coverage | 19.9 | 36.8 | 19.2 | 33.8 | 19.8 |
| Asset Turnover | 0.58 | 0.59 | 0.60 | 0.65 | 0.67 |
| Fixed Asset Turnover | 5.60 | 5.58 | 5.55 | 5.49 | 5.40 |
| Dividend Yield | 1.77% | 2.08% | 1.43% | 1.14% | 1.32% |
Evolution of Financial Ratios
Return on Equity (ROE) steadily improved from 13.1% in 2021 to 21.1% in 2025, reflecting enhanced profitability. The Current Ratio fluctuated mildly, peaking near 1.5 before settling at 1.32, indicating stable liquidity. Debt-to-Equity Ratio remained relatively stable around 0.5 to 0.57, showing consistent leverage management across the period.
Are the Financial Ratios Fovorable?
In 2025, profitability ratios like ROE (21.05%) and net margin (14.9%) are favorable, signaling strong returns. Liquidity ratios such as Current Ratio (1.32) and Quick Ratio (0.81) are neutral, suggesting adequate but not robust short-term coverage. Leverage ratios are neutral to favorable, with Debt-to-Equity at 0.57 and Debt-to-Assets at 27.1%. Market valuation metrics like P/E (30.24) and P/B (6.37) are unfavorable, indicating potential overvaluation relative to earnings and book value. Overall, the financial profile is slightly favorable, balancing solid profitability with mixed market multiples.
Shareholder Return Policy
Eaton Corporation maintains a consistent dividend payout ratio near 40%, with a 2025 dividend per share of $4.19 and a yield of approximately 1.3%. The dividend is well covered by free cash flow, supported by a payout plus capex coverage ratio of 2.75, reflecting prudent capital allocation.
The company also engages in share buybacks, complementing dividends to return capital. This balanced approach supports sustainable long-term shareholder value by combining steady income with share repurchases, avoiding excessive distributions or financial strain.
Score analysis
The following radar chart illustrates Eaton Corporation plc’s key financial scores across valuation, profitability, and leverage metrics:
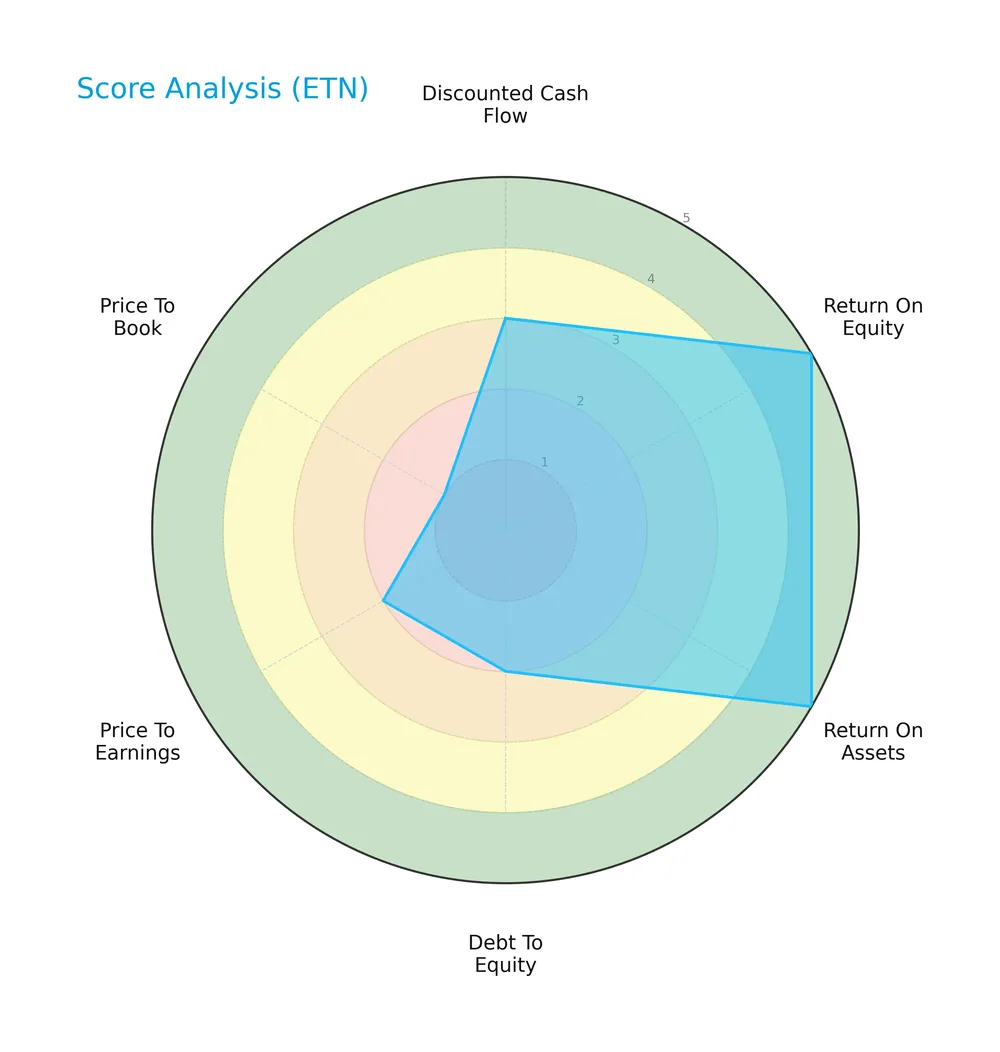
Eaton scores very favorably on return on equity and assets, indicating operational strength. However, valuation metrics like price-to-book and price-to-earnings are weak. Debt-to-equity also signals some financial risk, reflecting moderate overall balance.
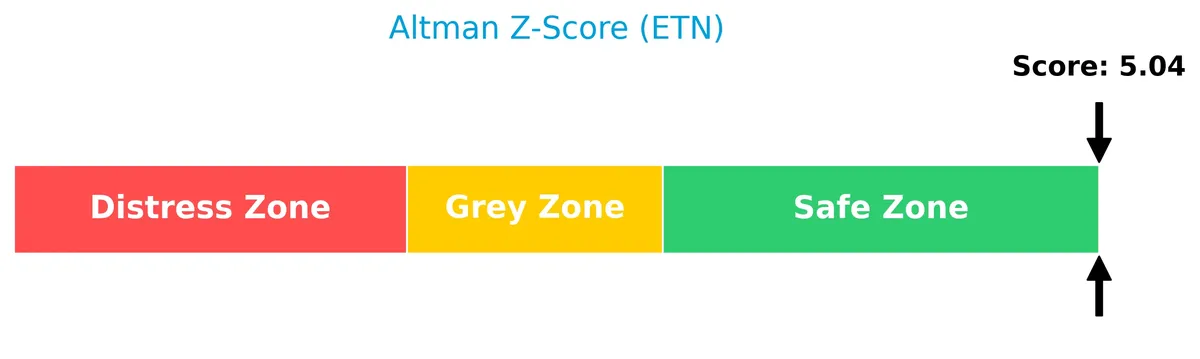
Analysis of the company’s bankruptcy risk
Eaton’s Altman Z-Score places it firmly in the safe zone, indicating low bankruptcy risk and solid financial stability:
Is the company in good financial health?
The Piotroski Score diagram below evaluates Eaton’s financial health based on profitability, leverage, and efficiency:

With a score of 6, Eaton shows average financial strength. The company demonstrates reasonable fundamentals but leaves room for improvement toward a stronger health rating.
Competitive Landscape & Sector Positioning
This sector analysis examines Eaton Corporation plc’s strategic positioning, revenue segments, and key products. I will assess whether Eaton holds a competitive advantage versus its main industry peers.
Strategic Positioning
Eaton Corporation plc maintains a diversified product portfolio spanning Electrical, Aerospace, Vehicle, and eMobility segments, with Electrical Americas leading at $13.3B in 2025. Geographically, the company is heavily concentrated in the U.S. market, generating $17.1B, while maintaining significant presence in Europe and Asia Pacific.
Revenue by Segment
This pie chart illustrates Eaton Corporation’s revenue breakdown by segment for fiscal year 2025, highlighting the relative contribution of each business unit.
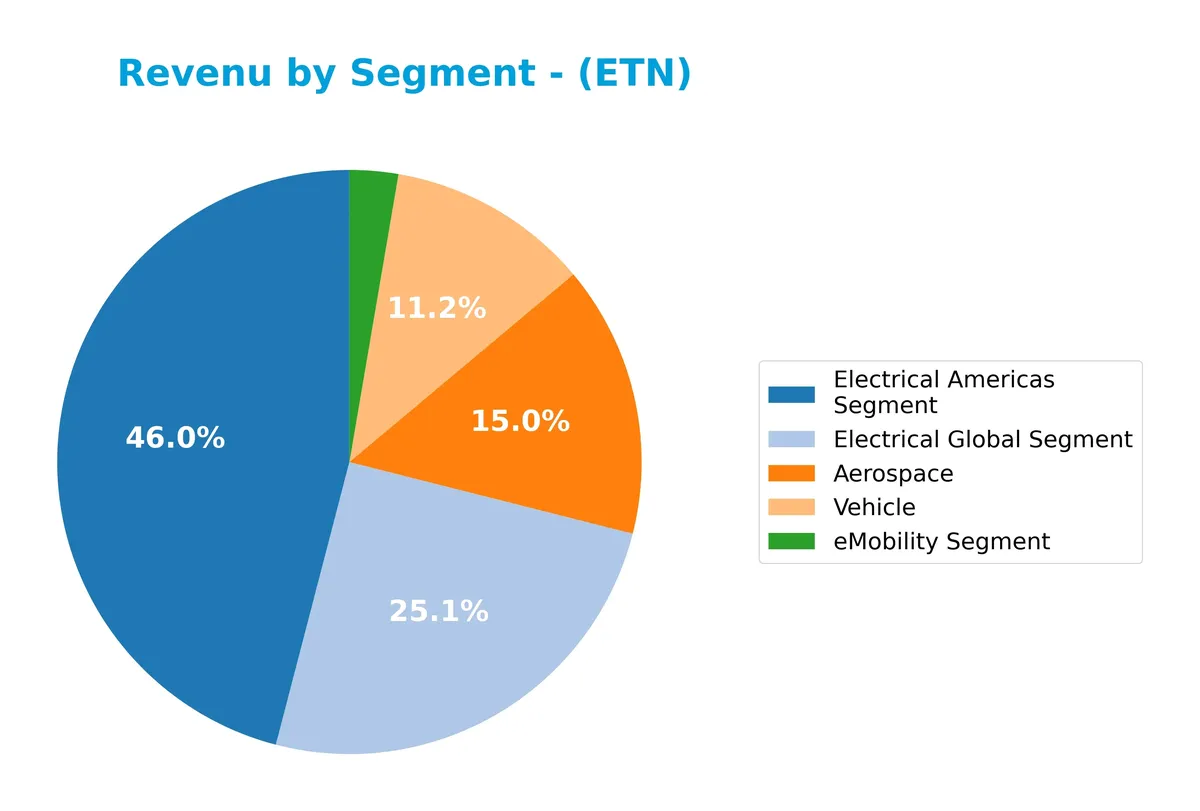
In 2025, the Electrical Americas Segment leads with $13.3B, followed by Electrical Global at $6.8B and Aerospace at $4.2B. Vehicle and eMobility segments contribute $2.5B and $618M respectively. The Electrical Americas segment continues to accelerate, signaling strong demand. Aerospace shows consistent growth, while eMobility faces slight contraction, indicating emerging but volatile exposure. Concentration remains in electrical segments, underscoring dependence on industrial and infrastructure markets.
Key Products & Brands
Eaton Corporation plc operates across diverse industrial product lines and brands, including electrical, aerospace, vehicle, and eMobility segments:
| Product | Description |
|---|---|
| Electrical Americas Segment | Electrical components, power distribution, wiring devices, circuit protection, utility power distribution, and hazardous duty electrical equipment in the Americas. |
| Electrical Global Segment | Industrial components, power quality and connectivity products, fire detection, explosion-proof instrumentation, and structural support systems worldwide excluding Americas. |
| Aerospace Segment | Pumps, motors, hydraulic power units, valves, electronic controls, aircraft flap and slat systems, air-to-air refueling systems, oxygen generation, and wiring connectors for commercial and military aircraft. |
| Vehicle Segment | Transmissions, clutches, hybrid power systems, superchargers, engine valves, transmission controls, and fuel vapor components for vehicles. |
| eMobility Segment | Voltage inverters, converters, onboard chargers, circuit protection units, vehicle controls, power distribution systems, and commercial vehicle hybrid systems. |
Eaton’s product portfolio covers critical electrical infrastructure, aerospace systems, vehicle drivetrains, and emerging eMobility technologies, reflecting a broad industrial machinery footprint.
Main Competitors
Eaton Corporation plc competes with 24 firms in the Industrials sector. The table below shows the top 10 leaders by market capitalization:
| Competitor | Market Cap. |
|---|---|
| Eaton Corporation plc | 127B |
| Parker-Hannifin Corporation | 114B |
| Howmet Aerospace Inc. | 85B |
| Emerson Electric Co. | 76B |
| Illinois Tool Works Inc. | 73B |
| Cummins Inc. | 72B |
| AMETEK, Inc. | 48B |
| Roper Technologies, Inc. | 47B |
| Rockwell Automation, Inc. | 45B |
| Symbotic Inc. | 36B |
Eaton ranks 1st among 24 competitors. Its market cap is 14% above the nearest rival, Parker-Hannifin. Eaton stands well above both the average top-10 cap of 72B and sector median of 32B. The 27% gap to the next competitor below confirms Eaton’s clear leadership position.
Comparisons with competitors
Check out how we compare the company to its competitors:
Does Eaton have a competitive advantage?
Eaton demonstrates a very favorable competitive advantage, consistently generating a return on invested capital (ROIC) 4.4% above its weighted average cost of capital (WACC). Its ROIC has grown by over 76% from 2021 to 2025, signaling efficient capital use and sustained value creation.
Looking ahead, Eaton’s diversified segments—including electrical components, aerospace, vehicle systems, and eMobility—position it well for growth. Expanding markets in the U.S., Europe, and Asia Pacific, along with innovations in power management and hybrid systems, offer promising opportunities.
SWOT Analysis
This analysis highlights Eaton Corporation plc’s key internal and external factors shaping its strategic outlook.
Strengths
- strong global market presence
- diversified product portfolio
- high ROIC exceeding WACC
Weaknesses
- elevated P/E and P/B ratios signal valuation risk
- moderate liquidity ratios
- debt-to-equity score indicates leverage concerns
Opportunities
- expanding eMobility segment
- growing revenues in Asia Pacific and Europe
- increasing demand for power management solutions
Threats
- intense competition in industrial machinery
- exposure to global economic cycles
- raw material cost volatility
Eaton’s robust profitability and competitive moat support long-term value creation. However, elevated valuation multiples and leverage require cautious monitoring. The firm should capitalize on eMobility growth while managing cyclical and cost pressures prudently.
Stock Price Action Analysis
The weekly stock chart for Eaton Corporation plc (ETN) illustrates price movement and volatility over the past 12 months:
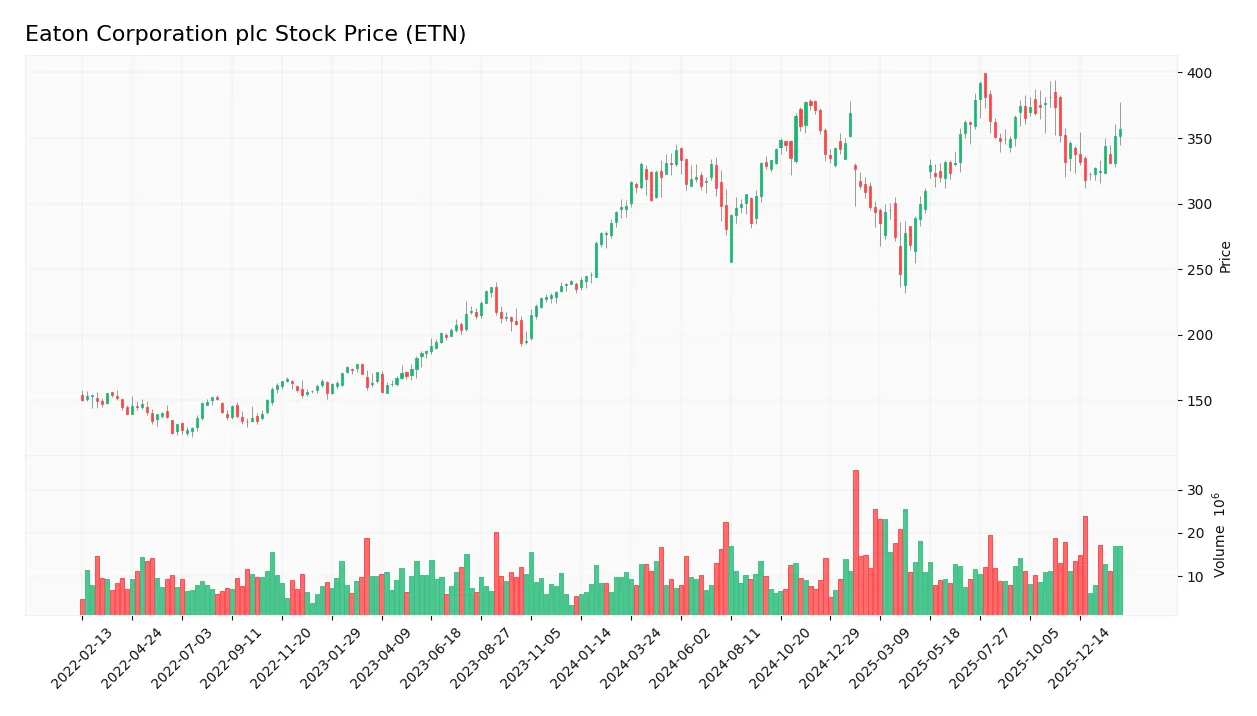
Trend Analysis
Over the past year, ETN’s stock price rose by 13.34%, confirming a bullish trend with clear acceleration. The price fluctuated between a low of 246.52 and a high of 392.17. Volatility remains elevated, with a standard deviation of 30.32, reflecting significant market swings.
Volume Analysis
Trading volume shows an increasing trend, with buyer volume slightly dominating at 54.05% in the recent three months. This buyer-driven activity suggests growing investor interest and positive market participation in ETN stock.
Target Prices
Analysts set a firm target consensus for Eaton Corporation plc, reflecting measured optimism.
| Target Low | Target High | Consensus |
|---|---|---|
| 295 | 495 | 394 |
The target range signals expectations of solid upside potential, with a consensus near 394, suggesting confidence in Eaton’s strategic positioning and earnings growth.

Don’t Let Luck Decide Your Entry Point
Optimize your entry points with our advanced ProRealTime indicators. You’ll get efficient buy signals with precise price targets for maximum performance. Start outperforming now!
Analyst & Consumer Opinions
This section examines Eaton Corporation plc’s recent analyst ratings alongside consumer feedback to gauge market sentiment.
Stock Grades
The following table presents recent verified stock grades for Eaton Corporation plc from leading financial institutions:
| Grading Company | Action | New Grade | Date |
|---|---|---|---|
| Evercore ISI Group | Maintain | In Line | 2026-02-23 |
| Wells Fargo | Maintain | Equal Weight | 2026-02-04 |
| HSBC | Upgrade | Buy | 2026-01-16 |
| JP Morgan | Maintain | Overweight | 2026-01-16 |
| Citigroup | Maintain | Buy | 2026-01-12 |
| Morgan Stanley | Maintain | Overweight | 2026-01-12 |
| Barclays | Maintain | Equal Weight | 2026-01-07 |
| UBS | Downgrade | Neutral | 2026-01-05 |
| Wells Fargo | Maintain | Equal Weight | 2025-12-18 |
| Wolfe Research | Upgrade | Outperform | 2025-12-09 |
Most analysts maintain a stable view, with several upgrades to buy or outperform grades. The consensus skews positive, reflecting cautious optimism amid market variability.
Consumer Opinions
Eaton Corporation plc draws mixed consumer sentiment, reflecting its market complexity and product diversity.
| Positive Reviews | Negative Reviews |
|---|---|
| Reliable product performance under heavy use | Customer service response times are slow |
| Strong focus on innovation and sustainability | Pricing is higher compared to competitors |
| Durable and well-engineered components | Occasional delays in order fulfillment |
Overall, consumers praise Eaton for durability and innovation, but consistent service delays and premium pricing remain frequent concerns. These issues could affect brand loyalty despite product quality.
Risk Analysis
Below is a summary table highlighting Eaton Corporation plc’s key risk factors, their probability, and potential impact on the business:
| Category | Description | Probability | Impact |
|---|---|---|---|
| Valuation Risk | Elevated P/E (30.24) and high P/B (6.37) ratios suggest the stock is priced above fair value. | High | High |
| Market Volatility | Beta of 1.18 indicates sensitivity to market swings, increasing share price volatility. | Medium | Medium |
| Liquidity Risk | Current ratio of 1.32 and quick ratio of 0.81 indicate moderate short-term liquidity. | Medium | Medium |
| Debt Risk | Debt-to-equity ratio of 0.57 and debt-to-assets 27.08% show manageable but notable leverage. | Medium | Medium |
| Operational Risk | Industrial sector cyclicality may pressure margins during economic downturns. | Medium | High |
The most pressing risk is valuation. Historically, high multiples in industrial machinery signal potential price corrections. Eaton’s P/E surpasses the S&P 500 average, raising downside risk. Market volatility also impacts performance given the company’s beta above 1. While liquidity and debt metrics remain within reasonable range, they warrant monitoring amid macroeconomic uncertainty. Operational risks tied to industrial cycles could amplify earnings pressure if global growth slows.
Should You Buy Eaton Corporation plc?
Eaton Corporation plc appears to be a robust value creator with a very favorable competitive moat, supported by growing ROIC well above WACC. Despite a manageable leverage profile, its overall B+ rating suggests moderate risk-adjusted potential in the current market context.
Strength & Efficiency Pillars
Eaton Corporation plc exhibits robust operational efficiency, underscored by a net margin of 14.9% and a return on equity of 21.05%. The company’s return on invested capital (ROIC) stands at 13.14%, comfortably exceeding its weighted average cost of capital (WACC) of 8.7%, confirming Eaton as a clear value creator. This efficiency is further supported by a strong gross margin of 37.59% and an EBIT margin of 18.76%, signaling disciplined cost management amid growth. Historically, such margins denote a durable competitive advantage in industrial sectors.
Weaknesses and Drawbacks
Despite operational strengths, Eaton faces valuation headwinds with a high price-to-earnings ratio of 30.24 and a price-to-book ratio of 6.37, both unfavorable and suggesting premium market pricing that may limit near-term upside. The debt-to-equity ratio is moderate at 0.57, rated neutral, but investors should monitor leverage closely as rising interest rates could pressure financial flexibility. The current ratio of 1.32 is neutral, indicating adequate but not excessive liquidity. These factors collectively imply some valuation risk and moderate balance sheet caution.
Our Final Verdict about Eaton Corporation plc
Eaton’s fundamental profile appears attractive for long-term exposure, supported by strong profitability and value creation. The stock’s bullish trend, combined with slightly buyer-dominant recent trading (54.05%), suggests positive momentum. However, premium valuation multiples and moderate leverage warrant prudence. Investors might consider Eaton as a core industrial holding but remain alert for better entry points amid market volatility.
Disclaimer: This content is for informational purposes only and does not constitute financial, investment, or other professional advice. Investing in financial markets involves a significant risk of loss, and past performance is not indicative of future results.
Additional Resources
- Decoding Eaton Corp PLC (ETN): A Strategic SWOT Insight – GuruFocus (Feb 27, 2026)
- RS Large Cap Value Strategy’s Analysis on Eaton Corporation (ETN) – Yahoo Finance (Feb 23, 2026)
- Eaton Corporation, PLC (ETN) is Drawing Interest from Investors: Essential Information You Need to Know – bitget.com (Feb 24, 2026)
- Eaton increases quarterly dividend to $1.10 per share – Business Wire (Feb 26, 2026)
- Wall Street Analysts Think Eaton (ETN) Is a Good Investment: Is It? – Finviz (Feb 23, 2026)
For more information about Eaton Corporation plc, please visit the official website: eaton.com