Home > Analyses > Consumer Defensive > e.l.f. Beauty, Inc.
e.l.f. Beauty, Inc. transforms everyday routines by making high-quality cosmetics and skincare accessible and affordable to millions worldwide. As a prominent player in the Household & Personal Products industry, e.l.f. leads with innovative brands like e.l.f. Cosmetics, Well People, and Keys Soulcare, combining trend-driven appeal with a commitment to clean beauty. With a dynamic presence in retail and e-commerce, the company’s future hinges on whether its strong fundamentals can sustain growth amid evolving market demands.
Table of contents
Business Model & Company Overview
e.l.f. Beauty, Inc., founded in 2004 and headquartered in Oakland, California, stands as a prominent player in the Household & Personal Products industry. The company delivers a cohesive ecosystem of cosmetic and skin care products through its e.l.f. Cosmetics, e.l.f. Skin, Well People, and Keys Soulcare brands. This integrated portfolio spans eye, lip, face, paw, and skin care categories, underscoring a core mission to provide accessible beauty solutions worldwide.
The company’s revenue engine balances direct-to-consumer e-commerce channels in the US with national and international retail partnerships, primarily through distributors. This dual approach supports a broad geographic footprint across the Americas, Europe, and Asia. e.l.f. Beauty’s competitive advantage lies in its ability to blend product innovation with scalable distribution, creating a durable economic moat that shapes the future of accessible beauty.
Financial Performance & Fundamental Metrics
I will analyze e.l.f. Beauty, Inc.’s income statement, key financial ratios, and dividend payout policy to provide a clear view of its fundamental strengths and risks.
Income Statement
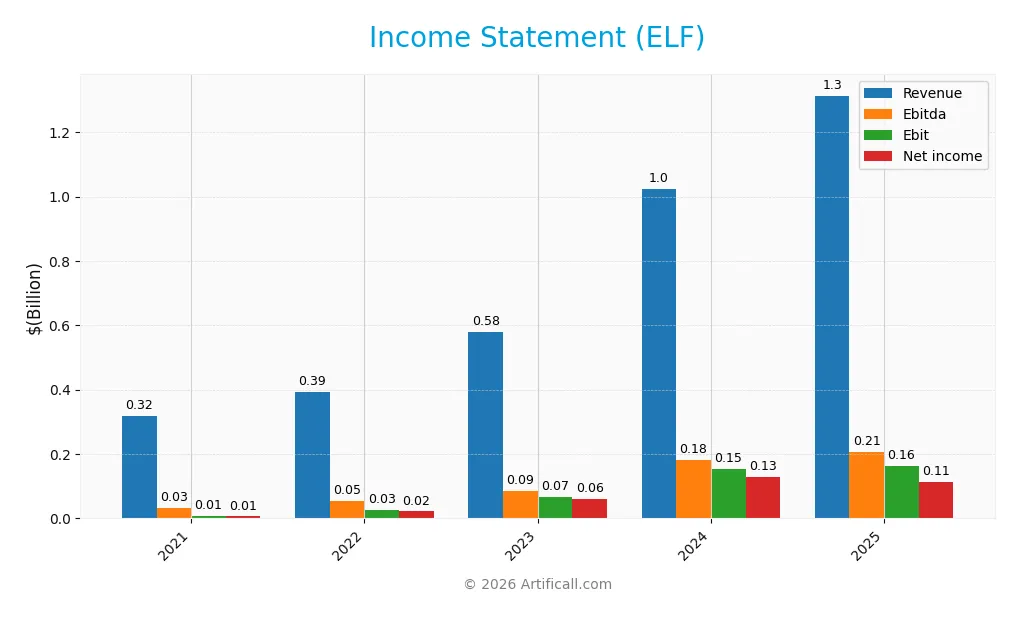
The table below summarizes e.l.f. Beauty, Inc.’s key income statement figures over the last five fiscal years, providing a clear view of its financial performance.
| 2021 | 2022 | 2023 | 2024 | 2025 | |
|---|---|---|---|---|---|
| Revenue | 318.1M | 392.2M | 578.8M | 1.02B | 1.31B |
| Cost of Revenue | 111.9M | 140.4M | 188.4M | 299.8M | 377.8M |
| Operating Expenses | 196.8M | 222.0M | 322.3M | 574.4M | 777.7M |
| Gross Profit | 206.2M | 251.7M | 390.4M | 724.1M | 935.7M |
| EBITDA | 32.1M | 54.6M | 85.3M | 182.6M | 206.2M |
| EBIT | 6.9M | 27.5M | 67.7M | 152.4M | 162.1M |
| Interest Expense | 4.1M | 2.4M | 4.0M | 11.8M | 17.2M |
| Net Income | 6.2M | 21.8M | 61.5M | 127.7M | 112.1M |
| EPS | 0.13 | 0.43 | 1.17 | 2.33 | 1.99 |
| Filing Date | 2021-05-27 | 2022-05-26 | 2023-05-25 | 2024-05-23 | 2025-05-29 |
Income Statement Evolution
Between 2021 and 2025, e.l.f. Beauty, Inc. recorded strong revenue growth of 313%, increasing from $318M to $1.31B. Net income also expanded significantly by nearly 1700%, from $6.2M to $112M. Gross margin remained favorable at 71.24%, while EBIT margin improved to 12.34%. However, operating expenses grew in line with revenue, indicating stable but pressured cost control.
Is the Income Statement Favorable?
In 2025, e.l.f. Beauty’s fundamentals appear generally favorable, supported by a healthy gross margin and improving EBIT margin. Revenue grew 28.3% year-over-year, with gross profit up 29.2%, but net margin declined by 31.6%, reflecting increased operating expenses relative to revenue. Earnings per share fell 13.1%, which alongside a modest 6.4% EBIT growth suggests some margin compression despite overall positive trends.
Financial Ratios
The table below presents key financial ratios for e.l.f. Beauty, Inc. over the fiscal years 2021 to 2025, illustrating profitability, liquidity, valuation, leverage, and efficiency metrics:
| Ratios | 2021 | 2022 | 2023 | 2024 | 2025 |
|---|---|---|---|---|---|
| Net Margin | 2.0% | 5.6% | 10.6% | 12.5% | 8.5% |
| ROE | 2.3% | 7.0% | 15.0% | 19.9% | 14.7% |
| ROIC | 2.2% | 5.8% | 13.1% | 14.5% | 11.2% |
| P/E | 213 | 60 | 70 | 82 | 31 |
| P/B | 4.9 | 4.2 | 10.5 | 16.4 | 4.6 |
| Current Ratio | 2.3 | 3.0 | 2.8 | 1.6 | 3.1 |
| Quick Ratio | 1.5 | 1.7 | 2.1 | 1.0 | 2.0 |
| D/E | 0.56 | 0.37 | 0.20 | 0.45 | 0.41 |
| Debt-to-Assets | 31% | 24% | 14% | 26% | 25% |
| Interest Coverage | 2.3x | 12.2x | 17.1x | 12.6x | 9.2x |
| Asset Turnover | 0.65 | 0.79 | 0.97 | 0.91 | 1.05 |
| Fixed Asset Turnover | 23.1 | 37.1 | 73.5 | 73.3 | 45.6 |
| Dividend Yield | 0% | 0% | 0% | 0% | 0% |
Evolution of Financial Ratios
From 2021 to 2025, e.l.f. Beauty, Inc. showed a generally improving trend in Return on Equity (ROE), rising from 2.31% to 14.73%, indicating enhanced profitability. The Current Ratio fluctuated but ended higher at 3.05 in 2025, suggesting stronger liquidity. The Debt-to-Equity Ratio decreased from 0.56 to 0.41, reflecting reduced leverage and a more conservative capital structure.
Are the Financial Ratios Favorable?
In 2025, profitability ratios such as net margin (8.53%) and ROE (14.73%) were neutral, while return on invested capital (11.21%) was unfavorable. Liquidity showed mixed signals: a favorable quick ratio (2.0) but an unfavorable current ratio (3.05). Leverage ratios, including debt-to-equity (0.41) and debt-to-assets (25.08%), were favorable. Market valuation ratios like P/E (31.49) and P/B (4.64) were unfavorable, resulting in an overall neutral assessment of the company’s financial ratios.
Shareholder Return Policy
e.l.f. Beauty, Inc. does not pay dividends, reflecting a reinvestment strategy likely aimed at supporting growth and innovation. The absence of dividend payouts is consistent across fiscal years, with no indication of share buyback programs either, emphasizing retained earnings for business expansion.
This shareholder return approach prioritizes capital allocation toward operational and strategic initiatives rather than immediate income distribution. Such a policy aligns with potential long-term value creation but requires monitoring to ensure sustained profitability and cash flow generation support investor interests over time.
Score analysis
The following radar chart displays key financial scores to provide a comprehensive view of the company’s valuation and performance metrics:
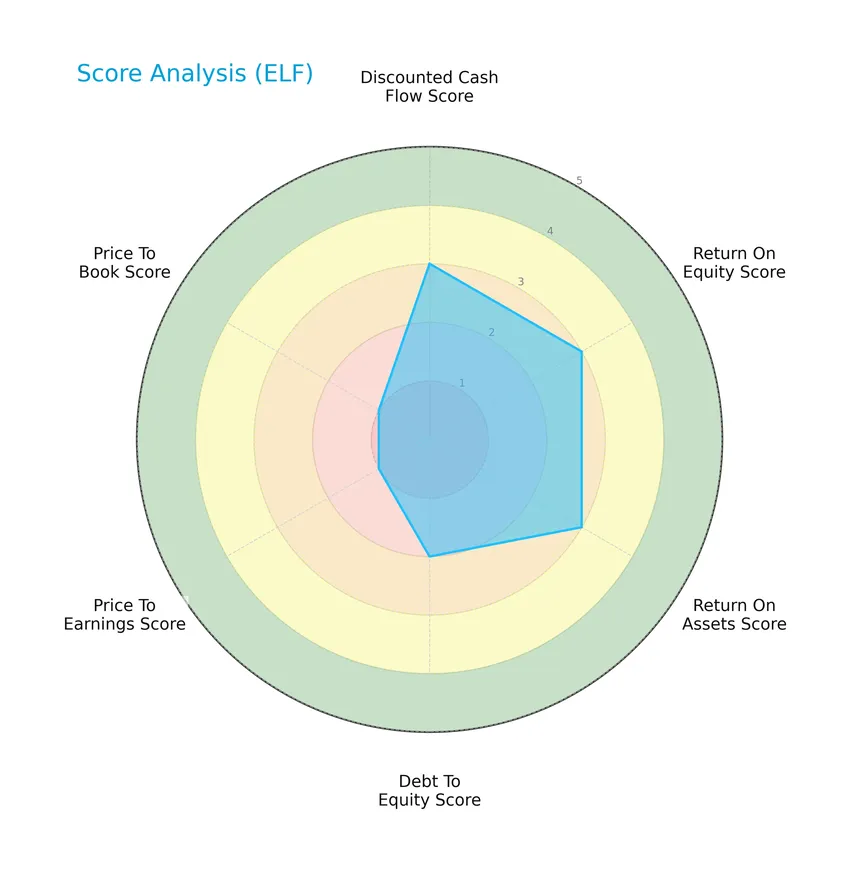
The company shows moderate scores in discounted cash flow, return on equity, and return on assets, indicating average operational efficiency. Debt-to-equity is also moderate, while valuation metrics price-to-earnings and price-to-book scores are very unfavorable, reflecting potential market pricing concerns.
Analysis of the company’s bankruptcy risk
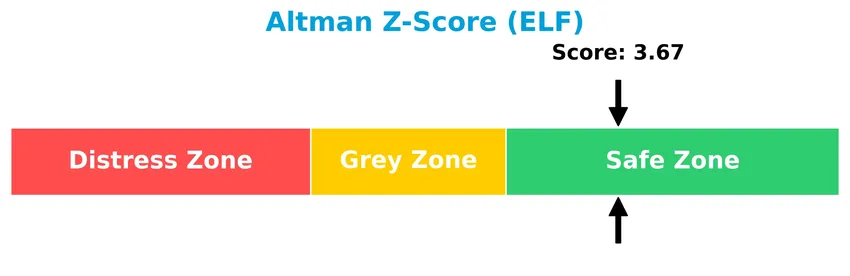
The Altman Z-Score indicates that the company is in the safe zone, suggesting a low risk of bankruptcy based on its financial ratios:
Is the company in good financial health?
The Piotroski Score diagram offers insight into the company’s financial strength based on profitability, leverage, liquidity, and efficiency:

With a Piotroski Score of 5, the company’s financial health is considered average, reflecting moderate overall strength but room for improvement in key financial areas.
Competitive Landscape & Sector Positioning
This sector analysis will examine e.l.f. Beauty, Inc.’s strategic positioning, revenue streams, key products, and main competitors. I will assess whether the company holds a competitive advantage within the Household & Personal Products industry.
Strategic Positioning
e.l.f. Beauty, Inc. maintains a concentrated product portfolio focused on cosmetics and skin care under several brand names, primarily serving the U.S. market, which generated $1.06B in revenue in 2025, while international sales totaled $250M, indicating gradual geographic diversification.
Key Products & Brands
The following table outlines e.l.f. Beauty, Inc.’s main products and brand lines:
| Product | Description |
|---|---|
| e.l.f. Cosmetics | Cosmetic products including eye, lip, and face makeup sold worldwide. |
| e.l.f. Skin | Skin care products offered globally under the e.l.f. brand. |
| Well People | A brand focusing on clean beauty skin care and cosmetic products. |
| Keys Soulcare | Skin care and wellness products marketed as part of a holistic beauty approach. |
e.l.f. Beauty, Inc. markets a diversified portfolio of cosmetic and skin care products under four primary brands, distributed through multiple retail and e-commerce channels worldwide.
Main Competitors
There are 17 competitors in total, with the table below listing the top 10 leaders by market capitalization:
| Competitor | Market Cap. |
|---|---|
| The Procter & Gamble Company | 331.3B |
| Unilever PLC | 143.2B |
| Colgate-Palmolive Company | 62.6B |
| The Estée Lauder Companies Inc. | 38.5B |
| Kimberly-Clark Corporation | 33.7B |
| Kenvue Inc. | 33.2B |
| Church & Dwight Co., Inc. | 20.2B |
| The Clorox Company | 12.3B |
| e.l.f. Beauty, Inc. | 4.3B |
| Inter Parfums, Inc. | 2.7B |
e.l.f. Beauty, Inc. ranks 9th among its 17 competitors in the Household & Personal Products industry. Its market cap is only 1.69% of the leader, The Procter & Gamble Company. The company is below the average market cap of the top 10 competitors (68.2B) but above the sector median (4.3B). Notably, e.l.f. Beauty has a 119% market cap gap to its closest competitor above, The Clorox Company, indicating a significant distance in scale.
Does ELF have a competitive advantage?
e.l.f. Beauty, Inc. currently shows a slightly unfavorable competitive advantage as its return on invested capital (ROIC) is below its weighted average cost of capital (WACC), indicating value destruction despite growing profitability. The company’s income statement evaluation is favorable with strong gross margins of 71.24% and positive revenue growth, but net margin and EPS growth have recently declined.
Looking ahead, e.l.f. Beauty’s expanding presence in the United States and international markets, supported by direct-to-consumer e-commerce and distribution channels, offers future opportunities. Continued growth in ROIC and sustained revenue increases suggest potential for improved value creation as the company develops new products and extends its market reach.
Comparisons with competitors
Check out how we compare the company to its competitors:
SWOT Analysis
This SWOT analysis highlights the key internal and external factors impacting e.l.f. Beauty, Inc. to guide investment decisions.
Strengths
- Strong revenue growth of 28% in 2025
- High gross margin at 71.24%
- Diversified brand portfolio including e.l.f. Cosmetics and Well People
Weaknesses
- Elevated beta of 1.72 indicating high volatility
- Declining net margin growth (-31.56%) in 2025
- High price multiples with PE of 31.49 and PB of 4.64
Opportunities
- Expanding international sales with rapid growth outside US
- Increasing direct-to-consumer e-commerce channels
- Rising consumer demand for clean and affordable beauty products
Threats
- Intense competition in personal care sector
- Economic downturns impacting discretionary spending
- Risks from supply chain disruptions and regulatory changes
Overall, e.l.f. Beauty shows robust growth and strong brand recognition but faces margin pressure and valuation risks. Strategic focus on international expansion and e-commerce could mitigate threats and leverage growth opportunities.
Stock Price Action Analysis
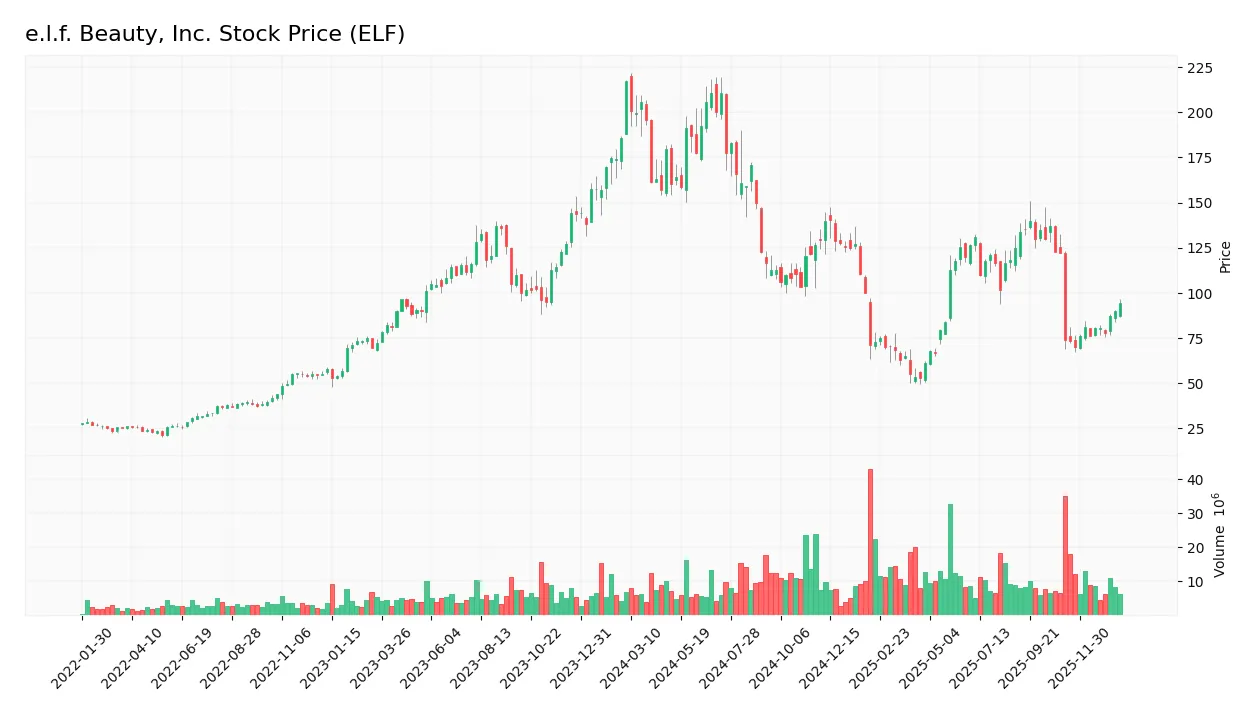
The weekly stock chart of e.l.f. Beauty, Inc. (ELF) illustrates price fluctuations and trend shifts over the past 12 months:
Trend Analysis
Over the past 12 months, ELF’s stock price declined by 56.69%, indicating a bearish trend with accelerating downward momentum. The price ranged from a high of 217.4 to a low of 52.65, accompanied by high volatility with a standard deviation of 42.66. A recent 2.5-month period shows a 27.69% price increase, but this is still within an overall bearish context.
Volume Analysis
Trading volume is increasing overall, with buyers accounting for 50.25% of total activity historically. However, in the recent period from November 2025 to January 2026, sellers dominated with only 38.65% buyer volume. This seller-driven volume suggests cautious investor sentiment and potential resistance to upward price momentum.
Target Prices
The consensus target prices for e.l.f. Beauty, Inc. indicate a moderately optimistic outlook among analysts.
| Target High | Target Low | Consensus |
|---|---|---|
| 165 | 85 | 117.83 |
Analysts expect e.l.f. Beauty’s stock price to range between 85 and 165, with an average consensus near 118, reflecting cautious optimism in its growth potential.
Analyst & Consumer Opinions
This section reviews recent analyst ratings and consumer feedback related to e.l.f. Beauty, Inc. (ELF).

Don’t Let Luck Decide Your Entry Point
Optimize your entry points with our advanced ProRealTime indicators. You’ll get efficient buy signals with precise price targets for maximum performance. Start outperforming now!
Stock Grades
Below is the summary of recent verified stock grades for e.l.f. Beauty, Inc. from well-known financial institutions:
| Grading Company | Action | New Grade | Date |
|---|---|---|---|
| TD Cowen | Maintain | Buy | 2026-01-21 |
| UBS | Maintain | Neutral | 2026-01-14 |
| Piper Sandler | Maintain | Neutral | 2025-12-22 |
| JP Morgan | Maintain | Overweight | 2025-12-18 |
| Goldman Sachs | Maintain | Buy | 2025-11-07 |
| JP Morgan | Maintain | Overweight | 2025-11-06 |
| UBS | Maintain | Neutral | 2025-11-06 |
| Jefferies | Maintain | Buy | 2025-11-06 |
| Canaccord Genuity | Maintain | Buy | 2025-11-06 |
| Baird | Maintain | Outperform | 2025-11-06 |
The grades predominantly reflect a positive sentiment with a majority of Buy and Overweight ratings, while several firms maintain Neutral assessments, indicating a balanced outlook without recent changes in recommendations.
Consumer Opinions
Consumers of e.l.f. Beauty, Inc. (ELF) express a mix of enthusiasm and constructive criticism, reflecting a dynamic engagement with the brand.
| Positive Reviews | Negative Reviews |
|---|---|
| Affordable prices with quality comparable to high-end brands. | Packaging sometimes feels flimsy and not eco-friendly. |
| Wide variety of shades catering to diverse skin tones. | Limited availability of some popular products in stores. |
| Cruelty-free and vegan products resonate well with ethical shoppers. | Some users report inconsistency in product texture and pigmentation. |
Overall, consumers appreciate e.l.f. Beauty for its affordability, inclusivity, and ethical stance, while concerns focus mainly on product packaging and occasional quality inconsistencies.
Risk Analysis
Below is an overview of key risks associated with e.l.f. Beauty, Inc., categorized by their likelihood and potential impact:
| Category | Description | Probability | Impact |
|---|---|---|---|
| Market Volatility | High beta (1.72) indicates sensitivity to market fluctuations affecting stock price. | High | Medium |
| Valuation Risk | Unfavorable PE (31.49) and PB (4.64) ratios suggest the stock may be overvalued. | Medium | High |
| Operational Efficiency | ROIC (11.21%) below WACC (11.59%) signals potential inefficiencies in capital use. | Medium | Medium |
| Dividend Policy | No dividend yield could deter income-focused investors, impacting demand. | High | Low |
| Financial Health | Altman Z-Score of 3.67 places the company in a safe zone, but Piotroski score of 5 is average. | Low | Low |
| Liquidity Risk | Current ratio of 3.05 is unfavorable despite a favorable quick ratio of 2.0. | Low | Medium |
The most concerning risks are the stock’s elevated valuation multiples and its sensitivity to market swings, which could lead to volatility in returns. Operational inefficiencies also warrant caution, as returns on invested capital do not currently exceed cost of capital, potentially limiting growth and profitability.
Should You Buy e.l.f. Beauty, Inc.?
e.l.f. Beauty, Inc. appears to be improving its operational efficiency with a growing return on invested capital, yet it could be seen as shedding value overall. Despite a manageable leverage profile and safe-zone Altman Z-Score, the company’s rating remains moderate at C+, suggesting cautious interpretation.
Strength & Efficiency Pillars
e.l.f. Beauty, Inc. exhibits solid profitability metrics with a net margin of 8.53% and a return on equity (ROE) of 14.73%, reflecting moderate operational efficiency. The company maintains a healthy financial structure highlighted by an Altman Z-score of 3.67, placing it securely in the safe zone and indicating low bankruptcy risk. Its Piotroski score of 5 suggests average financial strength. While the return on invested capital (ROIC) at 11.21% falls slightly below the weighted average cost of capital (WACC) at 11.59%, signaling value erosion, the firm benefits from favorable leverage ratios and strong asset turnover, supporting operational effectiveness.
Weaknesses and Drawbacks
Valuation metrics present clear concerns, with a price-to-earnings (P/E) ratio of 31.49 and a price-to-book (P/B) ratio of 4.64, both deemed unfavorable and indicating a premium market valuation that may limit upside potential. The current ratio stands at 3.05, flagged as unfavorable due to potential inefficiency in asset utilization despite a favorable quick ratio of 2.0. Market pressure is evident in the recent period where seller dominance prevails, with buyer volume at 38.65%, suggesting short-term headwinds amid a bearish longer-term stock trend marked by a cumulative price decline of 56.69%.
Our Verdict about e.l.f. Beauty, Inc.
The long-term fundamental profile of e.l.f. Beauty, Inc. may appear moderately favorable, supported by solid profitability and financial stability. However, the technical outlook is bearish, compounded by recent seller dominance which suggests caution. Despite the company’s operational resilience and strong growth over the past years, recent market pressure might warrant a wait-and-see approach for investors seeking a more attractive entry point. The premium valuation and value erosion signals add layers of risk that investors should consider carefully.
Disclaimer: This content is for informational purposes only and does not constitute financial, investment, or other professional advice. Investing in financial markets involves a significant risk of loss, and past performance is not indicative of future results.
Additional Resources
- e.l.f Beauty, Inc. (ELF) Maintains Analyst Attention With 2026 Growth Potential – Yahoo Finance (Jan 22, 2026)
- e.l.f Beauty, Inc. (ELF) Maintains Analyst Attention With 2026 Growth Potential – Insider Monkey (Jan 22, 2026)
- e.l.f. Beauty Draws $4.8 Million Buy Even as Shares Sit Nearly 25% Below Last Year – The Motley Fool (Jan 21, 2026)
- e.l.f. Beauty schedules Feb. 4 webcast on Q3 2026 results – Stock Titan (Jan 21, 2026)
- H&M and E.l.f. Team Up on Limited-edition Fragrance Line – WWD (Jan 22, 2026)
For more information about e.l.f. Beauty, Inc., please visit the official website: elfcosmetics.com