Home > Analyses > Technology > DXC Technology Company
DXC Technology shapes the backbone of global digital transformation, powering mission-critical IT for thousands of enterprises. Its leadership in information technology services spans analytics, cloud migration, and cybersecurity, driving innovation that redefines how businesses operate. Known for integrating legacy systems with modern cloud solutions, DXC influences industries worldwide. As the tech landscape evolves rapidly, I question whether DXC’s fundamentals still support its current valuation and growth prospects in 2026.

Table of contents
Business Model & Company Overview
DXC Technology Company, founded in 1981 and headquartered in Ashburn, Virginia, stands as a major player in Information Technology Services. It operates a cohesive ecosystem spanning Global Business Services and Global Infrastructure Services. The company’s mission centers on accelerating digital transformation through analytics, software engineering, and agile process automation. Its comprehensive solutions empower businesses to innovate securely while optimizing operations across multiple industries.
DXC’s revenue engine balances software-driven insights with scalable IT infrastructure management. It serves clients across North America, Europe, Asia, and Australia, offering cloud migration, security, and IT outsourcing. This global footprint enhances its ability to deliver cost-effective, mission-critical systems. I see DXC’s competitive advantage in its integrated service model and robust partner ecosystem, shaping the future of enterprise technology with a durable economic moat.
Financial Performance & Fundamental Metrics
I analyze DXC Technology Company’s income statement, key financial ratios, and dividend payout policy to assess its core profitability and capital efficiency.
Income Statement
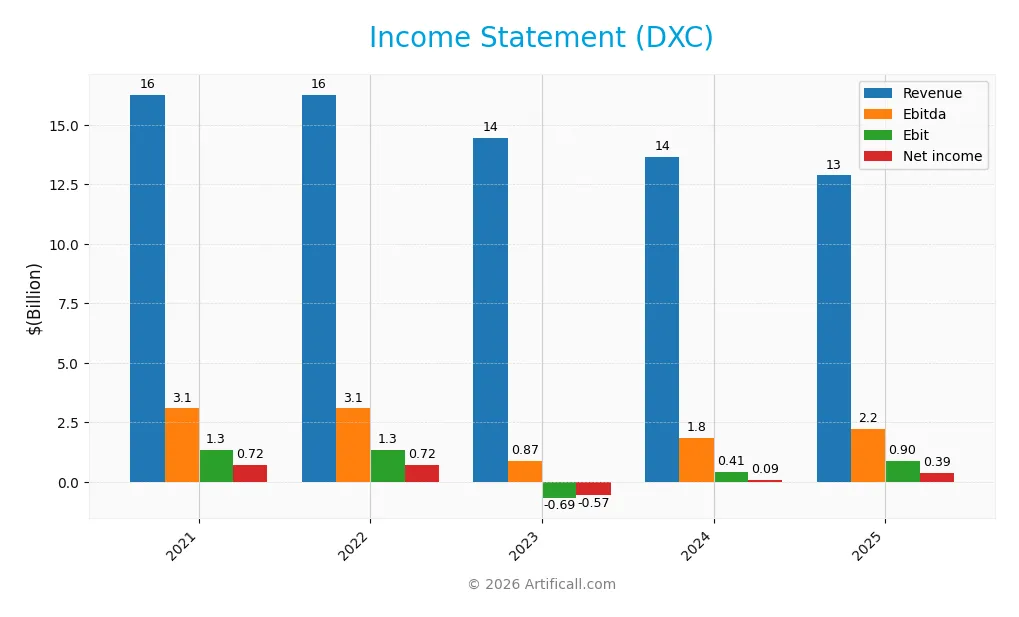
The table below presents DXC Technology Company’s key income statement figures for fiscal years 2021 through 2025 in USD.
| 2021 | 2022 | 2023 | 2024 | 2025 | |
|---|---|---|---|---|---|
| Revenue | 16.3B | 16.3B | 14.4B | 13.7B | 12.9B |
| Cost of Revenue | 12.7B | 12.7B | 11.2B | 10.6B | 9.8B |
| Operating Expenses | 2.4B | 2.4B | 4.3B | 3.1B | 2.4B |
| Gross Profit | 3.6B | 3.6B | 3.2B | 3.1B | 3.1B |
| EBITDA | 3.1B | 3.1B | 866M | 1.8B | 2.2B |
| EBIT | 1.3B | 1.3B | -685M | 407M | 895M |
| Interest Expense | 361M | 204M | 200M | 298M | 265M |
| Net Income | 718M | 718M | -568M | 91M | 389M |
| EPS | -0.59 | 2.87 | -2.47 | 0.46 | 2.15 |
| Filing Date | 2021-05-28 | 2022-05-26 | 2023-05-19 | 2024-05-17 | 2025-05-15 |
Income Statement Evolution
DXC’s revenue declined 5.8% in 2025 after a broader 20.9% drop since 2021. Gross profit remained stable, reflecting a consistent 24% gross margin. Operating expenses fell in line with revenue, supporting a near 7% EBIT margin. Net income surged by 354% in 2025, recovering from losses earlier in the period, yet remains below 2021 levels.
Is the Income Statement Favorable?
In 2025, DXC posted $12.9B revenue and $389M net income, yielding a 3.0% net margin, classified as neutral. EBIT improved sharply to $895M, boosting operating leverage despite a 2.1% interest expense ratio. The earnings per share jumped 357%, underpinning improved profitability. Overall, half of the income statement metrics are favorable, supporting a generally positive fundamental outlook.
Financial Ratios
The following table presents key financial ratios for DXC Technology Company over the last five fiscal years, highlighting profitability, liquidity, leverage, and efficiency metrics:
| Ratios | 2021 | 2022 | 2023 | 2024 | 2025 |
|---|---|---|---|---|---|
| Net Margin | -0.009 | 0.044 | -0.039 | 0.007 | 0.030 |
| ROE | 0.142 | 0.142 | -0.162 | 0.032 | 0.120 |
| ROIC | 0.051 | 0.051 | -0.064 | -0.000 | 0.044 |
| P/E | 11.06 | 11.36 | -10.30 | 45.25 | 7.92 |
| P/B | 1.57 | 1.61 | 1.67 | 1.46 | 0.95 |
| Current Ratio | 1.09 | 1.09 | 1.18 | 1.17 | 1.22 |
| Quick Ratio | 1.09 | 1.09 | 1.18 | 1.17 | 1.22 |
| D/E | 1.22 | 1.22 | 1.53 | 1.73 | 1.41 |
| Debt-to-Assets | 0.31 | 0.31 | 0.34 | 0.35 | 0.34 |
| Interest Coverage | 3.16 | 5.59 | -5.71 | -0.01 | 2.63 |
| Asset Turnover | 0.81 | 0.81 | 0.91 | 0.99 | 0.97 |
| Fixed Asset Turnover | 4.59 | 4.59 | 5.00 | 5.69 | 6.82 |
| Dividend Yield | 0.67% | 0.00% | 0.00% | 0.00% | 0.00% |
Evolution of Financial Ratios
From 2021 to 2025, DXC’s Return on Equity (ROE) showed volatility, hitting a low in 2023 before recovering to 12.05% in 2025. The Current Ratio gradually improved from 1.09 to 1.22, indicating better short-term liquidity. Debt-to-Equity fluctuated but remained elevated around 1.4 in 2025, highlighting persistent leverage. Profitability showed signs of recovery but remained modest.
Are the Financial Ratios Favorable?
In 2025, profitability ratios like net margin (3.02%) and ROIC (4.43%) were unfavorable or neutral, constrained by a WACC of 5.74%. Liquidity showed mixed signals: a neutral Current Ratio (1.22) versus a favorable Quick Ratio. Leverage ratios, including debt-to-equity at 1.41, were unfavorable, reflecting higher financial risk. Market multiples such as P/E (7.92) and P/B (0.95) were favorable, supporting a slightly favorable overall ratio assessment.
Shareholder Return Policy
DXC Technology Company does not pay dividends as of 2025, reflecting a strategic choice to reinvest earnings. The company maintains free cash flow coverage but does not distribute profits, likely focusing on growth and operational stability.
DXC engages in no share buybacks, signaling a cautious approach to capital allocation. This policy aligns with sustainable long-term shareholder value creation by prioritizing reinvestment over immediate returns.
Score analysis
The following radar chart displays key financial scores for DXC Technology Company, highlighting strengths and weaknesses across valuation and profitability metrics:
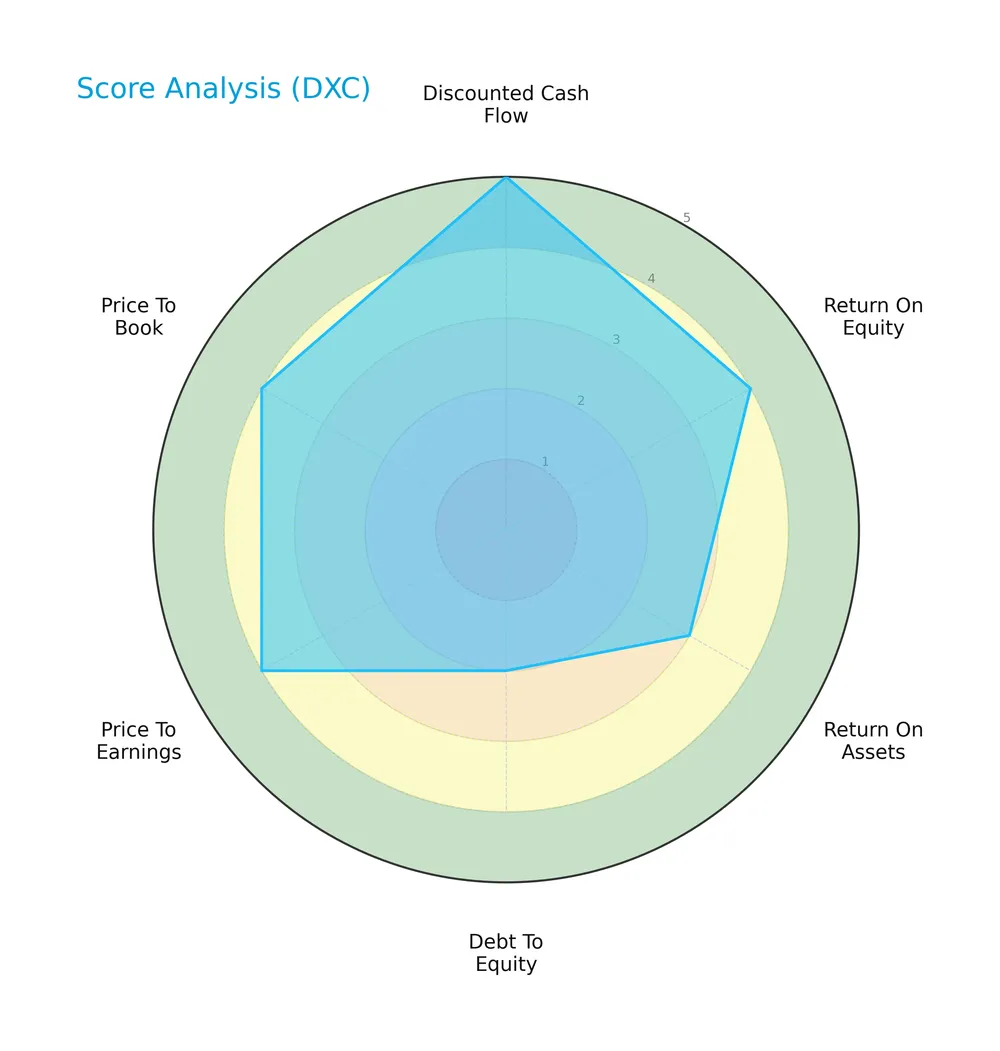
DXC posts a very favorable discounted cash flow score of 5 and favorable scores of 4 in ROE, PE, and PB. Asset returns and debt-to-equity ratios show moderate scores of 3 and 2, indicating room for improvement in operational efficiency and leverage management.
Analysis of the company’s bankruptcy risk
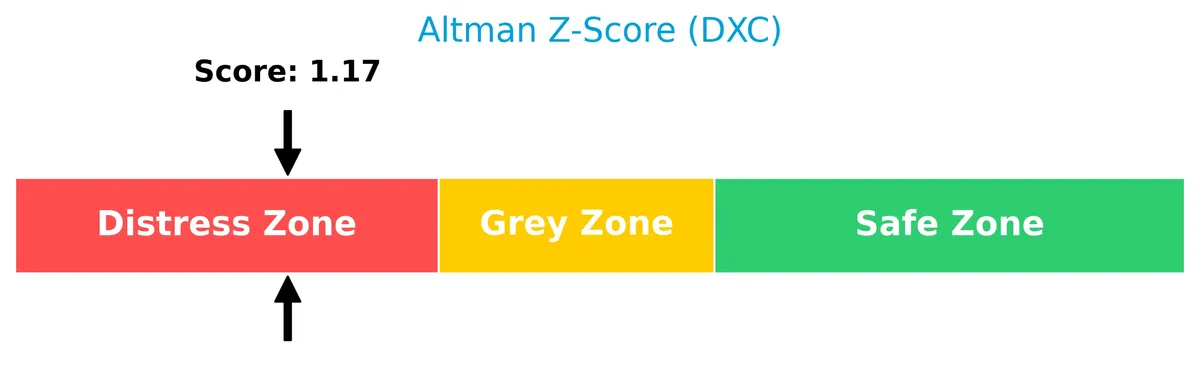
DXC’s Altman Z-Score places it in the distress zone, signaling a high risk of bankruptcy and financial distress concerns that require monitoring:
Is the company in good financial health?
The Piotroski Score diagram highlights DXC’s financial strength, based on nine criteria assessing profitability, leverage, and liquidity:
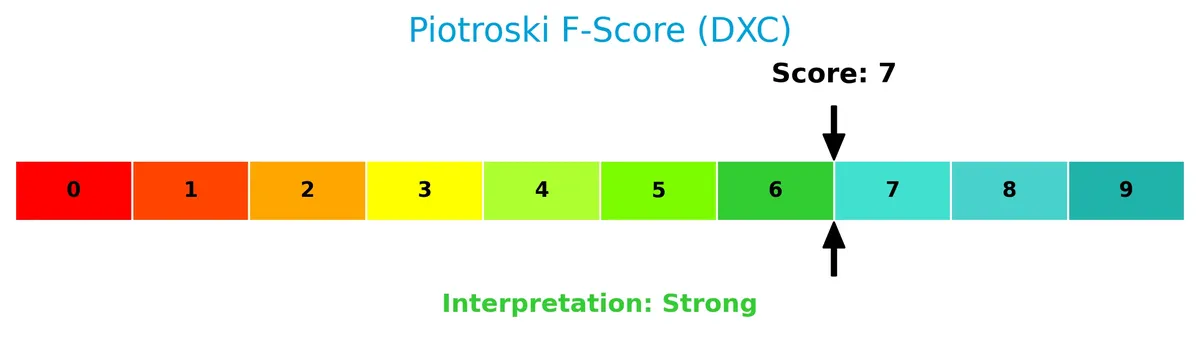
With a strong Piotroski Score of 7, DXC demonstrates solid financial health but falls short of the very strong category, suggesting generally reliable fundamentals with some caution warranted.
Competitive Landscape & Sector Positioning
This analysis reviews DXC Technology Company’s strategic positioning within the information technology services sector. It covers revenue by segment, key products, main competitors, and competitive advantages. I will assess whether DXC holds a sustainable edge over its peers in this dynamic industry.
Strategic Positioning
DXC Technology concentrates on IT services with a broad geographic footprint across North America, Europe, Asia, and Australia. It operates two segments—Global Business Services and Global Infrastructure Services—offering diversified digital transformation, cloud, and security solutions, reflecting a balanced portfolio within technology services.
Revenue by Segment
The pie chart illustrates DXC Technology Company’s revenue distribution by segment for the most recent fiscal year, highlighting the relative scale of each business unit.

DXC’s revenue heavily concentrates in its IT Services segment, which drives the business with a dominant share. Other segments contribute modestly, showing limited diversification. The latest year reveals steady reliance on core services without significant shifts, signaling stable but concentrated revenue streams that warrant close monitoring for diversification risks.
Key Products & Brands
The table below lists DXC Technology Company’s primary products and brands with their descriptions:
| Product | Description |
|---|---|
| Global Business Services | Offers analytics, software engineering, consulting, and data analytics to enable digital transformation and optimize operations. |
| Business Process Services | Integrates and optimizes front and back office processes with agile automation for operational efficiency. |
| Global Infrastructure Services | Adapts legacy apps to cloud, manages multi-cloud environments, provides security solutions, and IT outsourcing services. |
| Workplace Services | Delivers intelligent collaboration, device management, digital support, and mobility services tailored to customer needs. |
DXC Technology focuses on comprehensive IT services spanning digital transformation, cloud migration, security, and workplace solutions. Its offerings target mission-critical business functions and infrastructure.
Main Competitors
The sector includes 16 competitors; this table lists the top 10 leaders by market capitalization:
| Competitor | Market Cap. |
|---|---|
| International Business Machines Corporation | 272B |
| Accenture plc | 162B |
| Cognizant Technology Solutions Corporation | 40B |
| Fiserv, Inc. | 36B |
| Fidelity National Information Services, Inc. | 34B |
| Wipro Limited | 30B |
| Leidos Holdings, Inc. | 23B |
| Gartner, Inc. | 18B |
| CDW Corporation | 17B |
| Jack Henry & Associates, Inc. | 13B |
DXC Technology Company ranks 14th among 16 competitors, with a market cap just 0.9% of the sector leader, IBM. It stands below both the 64.6B average market cap of the top 10 and the 17.8B median for the sector. The company is 17.2% smaller than the closest competitor above, highlighting a significant scale gap.
Comparisons with competitors
Check out how we compare the company to its competitors:
Does DXC have a competitive advantage?
DXC Technology Company currently lacks a competitive advantage, as it is destroying value with a declining ROIC that remains below its WACC. This trend signals inefficiencies in capital use and diminishing profitability over the 2021-2025 period.
Looking ahead, DXC focuses on digital transformation, cloud migration, and security services across global markets. These areas present opportunities to innovate and improve operational efficiencies, which could influence future competitive positioning.
SWOT Analysis
This SWOT analysis highlights DXC Technology’s strategic position and key financial dynamics.
Strengths
- extensive global IT services portfolio
- strong partner ecosystem
- favorable valuation metrics
Weaknesses
- declining revenue over 5 years
- negative ROIC vs. WACC
- moderate debt-to-equity ratio
Opportunities
- accelerating digital transformation demand
- cloud migration services expansion
- improving operating income growth
Threats
- intense IT services competition
- technological disruption risks
- financial distress signals (Altman Z-Score)
DXC shows solid operational strengths and attractive valuation but struggles with value destruction and revenue decline. Its strategy must focus on leveraging digital transformation opportunities while managing financial risks prudently.
Stock Price Action Analysis
The weekly stock chart for DXC Technology Company displays price movements over the past 12 months, highlighting significant trend shifts and volatility patterns:
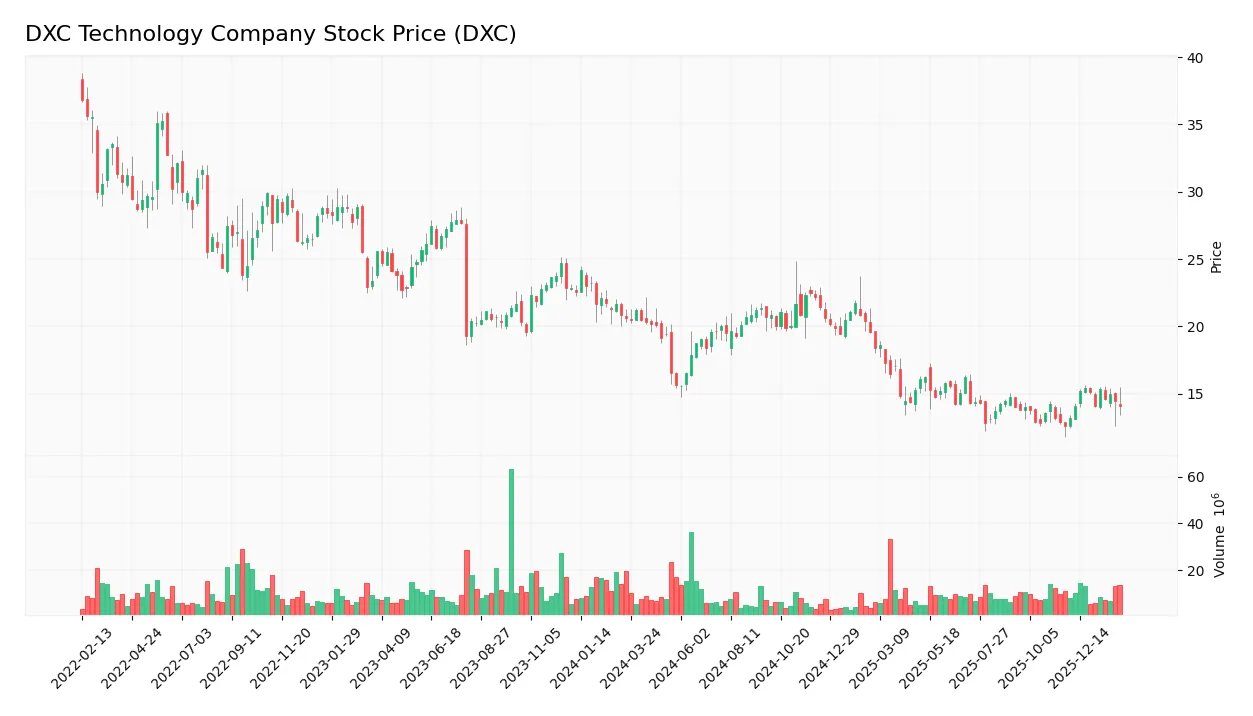
Trend Analysis
Over the past 12 months, DXC’s stock price declined by 31.64%, indicating a clear bearish trend with accelerating downward momentum. The stock oscillated between a high of 22.5 and a low of 12.59, showing elevated volatility with a 3.0 standard deviation.
Volume Analysis
In the last three months, trading volume decreased overall, with buyer volume slightly exceeding seller volume at 52.28%, suggesting mild buyer dominance. Volume trends show neutral buyer behavior, implying cautious investor sentiment and moderate market participation.
Target Prices
Analysts set a clear target consensus for DXC Technology Company.
| Target Low | Target High | Consensus |
|---|---|---|
| 13 | 14 | 13.5 |
The target prices suggest modest upside potential. The consensus of 13.5 indicates cautious optimism among analysts.

Don’t Let Luck Decide Your Entry Point
Optimize your entry points with our advanced ProRealTime indicators. You’ll get efficient buy signals with precise price targets for maximum performance. Start outperforming now!
Analyst & Consumer Opinions
This section reviews DXC Technology Company’s analyst ratings and consumer feedback to gauge market and user sentiment.
Stock Grades
Here are the latest verified grades from leading financial institutions for DXC Technology Company:
| Grading Company | Action | New Grade | Date |
|---|---|---|---|
| BMO Capital | Maintain | Market Perform | 2026-02-03 |
| Stifel | Maintain | Hold | 2025-10-31 |
| JP Morgan | Maintain | Underweight | 2025-08-20 |
| Morgan Stanley | Maintain | Equal Weight | 2025-08-01 |
| RBC Capital | Maintain | Sector Perform | 2025-08-01 |
| JP Morgan | Maintain | Underweight | 2025-05-21 |
| RBC Capital | Maintain | Sector Perform | 2025-05-15 |
| BMO Capital | Maintain | Market Perform | 2025-05-15 |
| Morgan Stanley | Maintain | Equal Weight | 2025-05-15 |
| Guggenheim | Maintain | Neutral | 2025-05-12 |
The consensus grades lean toward a Hold stance, reflecting cautious sentiment across the board. Most firms maintain their previous ratings, signaling stable but unspectacular outlooks for the stock.
Consumer Opinions
Consumer sentiment around DXC Technology Company reflects a mix of appreciation and concern.
| Positive Reviews | Negative Reviews |
|---|---|
| Reliable IT solutions with strong support | Slow response times in customer service |
| Innovative technology boosting efficiency | Complex pricing models cause confusion |
| Skilled professionals delivering results | Integration challenges with legacy systems |
Overall, customers praise DXC Technology for its innovation and skilled workforce. However, recurring issues with service speed and pricing complexity temper enthusiasm.
Risk Analysis
Below is an overview of key risks facing DXC Technology Company, categorized by their likelihood and potential impact:
| Category | Description | Probability | Impact |
|---|---|---|---|
| Financial Health | Altman Z-Score signals distress zone, indicating bankruptcy risk | High | High |
| Profitability | Low net margin (3.02%) weakens earnings sustainability | Medium | Medium |
| Leverage | Debt-to-equity ratio of 1.41 raises solvency concerns | Medium | Medium |
| Market Volatility | Beta of 1.08 exposes stock to market swings | Medium | Medium |
| Dividend Policy | Zero dividend yield limits income appeal to investors | High | Low |
I see financial distress as the most critical risk, given DXC’s Altman Z-Score below 1.8. This signals a heightened bankruptcy probability despite a strong Piotroski score of 7. The company’s moderate leverage and thin net margin add caution. Recent price volatility and lack of dividends further challenge investor confidence. Prudence demands close monitoring of liquidity and profitability trends.
Should You Buy DXC Technology Company?
DXC Technology appears to be navigating a challenging profitability and competitive landscape, with declining ROIC suggesting value erosion. Despite moderate leverage and a distress-zone Altman Z-score, the company’s A rating and strong Piotroski score suggest cautious operational efficiency and value creation potential.
Strength & Efficiency Pillars
DXC Technology Company shows moderate profitability with a 12.05% ROE and a 4.43% ROIC. The weighted average cost of capital stands at 5.74%, indicating the company is shedding value since ROIC (4.43%) is below WACC (5.74%). The Altman Z-Score of 1.17 places DXC in the distress zone, signaling financial vulnerability. However, a Piotroski score of 7 reflects strong operational fundamentals and efficient capital allocation despite broader challenges.
Weaknesses and Drawbacks
DXC’s leverage is a concern, with a debt-to-equity ratio of 1.41, which increases financial risk amid moderate interest coverage of 3.38. The net margin is low at 3.02%, reflecting weak profitability. Revenue declined by 5.82% last year and 20.87% over the longer term, underscoring top-line pressure. The stock trades at a favorable P/E of 7.92 and P/B of 0.95, but a 31.6% overall price drop and bearish long-term trend highlight significant market skepticism.
Our Verdict about DXC Technology Company
DXC’s long-term fundamental profile appears unfavorable due to value destruction and financial distress signals. Despite a recent neutral buyer dominance of 52.28% and a short-term 12.07% price rebound, the overall bearish trend and underlying weaknesses suggest a cautious stance. Investors might consider waiting for clearer signs of sustained recovery before increasing exposure to DXC.
Disclaimer: This content is for informational purposes only and does not constitute financial, investment, or other professional advice. Investing in financial markets involves a significant risk of loss, and past performance is not indicative of future results.
Additional Resources
- DXC Named Top Three IT Vendor in Europe by Whitelane Research – DXC Technology (Feb 03, 2026)
- The 5 Most Interesting Analyst Questions From DXC’s Q4 Earnings Call – Finviz (Feb 05, 2026)
- Earnings Beat: DXC Technology Company Just Beat Analyst Forecasts, And Analysts Have Been Updating Their Models – Yahoo Finance (Feb 04, 2026)
- DXC Technology Company Just Beat EPS By 102%: Here’s What Analysts Think Will Happen Next – simplywall.st (Feb 04, 2026)
- DXC – Dxc Technology Latest Stock News & Market Updates – Stock Titan (Feb 01, 2026)
For more information about DXC Technology Company, please visit the official website: dxc.com