Home > Analyses > Basic Materials > DuPont de Nemours, Inc.
DuPont de Nemours, Inc. engineers materials that power everyday technologies and critical industries worldwide. Its cutting-edge solutions span semiconductors, mobility, and water protection, reflecting a legacy of innovation and quality. As a cornerstone in specialty chemicals, DuPont shapes markets with flagship products that enable advanced manufacturing and sustainability. I’m intrigued to assess whether its robust industry position and diverse portfolio continue to justify its current valuation and growth outlook in 2026.

Table of contents
Business Model & Company Overview
DuPont de Nemours, Inc., founded in 1972 and headquartered in Wilmington, Delaware, stands as a global leader in the specialty chemicals sector. It delivers a technology-based materials ecosystem spanning electronics, mobility, and water solutions. Its three core segments—Electronics & Industrial, Mobility & Materials, and Water & Protection—work cohesively to innovate across advanced manufacturing, transportation, and safety markets.
The company’s revenue engine balances advanced materials, specialty chemicals, and integrated systems sold worldwide across the Americas, Europe, and Asia Pacific. It generates value by combining hardware-like engineered products with recurring solutions in water purification and protective systems. DuPont’s robust competitive advantage lies in its diversified portfolio and deep integration within industrial supply chains, securing its role in shaping the future of specialty materials.
Financial Performance & Fundamental Metrics
I will analyze DuPont de Nemours, Inc.’s income statement, key financial ratios, and dividend payout policy to assess its underlying financial health and shareholder value.
Income Statement
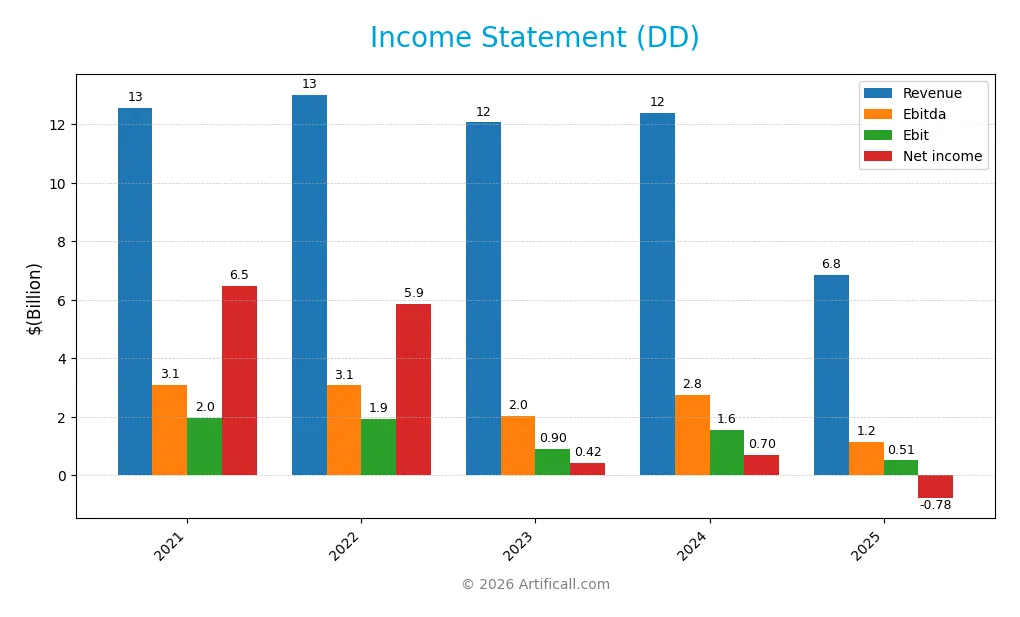
The table below presents DuPont de Nemours, Inc.’s income statement highlights for fiscal years 2021 through 2025. All figures are in USD.
| 2021 | 2022 | 2023 | 2024 | 2025 | |
|---|---|---|---|---|---|
| Revenue | 12.57B | 13.02B | 12.07B | 12.39B | 6.85B |
| Cost of Revenue | 8.54B | 8.99B | 8.44B | 8.47B | 4.78B |
| Operating Expenses | 2.16B | 2.00B | 1.92B | 2.08B | 1.21B |
| Gross Profit | 4.03B | 4.03B | 3.63B | 3.91B | 2.07B |
| EBITDA | 3.08B | 3.08B | 2.05B | 2.75B | 1.16B |
| EBIT | 1.97B | 1.94B | 0.90B | 1.56B | 0.51B |
| Interest Expense | 525M | 492M | 396M | 366M | 313M |
| Net Income | 6.47B | 5.87B | 0.42B | 0.70B | -0.78B |
| EPS | 11.92 | 11.63 | 0.94 | 1.68 | -1.87 |
| Filing Date | 2022-02-11 | 2023-02-15 | 2024-02-15 | 2025-02-14 | 2026-02-17 |
Income Statement Evolution
DuPont de Nemours’s revenue and net income have sharply declined from 2021 to 2025, with a 45.5% revenue drop overall. Gross margins remain relatively favorable at 30.25%, but net margins plunged to -11.37%, reflecting deteriorating profitability. EBIT margins show neutral stability, yet operating income and EPS contracted significantly in the last year.
Is the Income Statement Favorable?
The 2025 income statement reveals weak fundamentals. Revenue fell 44.7%, and net income swung negative to -779M, driven by large discontinued operation losses. Despite a stable gross margin, EBIT margin at 7.49% and interest expense at 4.57% of revenue offer limited relief. Overall, the statement signals unfavorable financial health and margin compression risks.
Financial Ratios
The table below summarizes key financial ratios for DuPont de Nemours, Inc. across recent fiscal years, providing a snapshot of profitability, liquidity, leverage, and efficiency metrics:
| Ratios | 2021 | 2022 | 2023 | 2024 | 2025 |
|---|---|---|---|---|---|
| Net Margin | 51% | 45% | 4% | 6% | -11% |
| ROE | 24% | 22% | 2% | 3% | -6% |
| ROIC | 4% | 4% | 5% | 4% | 2% |
| P/E | 2.8x | 2.4x | 34.2x | 19.0x | -21.5x |
| P/B | 0.69x | 0.54x | 0.60x | 0.57x | 1.21x |
| Current Ratio | 2.9x | 3.0x | 2.4x | 1.3x | 2.4x |
| Quick Ratio | 2.5x | 2.4x | 1.7x | 0.9x | 1.9x |
| D/E | 0.42x | 0.30x | 0.32x | 0.31x | 0.23x |
| Debt-to-Assets | 25% | 20% | 20% | 20% | 15% |
| Interest Coverage | 3.6x | 4.1x | 4.3x | 5.0x | 2.7x |
| Asset Turnover | 0.27x | 0.31x | 0.31x | 0.34x | 0.32x |
| Fixed Asset Turnover | 2.0x | 2.3x | 1.9x | 2.1x | 2.0x |
| Dividend Yield | 3.4% | 4.6% | 4.5% | 4.7% | 3.6% |
Evolution of Financial Ratios
DuPont’s Return on Equity (ROE) declined sharply to -5.6% in 2025, marking a notable profitability deterioration. The Current Ratio improved to 2.42, signaling enhanced liquidity. Meanwhile, the Debt-to-Equity Ratio dropped to 0.23, reflecting a more conservative leverage stance. Profitability showed significant volatility, with net margins turning negative in the latest year.
Are the Financial Ratios Favorable?
In 2025, liquidity ratios like Current and Quick Ratios remain favorable, supporting short-term financial stability. Leverage is modest with a low Debt-to-Equity ratio and 14.8% debt-to-assets, both positive signals. However, profitability metrics including ROE, net margin, and return on invested capital fall short, indicating operational challenges. Market valuation ratios such as Price-to-Book and Price-to-Earnings show a favorable outlook. Overall, the ratios present a slightly favorable yet mixed financial profile.
Shareholder Return Policy
DuPont de Nemours, Inc. maintains a consistent dividend payout with a yield around 3.5%-4.7% over recent years. The dividend payout ratio varies significantly, reflecting challenges in net profitability and free cash flow coverage. The company also engages in share buybacks alongside dividends.
Despite the dividend payments, net profit margins turned negative in 2025, signaling pressure on sustainable earnings. The mixed payout coverage and fluctuating profitability suggest risks to maintaining current distribution levels. This approach requires careful monitoring to ensure long-term shareholder value preservation.
Score analysis
The radar chart below highlights DuPont de Nemours’ key valuation and profitability scores:
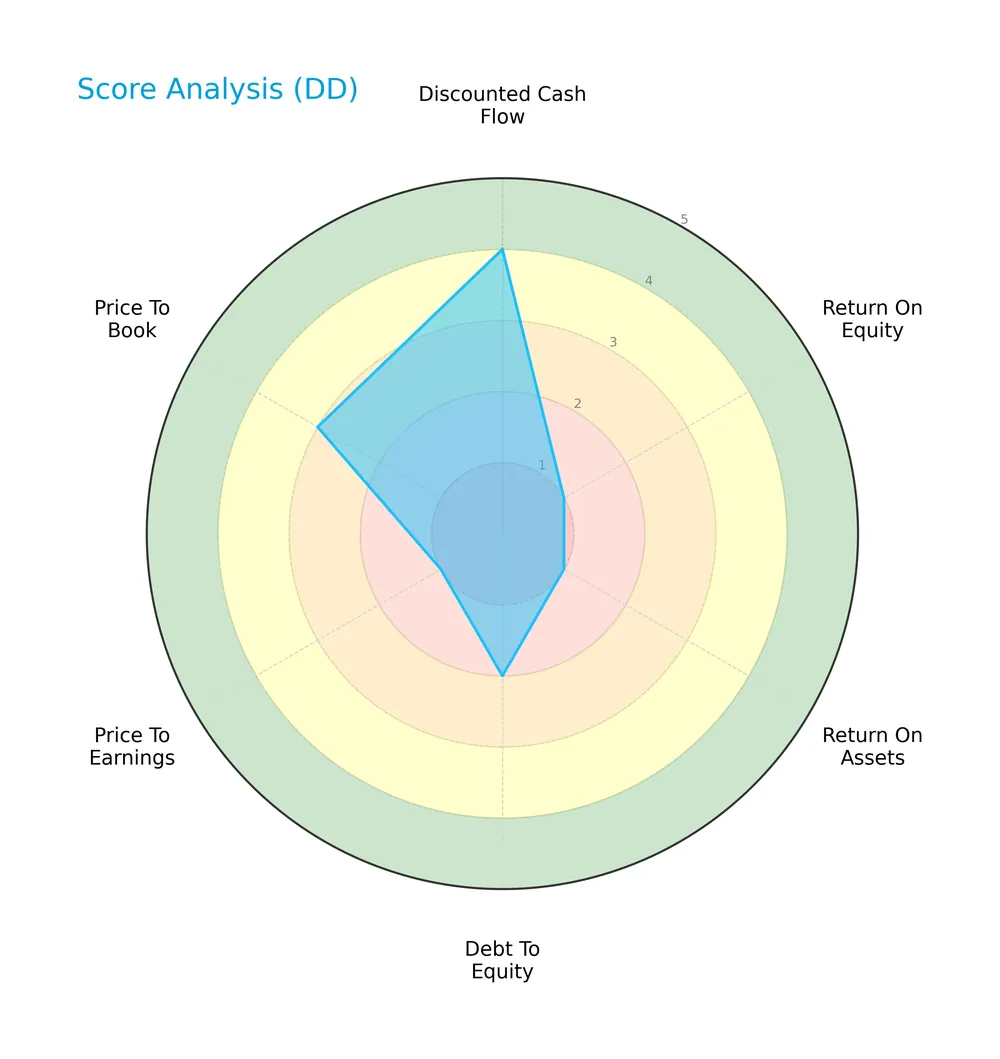
DuPont’s discounted cash flow score is favorable at 4, but profitability scores lag significantly with ROE and ROA both very unfavorable at 1. Its debt-to-equity and price-to-earnings ratios also score poorly, signaling financial stress. The price-to-book ratio shows moderate valuation strength.
Analysis of the company’s bankruptcy risk
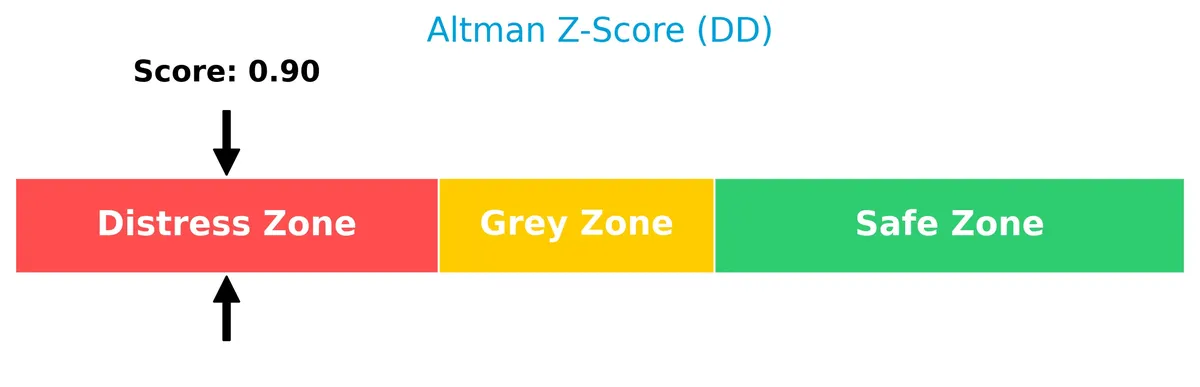
The Altman Z-Score places DuPont firmly in the distress zone, indicating a high risk of bankruptcy:
Is the company in good financial health?
The Piotroski Score diagram below illustrates DuPont’s moderate financial strength:
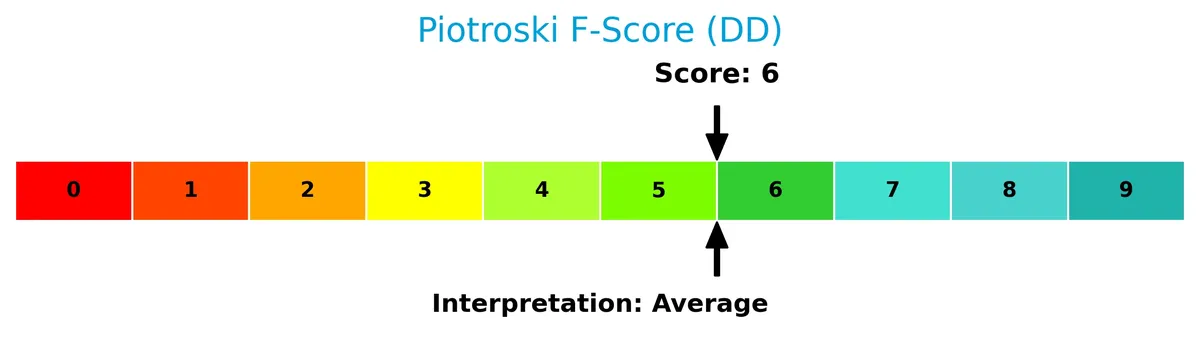
DuPont’s Piotroski score of 6 suggests average financial health. This score reflects some strengths but also underlying weaknesses, pointing to cautious optimism about its operational and financial stability.
Competitive Landscape & Sector Positioning
This analysis examines DuPont de Nemours, Inc.’s position within the specialty chemicals sector, focusing on strategic and operational factors. I will assess whether DuPont maintains a competitive advantage over its main industry peers.
Strategic Positioning
DuPont de Nemours, Inc. maintains a diversified product portfolio across three segments: Electronics & Industrial, Mobility & Materials, and Water & Protection. Its geographic exposure spans major regions including the U.S. & Canada, Asia Pacific, EMEA, and Latin America, reflecting a balanced global footprint.
Revenue by Segment
This pie chart displays DuPont de Nemours, Inc.’s revenue distribution by segment for the fiscal year 2024. It highlights the relative contributions of each business unit to total sales.
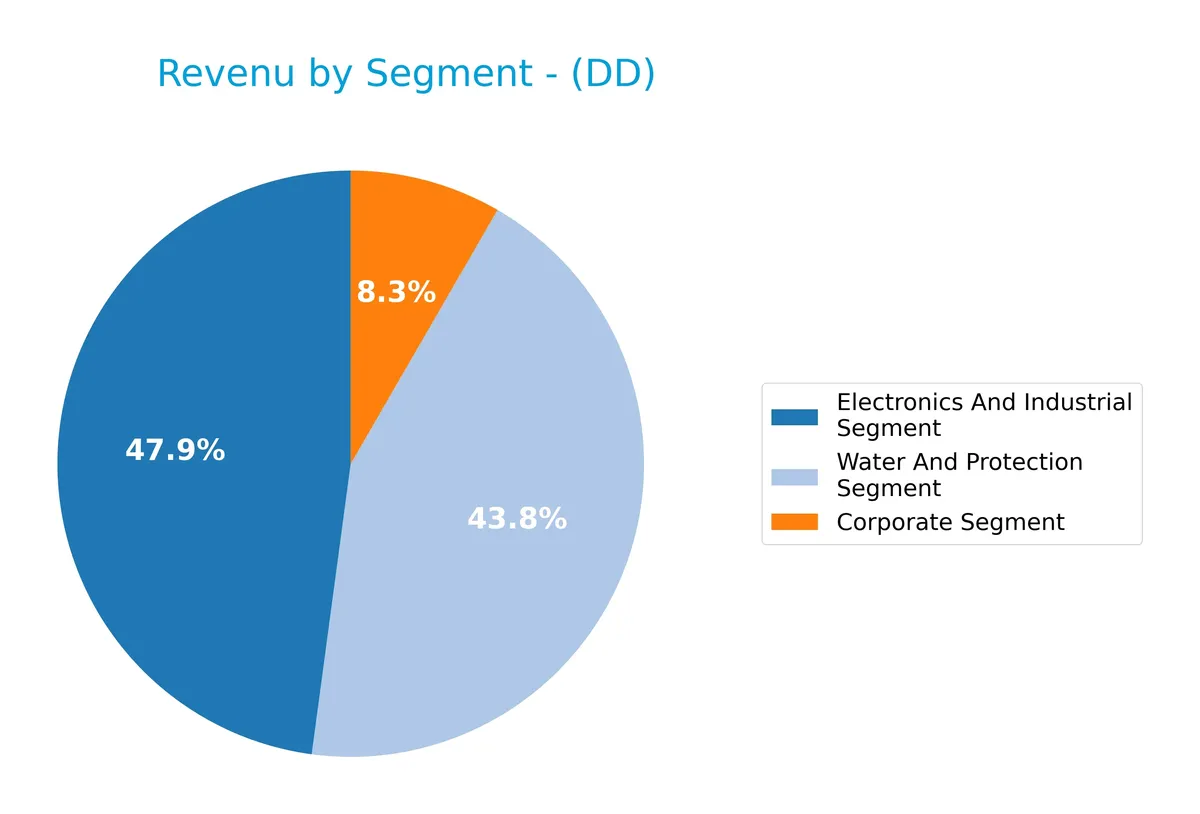
In 2024, Electronics And Industrial leads with $5.93B, followed closely by Water And Protection at $5.42B. The Corporate Segment remains minor at $1.03B. Notably, Electronics And Industrial accelerated its revenue from $5.52B in 2023, signaling strong operational momentum. Water And Protection shows slight deceleration, suggesting shifting market dynamics or competitive pressures. The concentration between these two segments underscores a reliance that investors should monitor closely.
Key Products & Brands
The table below summarizes DuPont de Nemours, Inc.’s key products and brands by segment and their primary offerings:
| Product | Description |
|---|---|
| Electronics & Industrial | Supplies materials and printing systems for semiconductors, integrated circuits, and displays. |
| Mobility & Materials | Provides engineering resins, silicone encapsulants, pastes, filaments, and advanced films. |
| Water & Protection | Offers engineered products and systems for worker safety, water purification, and packaging. |
DuPont’s portfolio reflects a focus on specialty chemicals serving advanced manufacturing, transportation, and water safety markets. Each segment targets high-value industrial applications with technology-driven materials.
Main Competitors
In the Basic Materials sector, there are 9 main competitors; below is a table of the top 9 leaders by market capitalization:
| Competitor | Market Cap. |
|---|---|
| Linde plc | 200B |
| The Sherwin-Williams Company | 81.5B |
| Ecolab Inc. | 74.5B |
| Air Products and Chemicals, Inc. | 56B |
| PPG Industries, Inc. | 23.4B |
| International Flavors & Fragrances Inc. | 17.4B |
| DuPont de Nemours, Inc. | 17.1B |
| Albemarle Corporation | 16.9B |
| LyondellBasell Industries N.V. | 14.3B |
DuPont de Nemours ranks 7th among its 9 competitors and holds just over 10% of the market cap of the sector leader, Linde plc. The company’s market cap lies below both the average top 10 value of 55.7B and the sector median of 23.4B. It trails its closest competitor above by approximately 18.3%, indicating a moderate gap in scale within the specialty chemicals industry.
Comparisons with competitors
Check out how we compare the company to its competitors:
Does DuPont de Nemours have a competitive advantage?
DuPont de Nemours currently lacks a competitive advantage, as its ROIC falls significantly below its WACC, indicating value destruction and declining profitability over recent years. The company’s shrinking margins and persistent losses further weaken its position relative to industry standards.
Looking ahead, DuPont operates across diverse segments including Electronics & Industrial, Mobility & Materials, and Water & Protection, offering potential growth avenues. Expansion into advanced materials for semiconductors and water purification markets could provide future opportunities if operational performance improves.
SWOT Analysis
This analysis highlights DuPont de Nemours’ key strengths, weaknesses, opportunities, and threats to guide strategic decisions.
Strengths
- diversified global presence
- strong dividend yield (3.56%)
- solid liquidity ratios (current 2.42, quick 1.91)
Weaknesses
- declining revenue and net income growth
- negative net margin (-11.37%)
- ROIC below WACC, destroying value
Opportunities
- innovation in specialty chemicals
- growth potential in emerging markets
- expanding water and protection segments
Threats
- intense industry competition
- exposure to volatile raw material costs
- geopolitical risks impacting global supply chains
DuPont faces significant profitability and growth challenges but retains robust liquidity and dividend appeal. Strategic focus must balance innovation with cost control to reverse value destruction.
Stock Price Action Analysis
The weekly stock chart for DuPont de Nemours, Inc. illustrates price dynamics and trend shifts over the past 12 months:
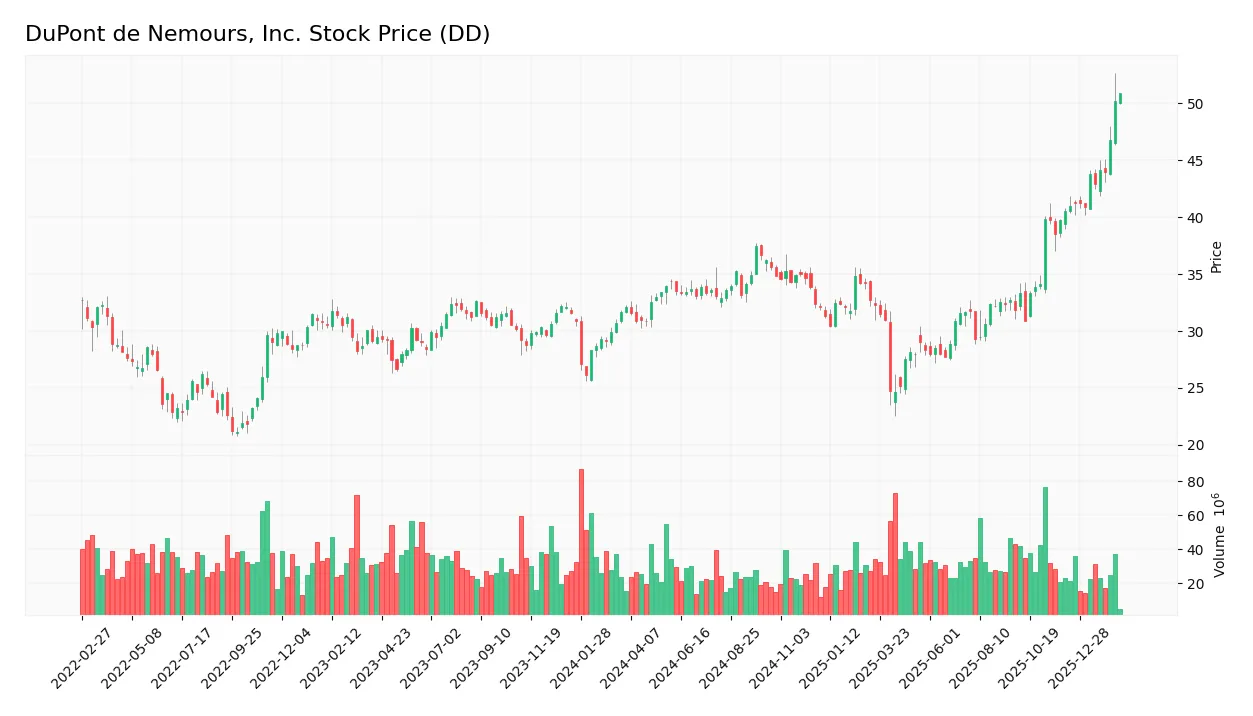
Trend Analysis
Over the past 12 months, DuPont de Nemours, Inc. stock rose by 58.57%, confirming a bullish trend with accelerating momentum. The price ranged from a low of 24.64 to a high of 50.87. Volatility measured by a 4.79 standard deviation reflects moderate price fluctuations.
Volume Analysis
Trading volume over the last three months shows a decreasing trend despite strong buyer dominance at 75.66%. Buyer volume outpaces sellers, indicating confident investor demand but reduced overall market participation.
Target Prices
Analysts present a wide range of target prices for DuPont de Nemours, Inc., reflecting mixed expectations.
| Target Low | Target High | Consensus |
|---|---|---|
| 46 | 161 | 73.88 |
The low target suggests cautious outlooks, while the high indicates confidence in growth potential. The consensus at 73.88 points to moderate optimism overall.

Don’t Let Luck Decide Your Entry Point
Optimize your entry points with our advanced ProRealTime indicators. You’ll get efficient buy signals with precise price targets for maximum performance. Start outperforming now!
Analyst & Consumer Opinions
This section reviews analyst ratings and consumer feedback to provide a comprehensive view of DuPont de Nemours, Inc.’s market perception.
Stock Grades
Here are the latest verified analyst grades for DuPont de Nemours, Inc. from recognized financial firms:
| Grading Company | Action | New Grade | Date |
|---|---|---|---|
| BMO Capital | Maintain | Outperform | 2026-02-12 |
| Keybanc | Maintain | Overweight | 2026-02-11 |
| Wells Fargo | Maintain | Overweight | 2026-02-11 |
| Jefferies | Maintain | Buy | 2026-02-11 |
| UBS | Maintain | Buy | 2026-02-11 |
| Citigroup | Maintain | Buy | 2026-02-11 |
| Citigroup | Maintain | Buy | 2026-01-21 |
| JP Morgan | Maintain | Overweight | 2026-01-16 |
| Keybanc | Maintain | Overweight | 2026-01-09 |
| UBS | Maintain | Buy | 2026-01-07 |
The consensus grades reflect a stable positive outlook, with most firms maintaining Buy or Overweight ratings. No downgrades occurred, signaling confidence in the stock’s prospects.
Consumer Opinions
Consumers express a mixed but generally favorable view of DuPont de Nemours, Inc., highlighting innovation and product quality while noting some service and pricing concerns.
| Positive Reviews | Negative Reviews |
|---|---|
| Innovative product lineup drives industry standards | Customer service response times can lag |
| High-quality materials improve project outcomes | Pricing sometimes exceeds competitor levels |
| Strong focus on sustainability resonates well | Occasional supply chain delays reported |
Overall, customers praise DuPont for its innovative, sustainable products and consistent quality. However, service speed and premium pricing occasionally dampen satisfaction.
Risk Analysis
Below is a summary table outlining key risks facing DuPont de Nemours, Inc. as of 2026:
| Category | Description | Probability | Impact |
|---|---|---|---|
| Financial Health | Altman Z-Score at 0.90 signals high bankruptcy risk, reflecting financial distress. | High | Severe |
| Profitability | Negative net margin (-11.37%) and low ROE (-5.6%) indicate ongoing profitability challenges. | High | High |
| Debt Servicing | Interest coverage at 1.64 suggests limited capacity to cover interest expenses if conditions worsen. | Medium | High |
| Operational Efficiency | Low asset turnover (0.32) points to inefficient use of assets, reducing returns. | Medium | Moderate |
| Market Volatility | Beta of 1.16 implies above-average sensitivity to market swings, increasing stock price volatility. | High | Moderate |
| Dividend Risk | Dividend yield at 3.56% is attractive but may be unsustainable given weak earnings and cash flow. | Medium | Moderate |
The most concerning risk is DuPont’s financial distress signaled by its Altman Z-Score well below 1.8. Coupled with negative profitability and weak interest coverage, this elevates bankruptcy risk substantially. Investors should weigh these red flags against the company’s stable balance sheet and favorable liquidity ratios. Market volatility remains a persistent risk given the company’s beta above 1. I advise cautious positioning until profitability and cash flow improve.
Should You Buy DuPont de Nemours, Inc.?
DuPont de Nemours, Inc. appears to be facing a challenging profile with declining profitability and a very unfavorable competitive moat, suggesting value erosion. Despite manageable leverage, its overall rating of C+ reflects significant operational and financial risks.
Strength & Efficiency Pillars
DuPont de Nemours, Inc. shows operational resilience with a solid gross margin of 30.25% and a favorable interest expense ratio of 4.57%. However, the company’s profitability metrics are weak, with a negative net margin of -11.37% and a return on equity of -5.6%. Its return on invested capital (ROIC) stands at a low 2.18%, below the weighted average cost of capital (WACC) at 8.79%, indicating that DuPont is currently destroying shareholder value rather than creating it.
Weaknesses and Drawbacks
The company is in financial distress, as reflected by its Altman Z-Score of 0.90, placing it firmly in the “Distress Zone” and signaling a high bankruptcy risk. This solvency threat overshadows other metrics. Despite a favorable price-to-book ratio of 1.21 and a strong current ratio of 2.42, the interest coverage ratio is weak at 1.64, suggesting limited buffer to meet interest obligations. The troubling trend in declining profitability and negative net margin growth compounds the risk profile.
Our Final Verdict about DuPont de Nemours, Inc.
Despite some operational strengths, DuPont’s solvency risk, highlighted by an Altman Z-Score well below 1.8, makes its investment profile highly speculative. The negative margins and insufficient returns relative to capital costs further caution against exposure. Investors seeking capital preservation may find the risk too elevated given the potential for financial distress.
Disclaimer: This content is for informational purposes only and does not constitute financial, investment, or other professional advice. Investing in financial markets involves a significant risk of loss, and past performance is not indicative of future results.
Additional Resources
- Decoding DuPont de Nemours Inc (DD): A Strategic SWOT Insight – GuruFocus (Feb 18, 2026)
- There May Be Reason For Hope In DuPont de Nemours’ (NYSE:DD) Disappointing Earnings – simplywall.st (Feb 17, 2026)
- DuPont Stock Fell 31% Over the Past Year. Do Analysts See a Recovery to $62 in 2026? – TIKR.com (Feb 12, 2026)
- RBC Capital Retains An Outperform Rating On DuPont de Nemours, Inc. (DD) – Yahoo Finance (Dec 12, 2025)
- DuPont De Nemours (DD) One Off US$577 Million Loss Tests Bullish Margin Narrative – Sahm (Feb 12, 2026)
For more information about DuPont de Nemours, Inc., please visit the official website: dupont.com