Home > Analyses > Utilities > Duke Energy Corporation
Duke Energy powers millions, shaping how communities light homes and fuel industries across the Southeast and Midwest. With a vast portfolio spanning coal, natural gas, nuclear, and renewables, it stands as a pillar in regulated electric utilities. The company’s ambitious push into renewables underscores its commitment to innovation and sustainability. As 2026 unfolds, I ask: does Duke Energy’s robust infrastructure and strategic transition still justify its premium valuation and growth outlook?

Table of contents
Business Model & Company Overview
Duke Energy Corporation, founded in 1904 and based in Charlotte, NC, stands as a dominant force in the regulated electric industry. It operates a cohesive energy ecosystem through three segments: Electric Utilities and Infrastructure, Gas Utilities and Infrastructure, and Commercial Renewables. Serving 8.2M electricity customers and 1.6M gas customers across six U.S. states, Duke balances traditional and renewable energy sources to power its extensive footprint.
The company’s revenue engine blends stable regulated electric and gas distribution with growing commercial renewables. Its 50,259 MW generation capacity combines coal, natural gas, nuclear, solar, wind, and battery storage assets, spanning the Southeast, Midwest, and beyond. This diversified portfolio creates a competitive advantage that fortifies Duke’s economic moat and positions it to shape America’s energy future.
Financial Performance & Fundamental Metrics
I analyze Duke Energy Corporation’s income statement, key financial ratios, and dividend payout policy to assess its operational efficiency and shareholder value creation.
Income Statement
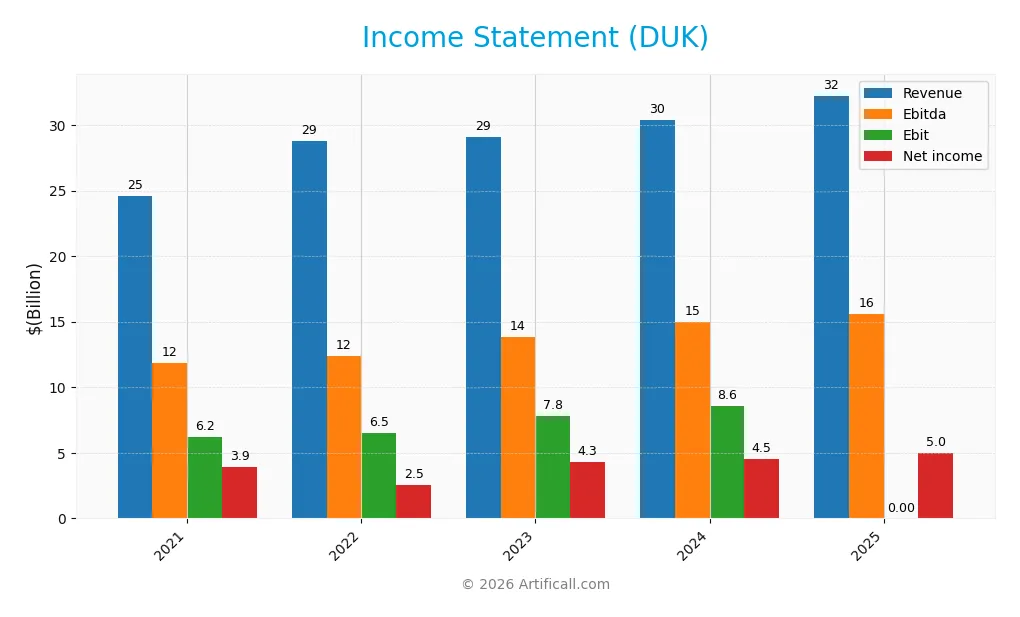
The table below summarizes Duke Energy Corporation’s key income statement figures for the fiscal years 2021 through 2025, expressed in USD.
| 2021 | 2022 | 2023 | 2024 | 2025 | |
|---|---|---|---|---|---|
| Revenue | 24.6B | 28.8B | 29.1B | 30.4B | 32.2B |
| Cost of Revenue | 12.7B | 15.8B | 15.3B | 15.2B | 0.98B |
| Operating Expenses | 6.5B | 7.0B | 6.7B | 7.3B | 23.7B |
| Gross Profit | 11.9B | 13.0B | 13.8B | 15.2B | 31.3B |
| EBITDA | 11.9B | 12.4B | 13.9B | 15.0B | 15.6B |
| EBIT | 6.2B | 6.5B | 7.8B | 8.6B | 0 |
| Interest Expense | 2.2B | 2.4B | 3.0B | 3.4B | 3.6B |
| Net Income | 3.9B | 2.6B | 4.3B | 4.5B | 5.0B |
| EPS | 4.94 | 3.17 | 5.43 | 5.71 | 6.31 |
| Filing Date | 2022-02-24 | 2023-02-27 | 2024-02-23 | 2025-02-27 | 2026-02-10 |
Income Statement Evolution
Duke Energy’s revenue grew steadily by 31% from 2021 to 2025, with a 6.2% increase in the last year. Net income rose 27% over the period, reflecting solid bottom-line expansion despite a slight 2.9% decline in net margin. Gross margin remained highly favorable near 97%, while EBIT margin dropped sharply to zero, signaling operational challenges.
Is the Income Statement Favorable?
In 2025, Duke posted $32.2B revenue and $5.0B net income, delivering a 15.4% net margin, deemed favorable. However, EBIT margin fell to zero, driven by high interest expense at 11.3% of revenue, an unfavorable element. EPS grew 10.5%, supporting earnings strength, but rising operating expenses matched revenue growth, posing cost pressure risks. Overall, fundamentals show a balanced mix of strengths and weaknesses.
Financial Ratios
The table below presents key financial ratios for Duke Energy Corporation from 2021 to 2025, illustrating profitability, liquidity, leverage, efficiency, and dividend metrics:
| Ratios | 2021 | 2022 | 2023 | 2024 | 2025 |
|---|---|---|---|---|---|
| Net Margin | 16% | 9% | 15% | 15% | 15% |
| ROE | 7.9% | 5.2% | 8.7% | 9.0% | 9.6% |
| ROIC | 3.2% | 3.3% | 3.9% | 4.0% | 4.2% |
| P/E | 20.6 | 31.1 | 17.4 | 18.4 | 18.3 |
| P/B | 1.64 | 1.61 | 1.52 | 1.66 | 1.76 |
| Current Ratio | 0.62 | 0.70 | 0.74 | 0.67 | 0.55 |
| Quick Ratio | 0.43 | 0.51 | 0.49 | 0.44 | 0.33 |
| D/E | 1.38 | 1.52 | 1.64 | 1.70 | 1.75 |
| Debt-to-Assets | 40% | 42% | 45% | 46% | 46% |
| Interest Coverage | 2.49 | 2.46 | 2.35 | 2.34 | 2.37 |
| Asset Turnover | 0.15 | 0.16 | 0.16 | 0.16 | 0.16 |
| Fixed Asset Turnover | 0.23 | 0.26 | 0.25 | 0.24 | 0.25 |
| Dividend Yield | 3.9% | 4.0% | 4.3% | 3.9% | 3.6% |
Evolution of Financial Ratios
Duke Energy’s Return on Equity (ROE) showed a modest upward trend, reaching 9.58% in 2025 but remains below ideal benchmarks. The Current Ratio declined steadily from 0.74 in 2023 to 0.55 in 2025, signaling worsening liquidity. Debt-to-Equity Ratio increased to 1.75 in 2025, indicating higher leverage and financial risk. Profitability margins remained relatively stable, with net margin slightly improving to 15.41%.
Are the Financial Ratios Favorable?
In 2025, Duke Energy’s profitability, measured by net margin and dividend yield (3.6%), is favorable. However, ROE and Return on Invested Capital (4.15%) fall short of covering the weighted average cost of capital (4.79%), implying weak capital efficiency. Liquidity ratios (current 0.55, quick 0.33) are unfavorable, raising short-term risk concerns. Leverage is high (debt-to-equity 1.75), and asset turnover is low (0.16), reflecting inefficiency. Overall, the financial ratios suggest an unfavorable position compared to industry norms.
Shareholder Return Policy
Duke Energy maintains a dividend payout ratio near 66%, with dividends per share rising modestly to $4.22 in 2025. The dividend yield stands at 3.6%, supported by free cash flow coverage and occasional share buybacks, reflecting steady income distribution.
The payout aligns with sustainable cash flow, balancing shareholder returns and capital needs. While leverage remains elevated, the policy appears consistent with long-term value creation, though high payout ratios warrant monitoring for financial flexibility risks.
Score analysis
The following radar chart summarizes Duke Energy Corporation’s key financial evaluation scores:
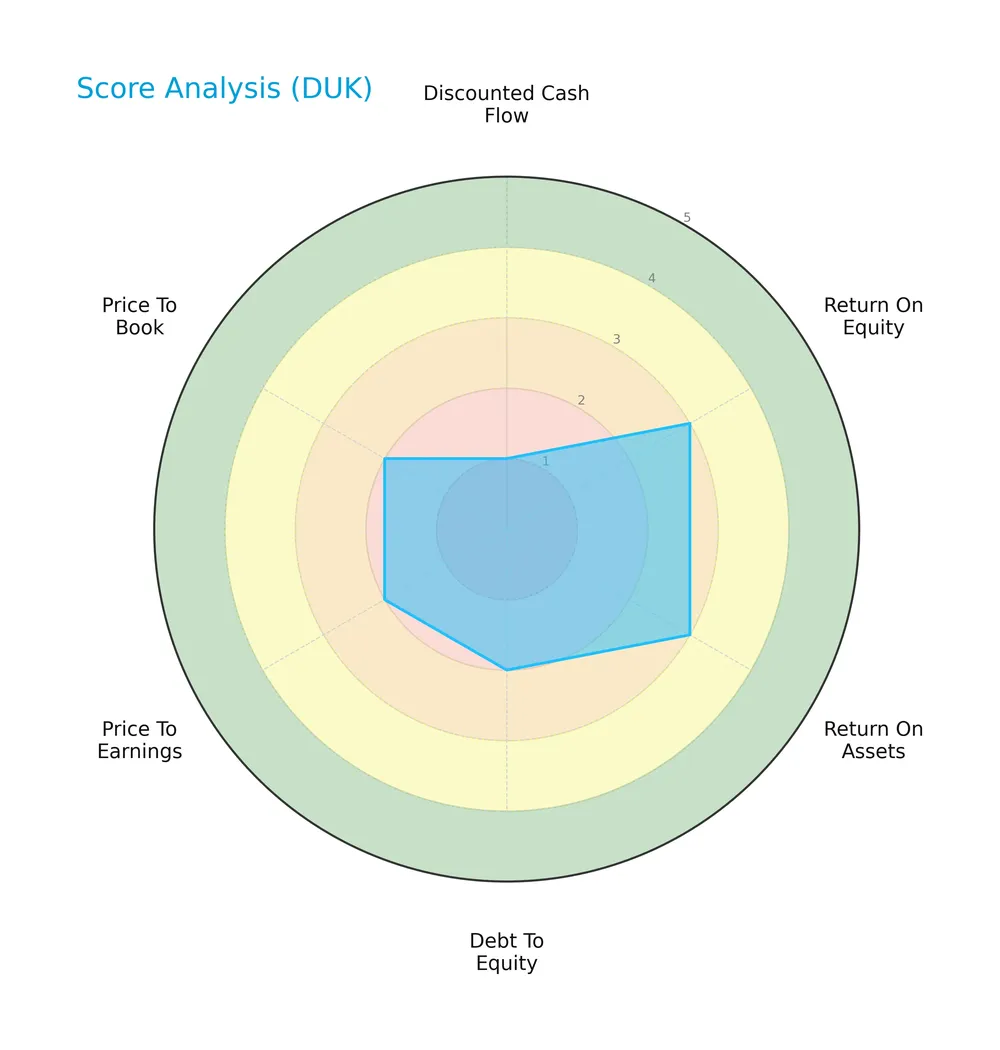
The scores reveal significant weaknesses in discounted cash flow (1) and debt-to-equity (2), indicating financial strain. Return on equity and assets both score moderately at 3, while valuation metrics—PE and PB—are unfavorable at 2, reflecting valuation challenges.
Analysis of the company’s bankruptcy risk
Duke Energy’s Altman Z-Score of 0.7 places it firmly in the distress zone, signaling a high risk of bankruptcy:

Is the company in good financial health?
The Piotroski Score chart provides insights into Duke Energy’s financial strength and health:

With a Piotroski Score of 8, Duke Energy demonstrates very strong financial health, indicating robust profitability, liquidity, and operational efficiency despite other financial challenges.
Competitive Landscape & Sector Positioning
This analysis explores Duke Energy Corporation’s strategic positioning, revenue segments, key products, and main competitors. I will assess whether Duke Energy holds a competitive advantage within the regulated electric utilities sector.
Strategic Positioning
Duke Energy concentrates its operations in the U.S., serving 8.2M electric and 1.6M gas customers across six states. Its portfolio focuses on regulated utilities with growing commercial renewables, balancing traditional energy sources and a 3,554 MW renewable capacity in 22 states.
Revenue by Segment
This pie chart breaks down Duke Energy Corporation’s revenue by segment, highlighting the fiscal year 2024 distribution of earnings across its core business units.
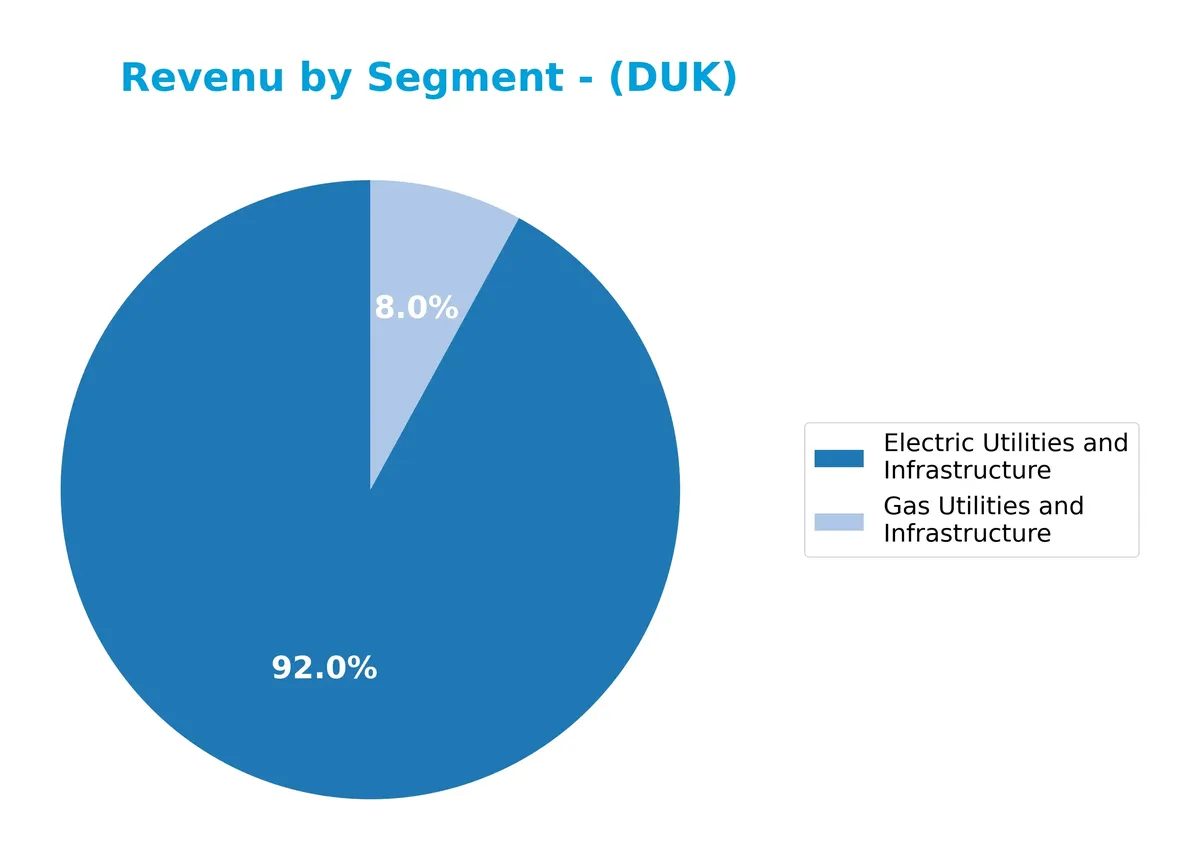
Electric Utilities and Infrastructure dominates Duke’s revenue, generating $26.8B in 2024, reflecting its critical role. Gas Utilities and Infrastructure contributed $2.3B, showing steady but smaller scale growth. Over recent years, electric utilities consistently drive the business with modest gains, while gas utilities reveal slower expansion. The concentration in electric utilities underscores Duke’s reliance on regulated infrastructure, which offers stability but suggests limited diversification in revenue streams.
Key Products & Brands
Duke Energy’s core offerings span regulated electric, gas utilities, and renewable energy segments:
| Product | Description |
|---|---|
| Electric Utilities and Infrastructure | Generates, transmits, distributes, and sells electricity using coal, natural gas, nuclear, hydro, and renewables across six states. Serves 8.2M customers with 50,259 MW capacity. |
| Gas Utilities and Infrastructure | Distributes natural gas to residential, commercial, industrial, and power generation customers. Operates pipelines and storage, serving 1.6M customers. |
| Commercial Renewables | Develops and operates wind, solar, battery storage, and fuel cell projects in 22 states, totaling 3,554 MW capacity. |
Duke Energy’s business model relies heavily on regulated electric utilities, supported by natural gas distribution and growing renewable assets. The scale and diversity of assets provide a broad footprint across key U.S. regions.
Main Competitors
Duke Energy Corporation competes with 23 companies in its sector, with the table below listing the top 10 leaders by market capitalization:
| Competitor | Market Cap. |
|---|---|
| NextEra Energy, Inc. | 169B |
| The Southern Company | 96B |
| Duke Energy Corporation | 91B |
| American Electric Power Company, Inc. | 62B |
| Dominion Energy, Inc. | 51B |
| Exelon Corporation | 44B |
| Xcel Energy Inc. | 44B |
| Entergy Corporation | 42B |
| Public Service Enterprise Group Incorporated | 40B |
| Consolidated Edison, Inc. | 36B |
Duke Energy ranks third among its 23 peers, holding about 57% of the market cap of the leader, NextEra Energy. It sits comfortably above both the average market cap of the top 10 (67.5B) and the sector median (34B). The narrow 0.25% gap to the next competitor above, The Southern Company, highlights Duke’s strong positioning near the top of the utilities sector.
Comparisons with competitors
Check out how we compare the company to its competitors:
Does DUK have a competitive advantage?
Duke Energy Corporation currently does not present a strong competitive advantage as it is shedding value with ROIC below WACC. Despite this, its profitability shows an improving trend, indicating growing operational efficiency.
Looking ahead, Duke Energy’s diverse energy portfolio—including electric utilities, gas infrastructure, and commercial renewables—positions it to capture opportunities in expanding renewable projects and energy storage across multiple U.S. states.
SWOT Analysis
This analysis highlights Duke Energy’s core competitive factors and risks shaping its strategic outlook.
Strengths
- diversified energy mix
- strong customer base of 9.8M
- solid dividend yield of 3.6%
Weaknesses
- low current and quick ratios (0.55, 0.33)
- unfavorable ROIC vs WACC (value destruction)
- high debt leverage (D/E 1.75)
Opportunities
- growth in renewable energy projects
- expanding infrastructure in Southeast and Midwest
- rising EPS trend (+27.7% over period)
Threats
- regulatory risks in utility sector
- rising interest expenses (11.3%)
- competitive pressure from alternative energy providers
Duke Energy maintains stable cash flows and market presence but faces financial strain from leverage and value erosion. Strategic focus should intensify on improving capital efficiency and accelerating renewable investments to mitigate regulatory and market threats.
Stock Price Action Analysis
The upcoming weekly chart highlights Duke Energy Corporation’s stock price fluctuations and key turning points over the past 12 months:
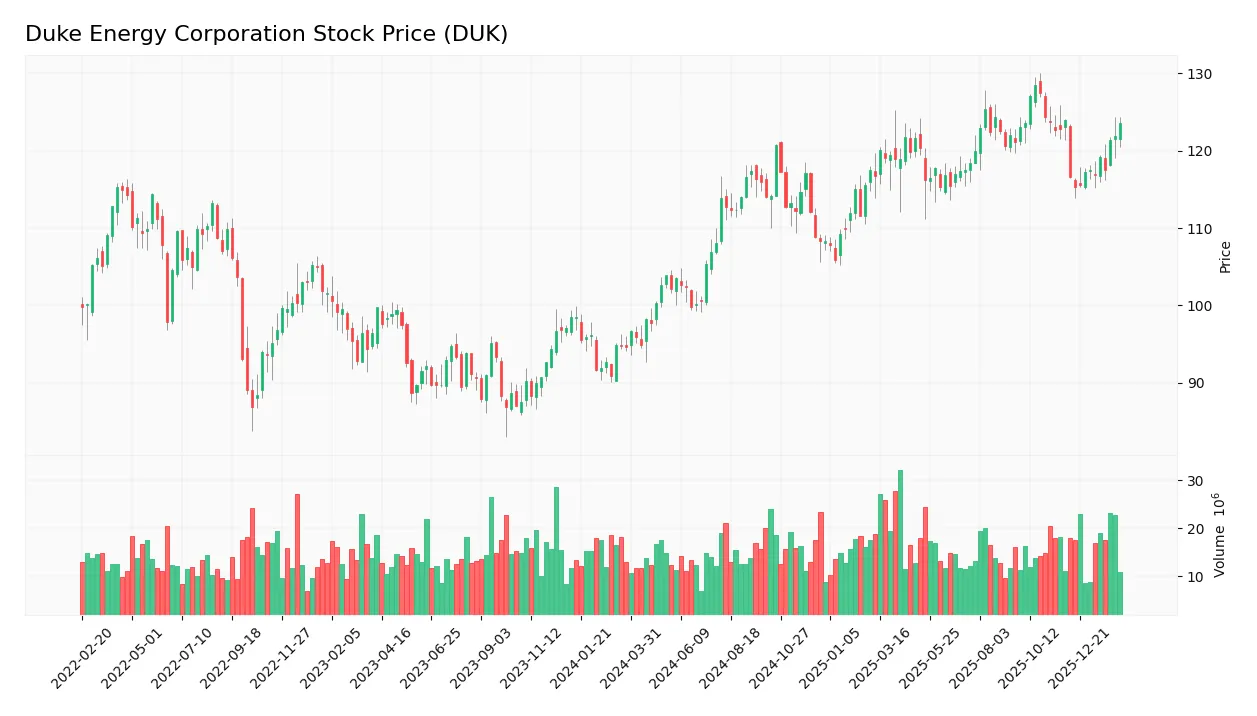
Trend Analysis
Over the past year, Duke Energy’s stock gained 30.63%, indicating a strong bullish trend with acceleration. The price ranged from a low of 94.61 to a high of 128.53, reflecting notable upward momentum. Volatility is significant, with an 8.03 standard deviation supporting active price swings.
Volume Analysis
In the last three months, trading volume increased, driven predominantly by buyers who accounted for 64.5% of activity. This buyer dominance suggests heightened investor confidence and stronger market participation in Duke Energy shares during this period.
Target Prices
Analysts set a clear target consensus for Duke Energy Corporation.
| Target Low | Target High | Consensus |
|---|---|---|
| 115 | 143 | 133.45 |
The target prices reflect moderate upside potential, indicating analyst confidence in Duke’s stable cash flows and steady growth prospects.

Don’t Let Luck Decide Your Entry Point
Optimize your entry points with our advanced ProRealTime indicators. You’ll get efficient buy signals with precise price targets for maximum performance. Start outperforming now!
Analyst & Consumer Opinions
This section examines Duke Energy Corporation’s recent analyst grades alongside consumer feedback to gauge market and public sentiment.
Stock Grades
Here is the latest verified grading summary for Duke Energy Corporation from leading financial institutions:
| Grading Company | Action | New Grade | Date |
|---|---|---|---|
| Wells Fargo | Maintain | Equal Weight | 2026-01-20 |
| Barclays | Maintain | Overweight | 2026-01-15 |
| UBS | Maintain | Neutral | 2025-12-17 |
| JP Morgan | Maintain | Neutral | 2025-12-11 |
| Mizuho | Maintain | Outperform | 2025-10-27 |
| Morgan Stanley | Maintain | Equal Weight | 2025-10-22 |
| Barclays | Maintain | Overweight | 2025-10-14 |
| BMO Capital | Maintain | Outperform | 2025-10-10 |
| UBS | Maintain | Neutral | 2025-10-10 |
| Scotiabank | Upgrade | Sector Outperform | 2025-10-03 |
The grades show a consistent pattern of holding or upgrading Duke Energy’s outlook, with no downgrades reported. Most firms rate the stock as neutral to moderately positive, reflecting steady confidence without strong bullish consensus.
Consumer Opinions
Consumers express a mix of appreciation for Duke Energy’s reliability and frustration over customer service issues.
| Positive Reviews | Negative Reviews |
|---|---|
| Reliable power supply even during storms | Customer service response times are slow |
| Competitive pricing compared to regional peers | Occasional billing errors cause confusion |
| Transparent communication about outages | Limited renewable energy options frustrate some |
Overall, customers commend Duke Energy’s consistent service and fair pricing. However, recurring complaints focus on customer support delays and a perceived lack of green energy initiatives.
Risk Analysis
Below is a summary of key risks facing Duke Energy Corporation, categorized by likelihood and potential impact:
| Category | Description | Probability | Impact |
|---|---|---|---|
| Financial Health | Altman Z-Score in distress zone (0.7) signals bankruptcy risk. | High | High |
| Liquidity | Low current ratio (0.55) and quick ratio (0.33) indicate tight liquidity. | High | Medium |
| Leverage | High debt-to-equity ratio (1.75) and zero interest coverage raise solvency concerns. | Medium | High |
| Operational Efficiency | Low asset turnover (0.16) and fixed asset turnover (0.25) suggest inefficient capital use. | Medium | Medium |
| Market Valuation | Neutral P/E (18.33) and P/B (1.76) ratios imply fair valuation but limited upside. | Medium | Low |
| Regulatory & Sector | Exposure to energy regulations and transition risks in utilities sector. | Medium | High |
The most pressing risks are Duke’s financial distress signals and weak liquidity. The Altman Z-Score below 1.8 historically predicts high bankruptcy probability; this is alarming for a utility. Additionally, weak interest coverage and elevated leverage exacerbate financial vulnerability. Investors must weigh these risks against Duke’s stable dividend yield (3.6%) and strong Piotroski score (8), which reflect operational resilience despite financial strain.
Should You Buy Duke Energy Corporation?
Duke Energy appears to be improving profitability with growing ROIC, yet it is shedding value overall. Despite a substantial leverage profile and low liquidity, the company suggests a profile of cautious operational efficiency. Its rating stands at a cautious C+.
Strength & Efficiency Pillars
Duke Energy Corporation shows operational resilience with a strong gross margin of 96.95% and a solid net margin of 15.41%. While its return on equity is moderate at 9.58%, the company’s return on invested capital (ROIC) at 4.15% falls below its weighted average cost of capital (WACC) of 4.79%, indicating value erosion rather than creation. Despite shedding value, Duke’s improving ROIC trend suggests gradual operational efficiency gains over time.
Weaknesses and Drawbacks
The company is in financial distress, with an Altman Z-Score of 0.70, signaling a high bankruptcy risk. This red flag outweighs its profitability metrics. Additional concerns include unfavorable leverage ratios: debt-to-equity stands at 1.75, and the current ratio is a weak 0.55, indicating liquidity strains. Interest coverage is at zero, raising alarms over debt servicing capacity. Valuation metrics such as P/E at 18.33 and P/B at 1.76 are neutral but do not offset solvency risks.
Our Final Verdict about Duke Energy Corporation
Despite Duke’s operational strengths and improving profitability trends, its placement in the financial distress zone with a dangerously low Altman Z-Score makes its profile highly speculative. The solvency risk overshadows positive cash flow and margin metrics, suggesting that the company may be too risky for conservative capital at this stage. Investors should approach with caution until financial health visibly improves.
Disclaimer: This content is for informational purposes only and does not constitute financial, investment, or other professional advice. Investing in financial markets involves a significant risk of loss, and past performance is not indicative of future results.
Additional Resources
- Duke Energy reports fourth-quarter and full-year 2025 financial results – Duke Energy | News Center (Feb 10, 2026)
- Duke Energy signed 1.5 GW of new data center deals in Q4, lifting total pipeline to 4.5 GW – Seeking Alpha (Feb 10, 2026)
- Duke Energy (DUK) Q4 Earnings Miss Estimates – Yahoo Finance (Feb 10, 2026)
- Duke Energy Corporation $DUK Shares Purchased by Wesbanco Bank Inc. – MarketBeat (Feb 10, 2026)
- Duke Energy Corp (DUK) Q4 2025 Earnings Call Highlights: Robust – GuruFocus (Feb 10, 2026)
For more information about Duke Energy Corporation, please visit the official website: duke-energy.com