Home > Analyses > Utilities > DTE Energy Company
DTE Energy powers daily life for millions across Michigan, blending traditional and renewable energy sources to fuel homes and industries. This utility giant commands a diverse portfolio, from nuclear and fossil fuels to wind and hydroelectric power, serving 3.6 million customers with reliable electricity and natural gas. Renowned for innovation and operational scale, DTE shapes the energy transition with disciplined capital allocation. The question remains: does DTE’s strong foundation still justify its current valuation and growth outlook?

Table of contents
Business Model & Company Overview
DTE Energy Company, founded in 1903 and headquartered in Detroit, Michigan, dominates the regulated electric utility sector. It operates a cohesive energy ecosystem serving 2.3M electricity customers and 1.3M natural gas users across southeastern Michigan. The company integrates fossil-fuel, nuclear, hydroelectric, wind, and renewable assets, alongside extensive infrastructure comprising over 698 substations and 1.3M active gas meters, reflecting its core business in reliable utility delivery.
The company’s revenue engine balances electricity generation, natural gas distribution, and industrial services with energy trading. Its strategic presence in Michigan’s diverse markets leverages 20,000 miles of gas mains and power plants to drive consistent cash flows. DTE’s competitive advantage lies in this multi-asset integration and regulated pricing, creating a durable economic moat that shapes the future of regional energy infrastructure.
Financial Performance & Fundamental Metrics
I analyze DTE Energy Company’s income statement, key financial ratios, and dividend payout policy to uncover its core financial health and shareholder value approach.
Income Statement
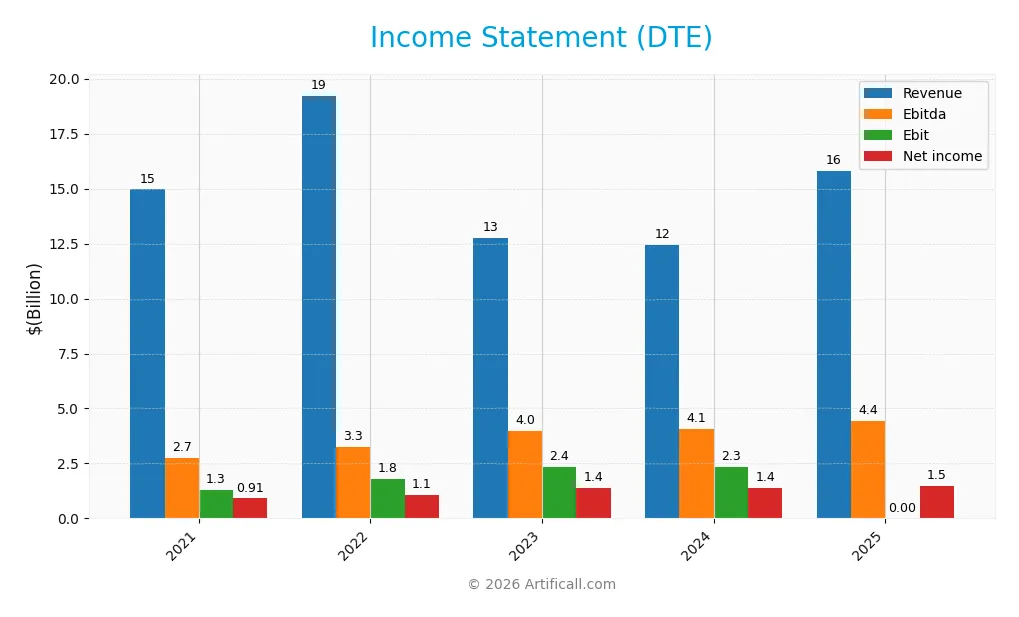
The following table summarizes DTE Energy Company’s key income statement items for fiscal years 2021 through 2025, reported in USD.
| 2021 | 2022 | 2023 | 2024 | 2025 | |
|---|---|---|---|---|---|
| Revenue | 14.96B | 19.23B | 12.75B | 12.46B | 15.81B |
| Cost of Revenue | 11.63B | 15.56B | 8.42B | 8.12B | 2.38B |
| Operating Expenses | 1.84B | 1.92B | 2.08B | 2.25B | 11.06B |
| Gross Profit | 3.34B | 3.67B | 4.33B | 4.34B | 13.43B |
| EBITDA | 2.75B | 3.26B | 3.96B | 4.05B | 4.45B |
| EBIT | 1.29B | 1.79B | 2.36B | 2.32B | 0 |
| Interest Expense | 630M | 675M | 791M | 951M | 1.06B |
| Net Income | 907M | 1.08B | 1.40B | 1.40B | 1.46B |
| EPS | 4.68 | 5.53 | 6.77 | 6.78 | 7.06 |
| Filing Date | 2022-02-10 | 2023-02-23 | 2024-02-08 | 2025-02-13 | 2026-02-17 |
Income Statement Evolution
DTE Energy’s revenue rose 5.7% overall from 2021 to 2025, with a notable 27% surge in 2025 alone. Net income grew 61% over the period, driven by improved net margins rising 52.5%. However, EBIT turned unfavorable in 2025, dropping to zero, despite gross margins strengthening to nearly 85%. Operating expenses grew in line with revenue, limiting margin expansion.
Is the Income Statement Favorable?
In 2025, DTE delivered $15.8B revenue and $1.46B net income, yielding a 9.24% net margin rated favorable. The 84.9% gross margin signals strong cost control at the production level. Yet, EBIT was zero, a red flag contrasting with prior years’ positive earnings before interest and taxes. Interest expense remained neutral at 6.7% of revenue, while EPS increased 4.3% year-over-year, reflecting solid bottom-line growth amidst mixed operational results.
Financial Ratios
The table below summarizes key financial ratios for DTE Energy Company over recent fiscal years, providing insight into profitability, valuation, liquidity, leverage, and efficiency:
| Ratios | 2021 | 2022 | 2023 | 2024 | 2025 |
|---|---|---|---|---|---|
| Net Margin | 6.1% | 5.6% | 11.0% | 11.2% | 9.2% |
| ROE | 10.4% | 10.4% | 12.6% | 12.0% | 11.9% |
| ROIC | 4.0% | 4.3% | 4.7% | 4.5% | -127.7% |
| P/E | 25.4 | 21.2 | 16.3 | 17.8 | 18.3 |
| P/B | 2.65 | 2.20 | 2.06 | 2.14 | 2.17 |
| Current Ratio | 0.52 | 0.81 | 0.60 | 0.71 | N/A |
| Quick Ratio | 0.39 | 0.63 | 0.42 | 0.46 | N/A |
| D/E | 2.10 | 1.85 | 1.90 | 1.99 | 0.20 |
| Debt-to-Assets | 46.0% | 45.1% | 46.9% | 47.6% | 0.0% |
| Interest Coverage | 2.37 | 2.59 | 2.84 | 2.20 | 2.25 |
| Asset Turnover | 0.38 | 0.45 | 0.28 | 0.26 | 0.00 |
| Fixed Asset Turnover | 0.55 | 0.67 | 0.45 | 0.40 | 0.00 |
| Dividend Yield | 3.43% | 2.99% | 3.31% | 3.24% | 3.17% |
N/A indicates data not reported or zero for 2025 current and quick ratios. The negative ROIC in 2025 signals unusual capital allocation or accounting effects.
Evolution of Financial Ratios
From 2021 to 2025, DTE Energy’s Return on Equity (ROE) showed moderate improvement, stabilizing around 11.9% by 2025. The Current Ratio fluctuated but remained below 1, indicating ongoing liquidity constraints. The Debt-to-Equity Ratio declined sharply from over 2 in 2021 to 0.2 in 2025, reflecting significant deleveraging. Profitability margins showed mixed trends, with net margins stabilizing near 9%.
Are the Financial Ratios Fovorable?
In 2025, DTE’s profitability and market valuation ratios, including ROE (11.9%) and P/E (18.3), are neutral. Liquidity ratios are unfavorable due to a zero current and quick ratio, signaling potential short-term risks. Leverage metrics, notably a low debt-to-equity ratio (0.2), are favorable. However, efficiency ratios are weak or unavailable, and ROIC is highly negative, marking an overall slightly unfavorable financial profile.
Shareholder Return Policy
DTE Energy Company maintains a dividend payout ratio near 58%, with a stable dividend per share around 4.09 USD and an annual yield close to 3.2%. Share buybacks complement dividends, supported by free cash flow coverage exceeding dividend and capex payments by over 3x.
This distribution policy appears sustainable given the company’s positive net margins and cash flow strength. However, the payout ratio near 60% warrants monitoring to avoid pressure on capital allocation during market downturns or unexpected operational challenges.
Score analysis
The following radar chart illustrates DTE Energy Company’s key financial scores for investor insight:
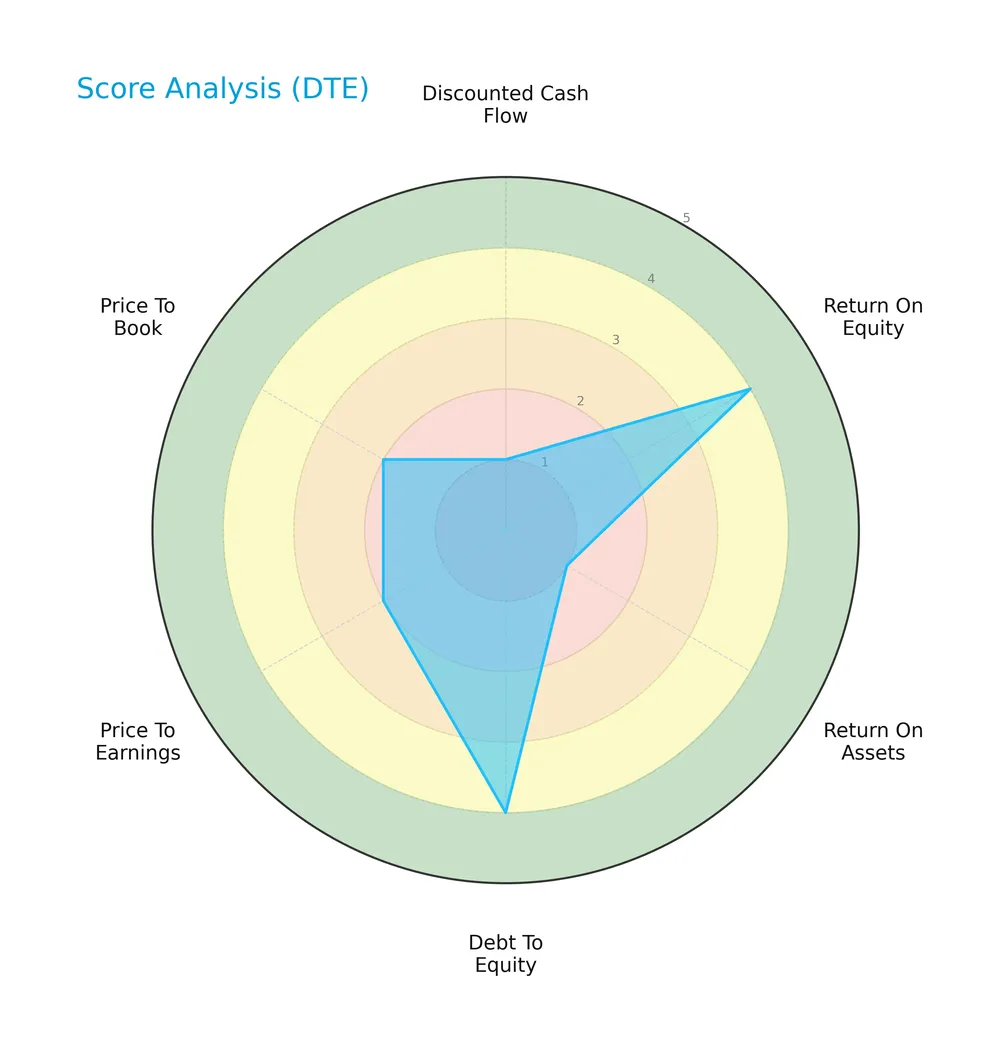
DTE shows strong returns on equity and a favorable debt-to-equity ratio. However, discounted cash flow and return on assets scores remain very unfavorable. Price multiples also indicate some valuation concerns.
Is the company in good financial health?
The Piotroski diagram below presents a detailed view of DTE Energy Company’s financial strength:

With a Piotroski Score of 7, DTE demonstrates strong financial health. This score suggests solid profitability, efficient operations, and sound balance sheet management, positioning the company favorably among peers.
Competitive Landscape & Sector Positioning
This section analyzes DTE Energy Company’s strategic positioning, revenue streams, and key products within the regulated electric utility sector. I will assess the company’s competitive advantages relative to its main industry peers.
Strategic Positioning
DTE Energy maintains a diversified product portfolio across Electric, Gas, Energy Trading, and DTE Vantage segments. Its geographic exposure centers on southeastern Michigan, serving 3.6M customers with regulated utility operations and industrial energy services.
Revenue by Segment
This pie chart displays DTE Energy Company’s revenue distribution by business segment for the fiscal year 2023, highlighting the contribution of each segment to total sales.
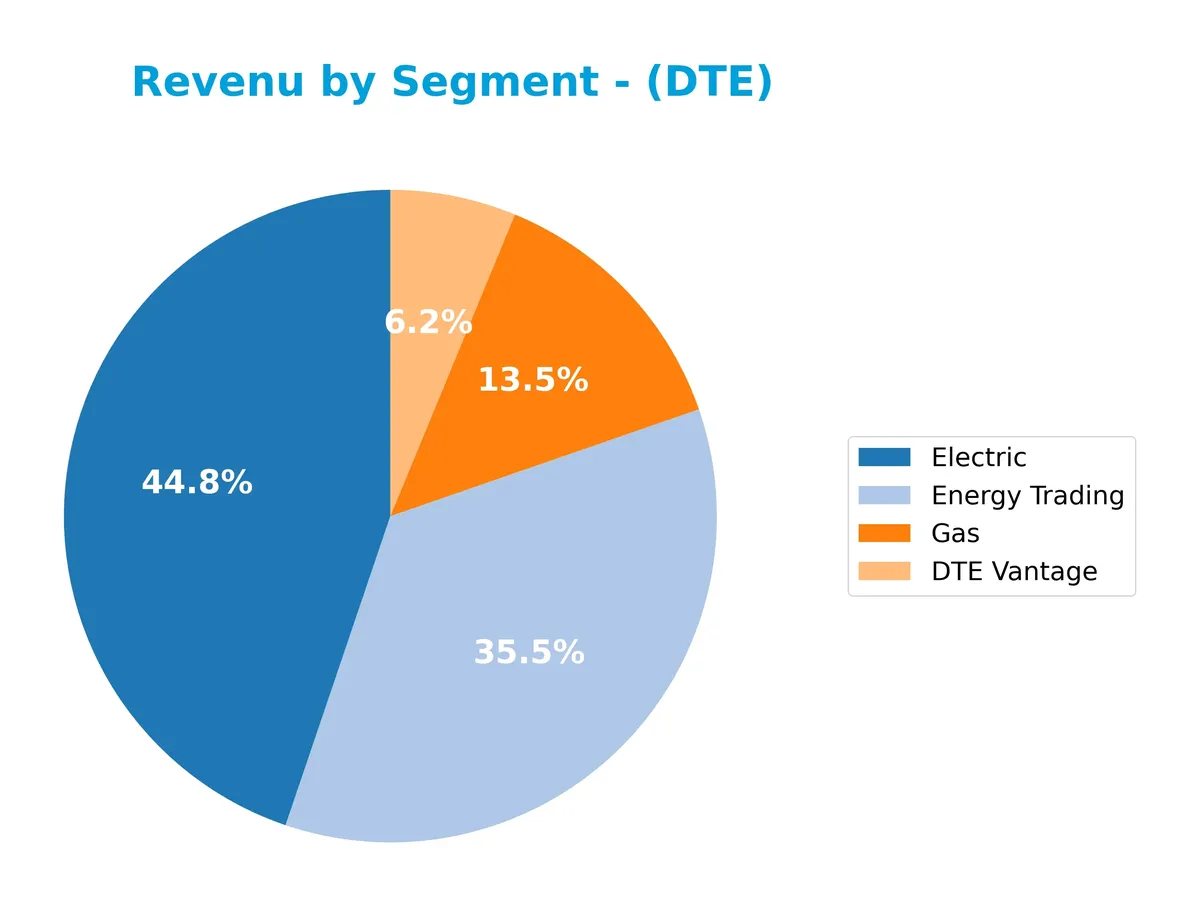
In 2023, Electric remains the dominant segment with $5.8B revenue, showing steady strength. Energy Trading, at $4.6B, has pulled back significantly from 2022’s peak, signaling volatility. Gas contributes $1.7B, maintaining a solid base, while DTE Vantage at $809M reflects a smaller but stable niche. The recent year shows a shift from Energy Trading concentration toward a more balanced revenue mix, reducing segment risk.
Key Products & Brands
The following table lists DTE Energy Company’s main products and brands with descriptions:
| Product | Description |
|---|---|
| Electric | Generates, purchases, distributes, and sells electricity to 2.3M customers in southeastern Michigan via diverse plants. |
| Gas | Purchases, stores, transports, distributes, and sells natural gas to 1.3M customers across Michigan. |
| DTE Vantage | Offers advanced energy solutions, including renewable energy projects and innovative technologies. |
| Energy Trading | Engages in power, natural gas, and environmental marketing and trading; optimizes pipeline transportation and storage. |
| Power and Industrial Projects | Provides metallurgical coke, pulverized coal, petroleum coke, power, steam, chilled water, wastewater treatment, and compressed air to industries. |
DTE Energy’s portfolio spans regulated electric and gas utilities alongside specialized industrial and trading services. This diversification supports stable revenue streams across energy generation, distribution, and commodity trading.
Main Competitors
DTE Energy Company faces competition from 23 companies, with the table below showing the top 10 leaders by market capitalization:
| Competitor | Market Cap. |
|---|---|
| NextEra Energy, Inc. | 169B |
| The Southern Company | 96B |
| Duke Energy Corporation | 91B |
| American Electric Power Company, Inc. | 62B |
| Dominion Energy, Inc. | 51B |
| Exelon Corporation | 44B |
| Xcel Energy Inc. | 44B |
| Entergy Corporation | 42B |
| Public Service Enterprise Group Incorporated | 40B |
| Consolidated Edison, Inc. | 36B |
DTE Energy ranks 14th among its 23 competitors by market cap. Its scale is about 17.8% of the leader, NextEra Energy. DTE is positioned below both the average market cap of the top 10 competitors (68B) and the sector median (34B). The company trails its next competitor above by approximately 9.2%, indicating a moderate gap to close to improve its standing.
Comparisons with competitors
Check out how we compare the company to its competitors:
Does DTE have a competitive advantage?
DTE Energy Company does not currently present a competitive advantage. Its return on invested capital (ROIC) significantly trails its weighted average cost of capital (WACC), indicating value destruction and declining profitability.
Looking ahead, the company operates across diverse energy segments with opportunities in renewables and energy trading. Expansion in these areas could influence future competitive positioning amid evolving market dynamics.
SWOT Analysis
This SWOT analysis highlights DTE Energy Company’s competitive position and strategic challenges.
Strengths
- Strong net margin of 9.24%
- Low debt-to-equity ratio of 0.2
- Consistent dividend yield of 3.17%
Weaknesses
- Negative ROIC at -127.74% indicates value destruction
- Unfavorable liquidity ratios (current and quick ratio at 0)
- Declining EBIT and net margin growth in the last year
Opportunities
- Expansion in renewable energy assets
- Growing customer base in Michigan
- Potential operational efficiencies in power and gas segments
Threats
- Regulatory risks in the utilities sector
- Rising operational expenses affecting margins
- Market volatility impacting energy trading segment
DTE’s strengths in profitability and capital structure contrast sharply with value destruction and liquidity concerns. The company must leverage renewable opportunities while managing rising costs and regulatory risks to sustain long-term growth.
Stock Price Action Analysis
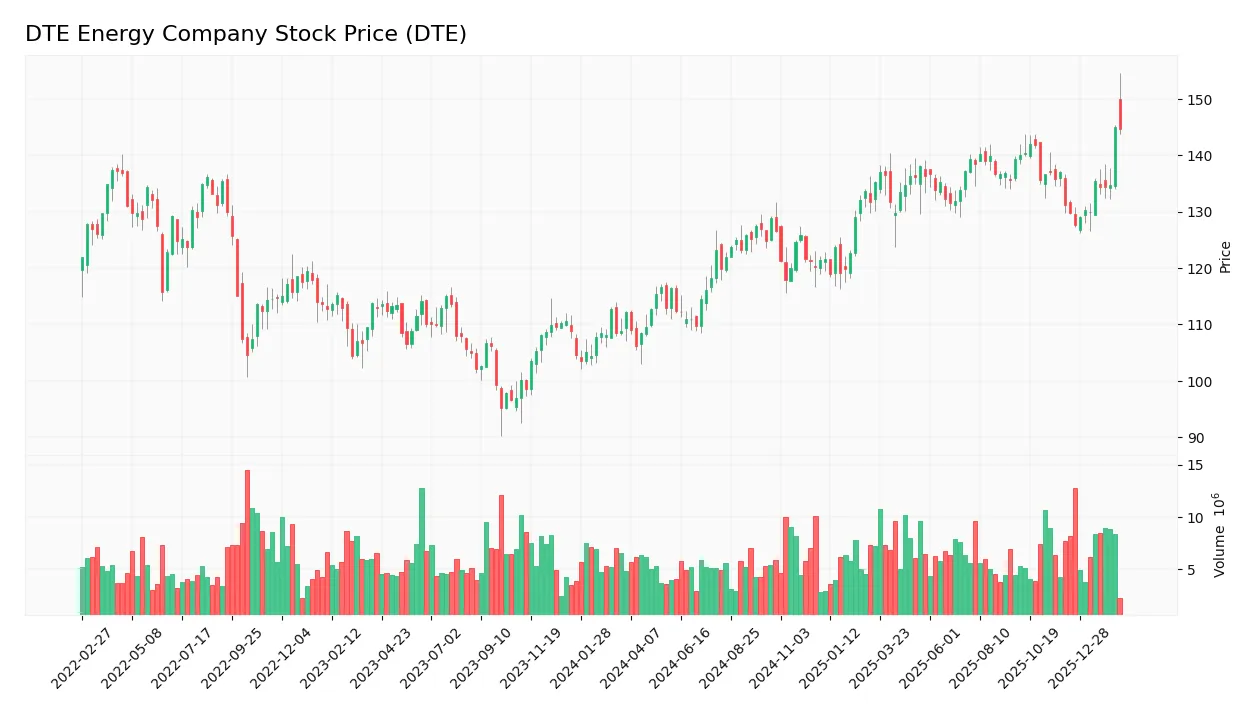
The weekly stock chart of DTE Energy Company illustrates price movements and volatility over the past 100 weeks:
Trend Analysis
Over the past 100 weeks, DTE stock gained 29.03%, marking a bullish trend with acceleration. The price ranged from 106.25 to a high of 144.94, supported by a 9.66 volatility measure. Recent 11-week data confirms continued momentum with a 10.26% rise and a slope of 1.32.
Volume Analysis
In the last three months, trading volume increased, but buyer dominance slipped to 48.65%, suggesting neutral buyer behavior. Total volume reached 73M shares, with seller volume slightly exceeding buyer volume, indicating balanced market participation and cautious investor sentiment.
Target Prices
Analysts set a solid target consensus for DTE Energy Company, reflecting confidence in its future performance.
| Target Low | Target High | Consensus |
|---|---|---|
| 141 | 152 | 146.75 |
The target range from 141 to 152 indicates moderate upside potential. The consensus near 147 suggests steady, optimistic expectations.

Don’t Let Luck Decide Your Entry Point
Optimize your entry points with our advanced ProRealTime indicators. You’ll get efficient buy signals with precise price targets for maximum performance. Start outperforming now!
Analyst & Consumer Opinions
This section reviews recent analyst ratings and consumer feedback related to DTE Energy Company (DTE).
Stock Grades
Here are the latest verified analyst grades for DTE Energy Company from leading financial institutions:
| Grading Company | Action | New Grade | Date |
|---|---|---|---|
| Morgan Stanley | Maintain | Overweight | 2026-02-02 |
| Jefferies | Maintain | Buy | 2026-01-28 |
| Mizuho | Maintain | Outperform | 2026-01-26 |
| Wells Fargo | Maintain | Overweight | 2026-01-20 |
| Barclays | Maintain | Equal Weight | 2026-01-15 |
| BMO Capital | Maintain | Market Perform | 2025-12-24 |
| UBS | Maintain | Buy | 2025-12-17 |
| Jefferies | Upgrade | Buy | 2025-12-11 |
| JP Morgan | Maintain | Neutral | 2025-12-11 |
| B of A Securities | Maintain | Buy | 2025-11-05 |
Most analysts maintain positive stances, with multiple “Buy” and “Overweight” ratings. The consensus leans slightly more cautious, showing a balance between “Hold” and “Buy” grades.
Consumer Opinions
Consumers express a mix of appreciation and frustration toward DTE Energy Company, reflecting typical utility sector challenges.
| Positive Reviews | Negative Reviews |
|---|---|
| Reliable energy supply with minimal outages | Customer service response times are slow |
| Competitive pricing compared to peers | Billing errors occasionally occur |
| Clear communication during outages | Limited renewable energy options |
Overall, customers praise DTE for dependable service and fair pricing. However, slow support and billing issues remain persistent concerns. The company could improve by accelerating its renewable energy transition to align with evolving consumer expectations.
Risk Analysis
Below is a detailed table summarizing DTE Energy Company’s key risk factors, their likelihood, and potential impact:
| Category | Description | Probability | Impact |
|---|---|---|---|
| Operational Risk | Dependence on fossil fuels and nuclear plants exposes DTE to regulatory shifts and operational disruptions. | Medium | High |
| Financial Risk | Negative ROIC (-127.74%) versus 8.65% WACC signals poor capital efficiency and potential value destruction. | High | High |
| Liquidity Risk | Zero current and quick ratios indicate weak short-term liquidity, raising concern over meeting obligations. | High | Medium |
| Market Risk | Beta of 0.50 suggests low sensitivity to market swings, but utility sector cyclicality remains a factor. | Low | Medium |
| Credit Risk | Interest coverage at 0.0 flags inability to cover interest expenses from operating income. | High | High |
| Dividend Risk | Dividend yield of 3.17% is favorable but depends on stable cash flow amid industry challenges. | Medium | Medium |
The most alarming risks are DTE’s severely negative ROIC and zero interest coverage, signaling inefficient capital use and potential financial strain. While the company benefits from low market volatility, its liquidity red flags and operational exposure to fossil fuel regulations demand caution. I observe that utilities with similar profiles have struggled during energy transition phases. Investors should weigh these risks carefully against the dividend yield and regulatory environment.
Should You Buy DTE Energy Company?
DTE Energy appears to have a manageable leverage profile supported by a favorable debt-to-equity score. Despite a very unfavorable moat due to declining ROIC and value destruction, profitability metrics suggest moderate operational efficiency. The overall B- rating indicates a cautious profile with some strengths.
Strength & Efficiency Pillars
DTE Energy Company posts a net margin of 9.24%, reflecting solid operational profitability. Return on equity stands at a moderate 11.88%, indicating reasonable shareholder returns. However, the return on invested capital (ROIC) is deeply negative at -127.74%, falling well below the weighted average cost of capital (WACC) of 8.65%. This signals the company is currently destroying value rather than creating it. Despite favorable leverage metrics, the weak capital efficiency undermines its long-term value proposition.
Weaknesses and Drawbacks
A critical red flag emerges with the current ratio and quick ratio both at 0, indicating poor liquidity and potential short-term solvency issues. The interest coverage ratio is also 0, suggesting difficulty servicing debt costs. Valuation metrics like P/E at 18.26 and P/B at 2.17 are neutral but could pressure returns if growth falters. Although debt-to-equity is low at 0.2, the negative ROIC and cash flow scores highlight operational inefficiencies and financial strain. Recent buyer dominance has waned to 48.65%, reflecting a cautious market stance.
Our Final Verdict about DTE Energy Company
Although DTE shows decent net margins and a strong Piotroski score of 7, its deeply negative ROIC and liquidity red flags suggest significant risks. The bullish long-term price trend contrasts with recent neutral buyer behavior, implying a wait-and-see approach. The company’s profile might appear attractive for investors willing to tolerate operational challenges, but the value destruction and liquidity concerns counsel prudence and careful timing.
Disclaimer: This content is for informational purposes only and does not constitute financial, investment, or other professional advice. Investing in financial markets involves a significant risk of loss, and past performance is not indicative of future results.
Additional Resources
- DTE Energy ordered to pay $100M for Clean Air Act violations at Zug Island facility – WDIV (Feb 18, 2026)
- DTE Energy Company Q4 2025 Earnings Call Summary – Yahoo Finance (Feb 17, 2026)
- DTE Energy reports 2025 accomplishments, earnings and investments – PR Newswire (Feb 17, 2026)
- Decoding DTE Energy Co (DTE): A Strategic SWOT Insight – GuruFocus (Feb 18, 2026)
- DTE Energy’s 5-year spending plan jumps 20% on data center, reliability investments – Utility Dive (Feb 17, 2026)
For more information about DTE Energy Company, please visit the official website: newlook.dteenergy.com