Home > Analyses > Basic Materials > Dow Inc.
Dow Inc. powers the modern world by crafting advanced materials that underpin everyday essentials—from packaging to infrastructure. As a dominant force in chemicals, Dow blends innovation with scale, serving diverse industries globally with specialty plastics, coatings, and performance materials. Its reputation for quality and market influence runs deep. Yet, in 2026, I ask: do Dow’s fundamentals still justify its valuation and promise sustainable growth in a shifting economic landscape?

Table of contents
Business Model & Company Overview
Dow Inc., founded in 2018 and headquartered in Midland, Michigan, stands as a leading materials science company in the chemicals sector. It delivers integrated solutions across packaging, infrastructure, mobility, and consumer markets. Its operations span three key segments: Packaging & Specialty Plastics, Industrial Intermediates & Infrastructure, and Performance Materials & Coatings, creating a broad ecosystem of materials that underpin everyday products worldwide.
Dow generates revenue through a balanced mix of commodity chemicals and specialty products, combining hardware-like chemical intermediates with value-added coatings and performance materials. Its global footprint covers the Americas, Europe, the Middle East, Africa, India, and Asia-Pacific, enabling diversification and resilience. Dow’s economic moat lies in its scale, innovation, and deep integration across industries, shaping the future of advanced materials.
Financial Performance & Fundamental Metrics
I analyze Dow Inc.’s income statement, key financial ratios, and dividend payout policy to assess its profitability, efficiency, and shareholder return strategy.
Income Statement
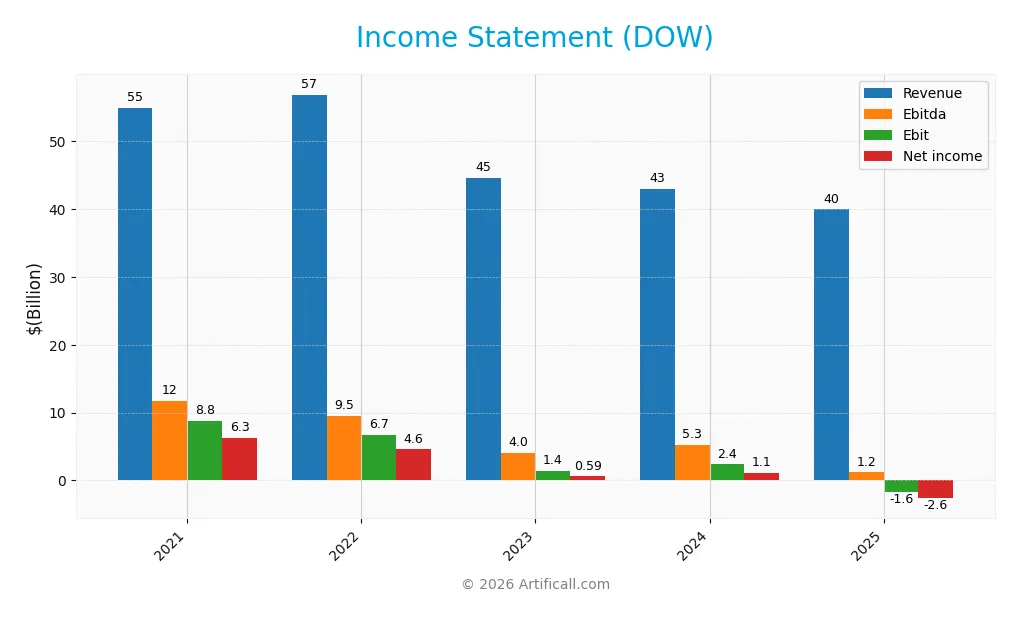
The table below presents Dow Inc.’s key income statement metrics for fiscal years 2021 through 2025, illustrating revenue and profitability trends.
| 2021 | 2022 | 2023 | 2024 | 2025 | |
|---|---|---|---|---|---|
| Revenue | 54.97B | 56.90B | 44.62B | 42.96B | 39.97B |
| Cost of Revenue | 44.58B | 49.05B | 39.65B | 38.51B | 37.57B |
| Operating Expenses | 2.50B | 2.53B | 2.46B | 2.39B | 2.14B |
| Gross Profit | 10.39B | 7.86B | 4.97B | 4.46B | 2.40B |
| EBITDA | 11.68B | 9.50B | 4.00B | 5.25B | 1.19B |
| EBIT | 8.83B | 6.74B | 1.39B | 2.36B | -1.65B |
| Interest Expense | 689M | 651M | 736M | 758M | 865M |
| Net Income | 6.31B | 4.58B | 589M | 1.12B | -2.62B |
| EPS | 8.44 | 6.32 | 0.82 | 1.57 | -3.69 |
| Filing Date | 2022-02-04 | 2023-02-01 | 2024-01-31 | 2025-02-04 | 2026-01-29 |
Income Statement Evolution
Dow Inc.’s revenue declined by 27% from 2021 to 2025, with a 7% drop in the last year alone. Net income fell sharply, turning from a 6.3B profit in 2021 to a 2.6B loss in 2025. Gross margins held steady near 6%, but EBIT and net margins deteriorated significantly, signaling worsening profitability and operational challenges.
Is the Income Statement Favorable?
The 2025 income statement reveals unfavorable fundamentals. Despite stable gross margins, the company’s EBIT margin is negative at -4.1%, driven by high operating and interest expenses. Net margin also declined to -6.6%, reflecting heavy losses. The steep declines in earnings per share and net income underscore downside risks, outweighing the modest favorable interest expense ratio.
Financial Ratios
The table below summarizes key financial ratios for Dow Inc. over the last five fiscal years, providing a clear view of profitability, leverage, liquidity, valuation, efficiency, and dividend metrics:
| Ratios | 2021 | 2022 | 2023 | 2024 | 2025 |
|---|---|---|---|---|---|
| Net Margin | 11.5% | 8.1% | 1.3% | 2.6% | -6.6% |
| ROE | 34.7% | 22.1% | 3.2% | 6.4% | -16.4% |
| ROIC | 12.3% | 8.1% | 5.2% | 3.2% | 0.5% |
| P/E | 6.7 | 7.9 | 65.7 | 25.3 | -6.3 |
| P/B | 2.32 | 1.75 | 2.08 | 1.63 | 1.04 |
| Current Ratio | 1.58 | 1.81 | 1.77 | 1.61 | 1.97 |
| Quick Ratio | 1.02 | 1.19 | 1.16 | 0.98 | 1.25 |
| D/E | 0.89 | 0.81 | 0.88 | 1.02 | 1.29 |
| Debt-to-Assets | 25.6% | 27.6% | 28.4% | 30.8% | 35.4% |
| Interest Coverage | 11.4x | 8.2x | 3.4x | 2.7x | 0.3x |
| Asset Turnover | 0.87 | 0.94 | 0.77 | 0.75 | 0.68 |
| Fixed Asset Turnover | 2.50 | 2.63 | 1.99 | 1.85 | 1.69 |
| Dividend Yield | 4.9% | 5.5% | 5.1% | 7.0% | 9.0% |
Evolution of Financial Ratios
Dow Inc.’s Return on Equity (ROE) declined sharply from 34.7% in 2021 to -16.4% in 2025, reflecting deteriorating profitability. The Current Ratio improved steadily, reaching 1.97 in 2025, indicating stronger short-term liquidity. The Debt-to-Equity Ratio increased to 1.29 in 2025, signaling higher leverage compared to prior years. Profitability margins weakened significantly over the period.
Are the Financial Ratios Favorable?
In 2025, Dow’s profitability ratios are unfavorable, with negative net margin and ROE. Liquidity ratios like Current and Quick Ratios remain favorable, supporting operational stability. Leverage is higher, with an unfavorable Debt-to-Equity Ratio but neutral Debt-to-Assets. Efficiency ratios show neutral asset turnover. Market valuation metrics such as Price-to-Book are favorable, but overall, the financial ratios present a neutral stance reflecting mixed strengths and weaknesses.
Shareholder Return Policy
Dow Inc. maintains a dividend payment with yields near 6-9%, but recent negative net income and free cash flow raise concerns about payout sustainability. The dividend payout ratio swings widely, reflecting volatility in earnings and cash generation.
The company also engages in share buybacks, although cash flow challenges may limit these programs. This mixed distribution strategy signals potential risks for steady long-term shareholder value, demanding careful monitoring of financial health.
Score analysis
The following radar chart illustrates Dow Inc.’s key financial scores across different valuation and performance metrics:
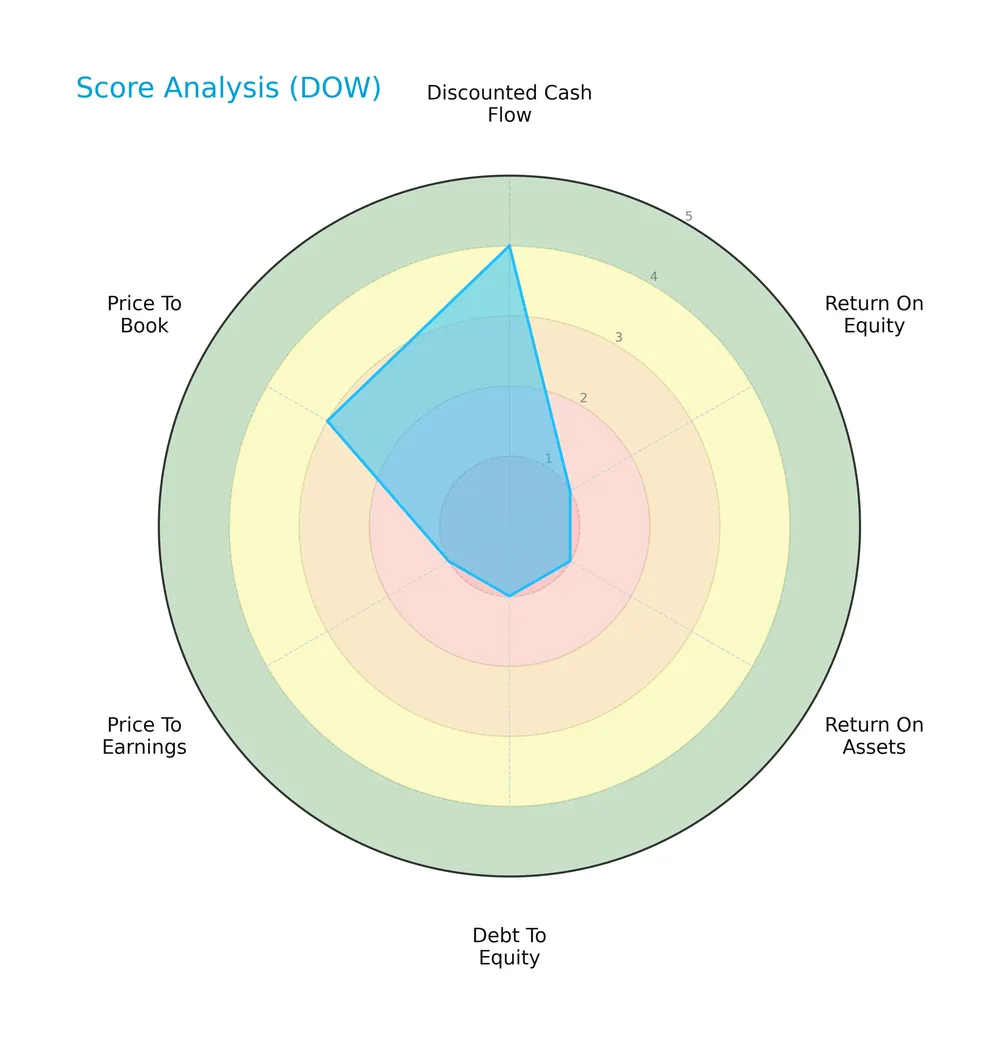
Dow Inc. shows a favorable discounted cash flow score of 4, but very unfavorable scores of 1 for return on equity, return on assets, debt to equity, and price to earnings. The price to book score stands at a moderate 3, reflecting mixed fundamentals.
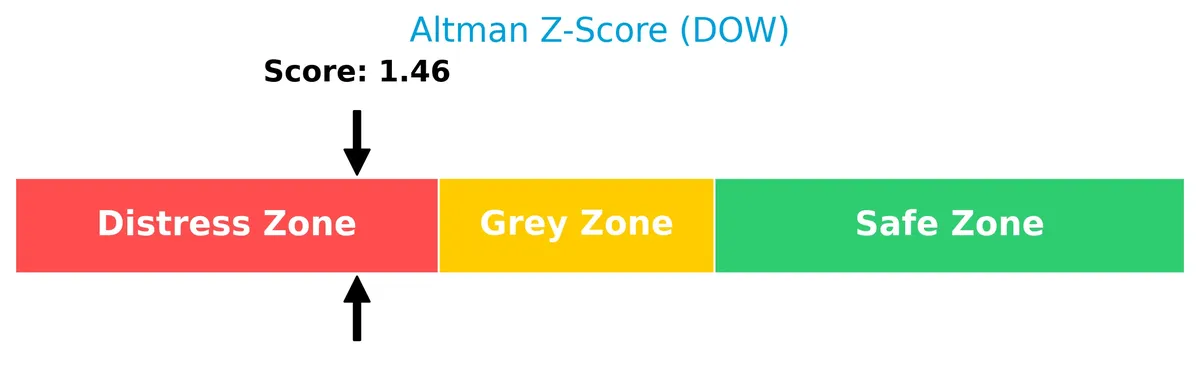
Analysis of the company’s bankruptcy risk
Dow Inc. currently resides in the distress zone with an Altman Z-Score of 1.46, indicating a heightened risk of financial distress and potential bankruptcy:
Is the company in good financial health?
The Piotroski Score diagram highlights Dow Inc.’s financial health status based on nine key criteria:

With a Piotroski Score of 4, Dow Inc. is considered to have average financial strength, suggesting moderate operational efficiency and profitability but room for improvement.
Competitive Landscape & Sector Positioning
This sector analysis examines Dow Inc.’s strategic positioning, revenue streams, key products, competitors, and strengths. I will assess if Dow holds a competitive advantage within its industry peers.
Strategic Positioning
Dow Inc. maintains a diversified product portfolio across Packaging & Specialty Plastics (22B), Industrial Intermediates & Infrastructure (12B), and Performance Materials & Coatings (8.6B). Geographically, it spans North America (16B), EMEA (14B), Asia Pacific (7.7B), and Latin America (4.9B), balancing regional exposure.
Revenue by Segment
The pie chart illustrates Dow Inc.’s revenue distribution across three main segments for the fiscal year 2024, highlighting the company’s core business areas.
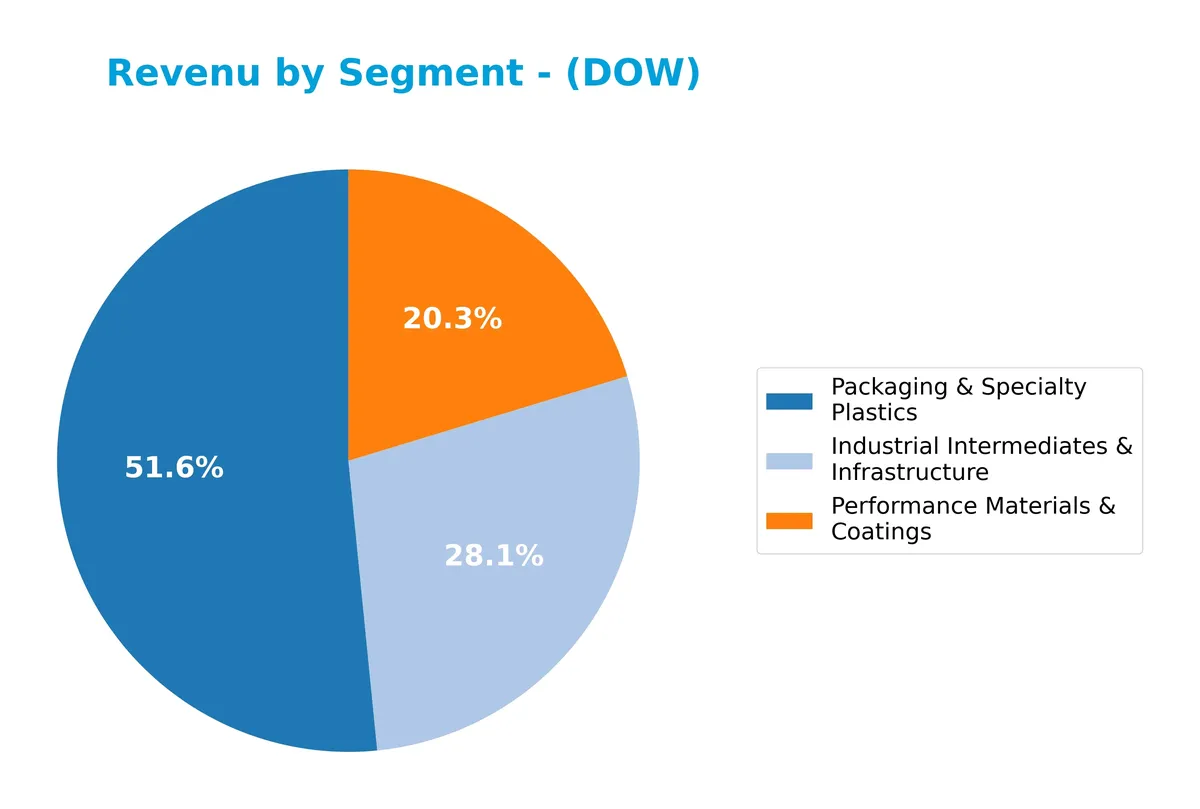
Dow’s Packaging & Specialty Plastics segment leads with $21.8B in revenue, followed by Industrial Intermediates & Infrastructure at $11.9B, and Performance Materials & Coatings at $8.6B. The Packaging segment remains the primary driver despite a recent decline from prior years. Industrial Intermediates show a moderate slowdown, signaling potential market headwinds. Performance Materials holds steady, indicating steady demand but limited growth acceleration.
Key Products & Brands
Dow Inc.’s core offerings span three primary segments, each delivering specialized chemical products and materials:
| Product | Description |
|---|---|
| Packaging & Specialty Plastics | Ethylene, propylene, aromatics; polyethylene, polyolefin elastomers, ethylene vinyl acetate, and EPDM rubbers for packaging and specialty uses. |
| Industrial Intermediates & Infrastructure | Ethylene oxides, propylene oxides, polyether polyols, aromatic isocyanates, polyurethane systems, caustic soda, vinyl chloride monomers, coatings, adhesives, sealants, elastomers, and composites. |
| Performance Materials & Coatings | Architectural and industrial paints and coatings, performance silicones, specialty materials, silicone feedstocks, used in maintenance, protective industries, packaging, traffic markings, thermal paper, and leather. |
Dow’s product portfolio reflects a diversified chemicals business focused on advanced materials for packaging, construction, and performance applications. The company’s global footprint supports broad market demand across various industrial sectors.
Main Competitors
The Basic Materials sector includes 21 competitors, with the table below showing the top 10 leaders by market capitalization:
| Competitor | Market Cap. |
|---|---|
| Linde plc | 200.4B |
| Newmont Corporation | 110.5B |
| CRH plc | 84.8B |
| The Sherwin-Williams Company | 81.5B |
| Freeport-McMoRan Inc. | 74.6B |
| Ecolab Inc. | 74.5B |
| Air Products and Chemicals, Inc. | 55.8B |
| Corteva, Inc. | 45.8B |
| Nucor Corporation | 38.8B |
| Vulcan Materials Company | 38.7B |
Dow Inc. ranks 15th among 21 competitors. Its market cap is roughly 11% of Linde plc, the sector leader. Dow’s scale is below both the top 10 average (80.5B) and the sector median (38.3B). It trails its closest rival by about 20%, reflecting a moderate gap in market capitalization.
Comparisons with competitors
Check out how we compare the company to its competitors:
Aucun article trouvé pour ces critères.
Does DOW have a competitive advantage?
Dow Inc. shows a very unfavorable competitive position, with a declining ROIC well below its WACC, indicating persistent value destruction and weakening profitability. The company’s chemical industry operations have not generated excess returns from 2021 to 2025, reflecting challenges in capital efficiency and competitive strength.
Looking ahead, Dow’s broad geographic footprint across the U.S., Europe, Asia Pacific, and Latin America may present growth opportunities in packaging, infrastructure, and specialty materials. However, recent unfavorable income trends and margin pressures highlight the need for cautious evaluation of future product and market expansions.
SWOT Analysis
This SWOT analysis highlights Dow Inc.’s critical internal and external factors shaping its competitive stance and strategic priorities.
Strengths
- diversified global presence
- strong dividend yield (8.96%)
- favorable liquidity ratios (current ratio 1.97)
Weaknesses
- declining profitability with negative net margin (-6.56%)
- value destruction indicated by ROIC below WACC
- high debt-to-equity ratio (1.29)
Opportunities
- growth potential in emerging markets
- demand for sustainable materials
- innovation in performance coatings
Threats
- cyclical raw material price volatility
- macroeconomic slowdown impacting industrial demand
- intense competition in chemicals sector
Dow Inc.’s strengths in global reach and liquidity are undermined by weak profitability and capital efficiency. The firm must leverage emerging market demand and sustainability trends while managing debt and cost pressures prudently.
Stock Price Action Analysis
The weekly stock chart for Dow Inc. highlights its recent price movements and volatility over the last 100 weeks:
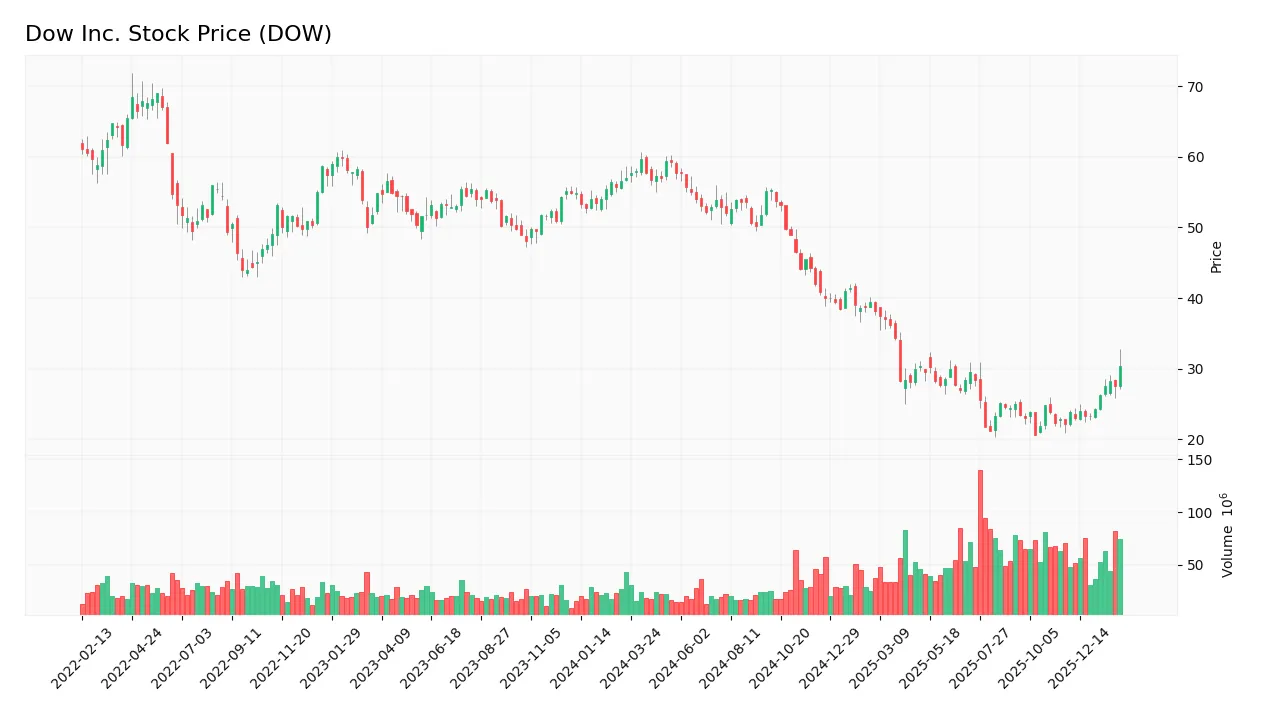
Trend Analysis
Over the past 12 months, Dow Inc.’s stock price declined sharply by 46.77%, indicating a clear bearish trend. The trend shows acceleration, supported by a high volatility level with a 13.04 standard deviation. Prices ranged from a high of 59.69 to a low of 20.65 during this period.
Volume Analysis
Trading volume shows an increasing trend overall, with sellers accounting for 56.54% of total volume. However, in the recent three months, buyers gained dominance at 59.12%, suggesting a shift toward buyer-driven activity and potentially rising investor interest or confidence.
Target Prices
Analysts project a target price consensus reflecting modest upside potential for Dow Inc.
| Target Low | Target High | Consensus |
|---|---|---|
| 25 | 30 | 27.71 |
The target range suggests cautious optimism, with analysts expecting steady performance around $28 per share.

Don’t Let Luck Decide Your Entry Point
Optimize your entry points with our advanced ProRealTime indicators. You’ll get efficient buy signals with precise price targets for maximum performance. Start outperforming now!
Analyst & Consumer Opinions
This section examines the latest analyst ratings and consumer feedback reflecting market sentiment on Dow Inc. (DOW).
Stock Grades
Here is the latest summary of Dow Inc.’s stock grades from recognized financial institutions:
| Grading Company | Action | New Grade | Date |
|---|---|---|---|
| Jefferies | Maintain | Hold | 2026-01-30 |
| JP Morgan | Maintain | Neutral | 2026-01-30 |
| RBC Capital | Maintain | Sector Perform | 2026-01-30 |
| RBC Capital | Maintain | Sector Perform | 2026-01-16 |
| Citigroup | Maintain | Neutral | 2026-01-15 |
| Mizuho | Maintain | Neutral | 2026-01-08 |
| UBS | Maintain | Neutral | 2025-12-23 |
| Citigroup | Maintain | Neutral | 2025-11-19 |
| Goldman Sachs | Maintain | Neutral | 2025-10-29 |
| UBS | Maintain | Neutral | 2025-10-24 |
The consensus among analysts remains firmly on hold or neutral, reflecting cautious sentiment toward Dow Inc. There are no upgrades or downgrades, signaling stable but unexcited outlooks across the board.
Consumer Opinions
Consumer sentiment around Dow Inc. reflects a mix of admiration for its innovation and concerns over pricing.
| Positive Reviews | Negative Reviews |
|---|---|
| “Dow’s product quality is consistently excellent and reliable.” | “Pricing has become less competitive compared to peers.” |
| “Strong commitment to sustainability impresses customers.” | “Customer service response times could improve.” |
| “Innovative solutions keep us coming back for more.” | “Some delivery delays impact project timelines.” |
Overall, consumers praise Dow’s innovation and product reliability. However, recurring issues with pricing and service responsiveness highlight areas needing attention to maintain loyalty.
Risk Analysis
Below is a summary of key risks facing Dow Inc., including their likelihood and potential impact:
| Category | Description | Probability | Impact |
|---|---|---|---|
| Financial Health | Altman Z-Score of 1.46 signals high bankruptcy risk; negative ROE and net margin persist. | High | Severe |
| Profitability | Negative net margin (-6.56%) and ROIC (0.51%) below WACC (5.46%) indicate poor returns. | High | High |
| Leverage | Debt-to-equity ratio of 1.29 and negative interest coverage (-1.9) raise solvency concerns. | High | Severe |
| Market Volatility | Beta of 0.75 suggests moderate sensitivity to market swings; recent 5.8% price drop noted. | Moderate | Moderate |
| Dividend Stability | High dividend yield (8.96%) carries risk if earnings remain negative and cash flow weak. | Moderate | Moderate |
Dow’s distressed Altman Z-Score and negative profitability metrics pose the most critical threats. The company’s leverage and poor interest coverage compound financial strain. Recent stock declines reflect market skepticism. Investors must weigh these risks carefully against favorable valuation metrics.
Should You Buy Dow Inc.?
Dow Inc. appears to be facing substantial challenges with declining profitability and a deteriorating competitive moat, suggesting value destruction. Despite a manageable current liquidity profile, the company’s leverage and capital efficiency remain unfavorable. Its overall rating could be seen as a cautious C.
Strength & Efficiency Pillars
Dow Inc. displays solid financial health with a current ratio of 1.97 and a quick ratio of 1.25, signaling adequate short-term liquidity. The weighted average cost of capital (WACC) stands at a favorable 5.46%, underscoring efficient capital costs. However, profitability metrics underwhelm: net margin is negative at -6.56%, return on equity (ROE) is -16.39%, and return on invested capital (ROIC) barely registers at 0.51%. ROIC falls short of WACC, indicating the company is not creating value but instead destroying it. The Altman Z-Score at 1.46 places Dow in the distress zone, raising concerns about financial stability.
Weaknesses and Drawbacks
Dow faces significant headwinds. Its negative P/E ratio (-6.34) and a moderate P/B of 1.04 suggest valuation challenges, with the former reflecting losses. Leverage is elevated, with a debt-to-equity ratio of 1.29 branded unfavorable, compounded by an interest coverage ratio of -1.9, highlighting difficulty servicing debt. The company’s profitability decline is stark, with revenue down 6.97% in one year and net income shrinking by 141.56% over the period. Market pressure persists but recent trends show a slight buyer dominance at 59.12%, offering cautious optimism.
Our Verdict about Dow Inc.
Dow’s long-term fundamental profile is unfavorable due to persistent losses, weak profitability, and financial distress signals. The overall bearish stock trend with a 46.77% price decline compounds risk. Yet, recent buyer dominance and a 36.78% price uptick since late 2025 may appear as tentative positive signs. Despite these, the balance of evidence suggests a wait-and-see approach. The company might recover but remains a high-risk exposure for investors seeking stable value creation.
Disclaimer: This content is for informational purposes only and does not constitute financial, investment, or other professional advice. Investing in financial markets involves a significant risk of loss, and past performance is not indicative of future results.
Additional Resources
- Dow Inc. (DOW): A Bull Case Theory – Yahoo Finance (Feb 04, 2026)
- Dow to cut about 4,500 jobs as emphasis shifts to AI and automation – ABC News (Jan 29, 2026)
- Dow to cut 4,500 jobs, forecasts weak revenue amid sluggish demand – Reuters (Jan 29, 2026)
- Dow to cut 4,500 jobs as part of $2B savings plan – Manufacturing Dive (Jan 30, 2026)
- Dow to Cut About 4,500 Jobs, Using AI to Boost Operations – Bloomberg (Jan 29, 2026)
For more information about Dow Inc., please visit the official website: dow.com