Home > Analyses > Industrials > Dover Corporation
Dover Corporation powers critical industries with precision machinery and innovative solutions that touch daily life worldwide. Its diverse portfolio spans industrial automation, clean energy fueling, and advanced imaging, anchoring Dover as a cornerstone in industrial machinery. Known for quality and market influence, it continually adapts through cutting-edge technologies. As we delve into its fundamentals, the key question emerges: does Dover’s robust innovation and broad market reach still justify its current valuation and growth prospects?

Table of contents
Business Model & Company Overview
Dover Corporation, founded in 1947 and headquartered in Downers Grove, Illinois, stands as a leader in industrial machinery. It operates a cohesive ecosystem spanning engineered products, clean energy, imaging, pumps, and climate technologies. This diverse portfolio serves industries from aerospace to retail, all united by a core mission to provide innovative equipment, software, and services that enhance operational efficiency.
Dover’s revenue engine balances hardware sales with software and recurring services, creating steady cash flow across global markets in the Americas, Europe, and Asia. Its strategic presence supports end-markets like vehicle service, clean fuel, and packaging intelligence. I view Dover’s wide-ranging industrial footprint and integrated solutions as a strong economic moat, positioning it to shape the future of industrial innovation.
Financial Performance & Fundamental Metrics
I will analyze Dover Corporation’s income statement, key financial ratios, and dividend payout policy to assess its core financial health and shareholder value.
Income Statement
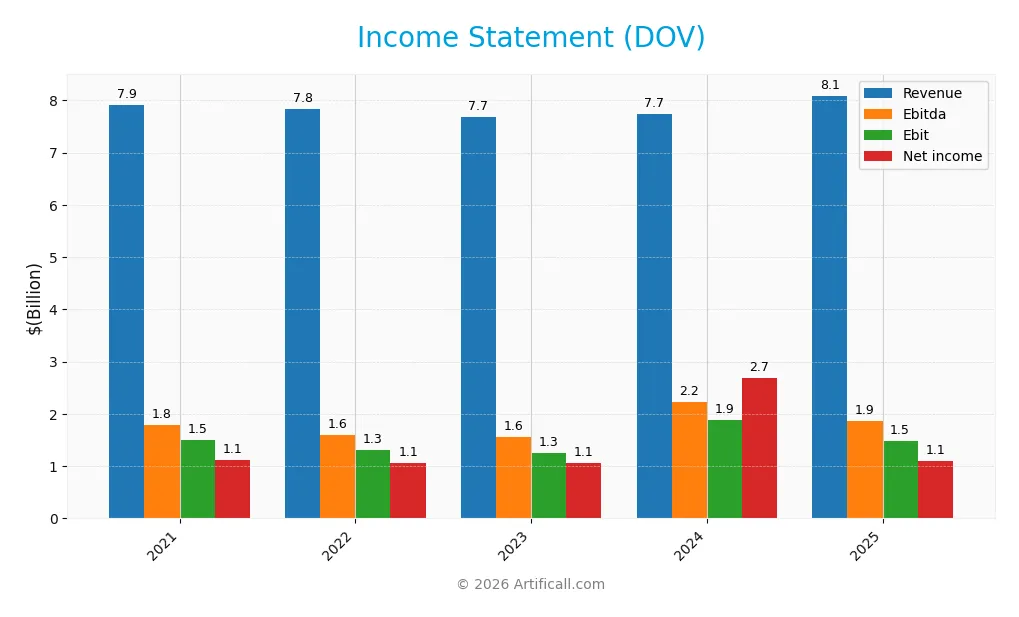
Below is Dover Corporation’s Income Statement for fiscal years 2021 through 2025, showing key financial performance metrics in USD.
| 2021 | 2022 | 2023 | 2024 | 2025 | |
|---|---|---|---|---|---|
| Revenue | 7.91B | 7.84B | 7.68B | 7.75B | 8.09B |
| Cost of Revenue | 4.94B | 4.94B | 4.82B | 4.79B | 4.87B |
| Operating Expenses | 1.69B | 1.63B | 1.65B | 1.75B | 1.84B |
| Gross Profit | 2.97B | 2.90B | 2.87B | 2.96B | 3.22B |
| EBITDA | 1.80B | 1.60B | 1.56B | 2.23B | 1.86B |
| EBIT | 1.51B | 1.31B | 1.25B | 1.89B | 1.48B |
| Interest Expense | 106M | 116M | 131M | 131M | 110M |
| Net Income | 1.12B | 1.07B | 1.06B | 2.70B | 1.09B |
| EPS | 7.81 | 7.47 | 7.56 | 19.58 | 7.97 |
| Filing Date | 2022-02-11 | 2023-02-10 | 2024-02-09 | 2025-02-14 | 2026-02-13 |
Income Statement Evolution
Dover Corporation’s revenue showed modest growth, increasing 4.5% from 2024 to 2025 but only 2.4% over 2021-2025. Gross profit expanded 8.8% year-over-year, improving margins to 39.8%. However, EBIT declined 21.4% in the last year, dragging net margins down by 61.2%, reflecting margin pressures despite stable top-line growth.
Is the Income Statement Favorable?
In 2025, Dover posted a net margin of 13.5%, supported by a favorable gross margin of 39.8% and a low interest expense ratio of 1.36%. Despite these strengths, the 21.4% EBIT drop and steep net margin contraction raise concerns. Overall, the fundamentals appear unfavorable given the combination of margin erosion and declining net income growth.
Financial Ratios
The following table presents Dover Corporation’s key financial ratios for 2021 through 2025, illustrating profitability, valuation, liquidity, leverage, efficiency, and dividend metrics:
| Ratios | 2021 | 2022 | 2023 | 2024 | 2025 |
|---|---|---|---|---|---|
| Net Margin | 14% | 14% | 14% | 35% | 14% |
| ROE | 27% | 25% | 21% | 39% | 15% |
| ROIC | 12% | 12% | 11% | 9% | 9% |
| P/E | 23.3 | 18.1 | 20.4 | 9.6 | 24.5 |
| P/B | 6.2 | 4.5 | 4.2 | 3.7 | 3.6 |
| Current Ratio | 1.36 | 1.23 | 1.40 | 2.04 | 1.79 |
| Quick Ratio | 0.83 | 0.74 | 0.90 | 1.52 | 1.28 |
| D/E | 0.79 | 0.91 | 0.72 | 0.45 | 0.45 |
| Debt-to-Assets | 32% | 36% | 32% | 25% | 25% |
| Interest Coverage | 12.1 | 11.0 | 9.3 | 9.2 | 12.5 |
| Asset Turnover | 0.76 | 0.72 | 0.68 | 0.62 | 0.60 |
| Fixed Asset Turnover | 8.26 | 7.81 | 7.45 | 7.84 | 7.23 |
| Dividend Yield | 1.10% | 1.49% | 1.32% | 1.10% | 1.06% |
Evolution of Financial Ratios
Dover Corporation’s Return on Equity (ROE) showed volatility, peaking sharply in 2024 before retreating by 2025, signaling fluctuating profitability. The Current Ratio improved steadily from 1.23 in 2022 to 1.79 in 2025, reflecting enhanced liquidity. Debt-to-Equity consistently declined from 0.91 in 2022 to 0.45 in 2025, indicating reduced leverage and stronger balance sheet stability.
Are the Financial Ratios Favorable?
In 2025, Dover’s profitability remains solid with a net margin of 13.5%, deemed favorable, while ROE and ROIC align neutrally against a WACC of 9.1%. Liquidity ratios, including a current ratio of 1.79 and quick ratio of 1.28, are favorable, supporting short-term financial health. Low leverage ratios and strong interest coverage further enhance creditworthiness. However, the price-to-book ratio is unfavorable at 3.62, suggesting valuation concerns. Overall, ratios lean slightly favorable with balanced risk factors.
Shareholder Return Policy
Dover Corporation maintains a consistent dividend policy with a payout ratio near 26% and a stable dividend per share around $2.06 in 2025. The annual yield is modest at about 1.06%, supported by free cash flow coverage and occasional share buybacks.
This balanced approach to dividends and buybacks signals prudent capital allocation, aligning payment levels with sustainable earnings and cash flow. It supports long-term shareholder value without risking over-distribution or excessive leverage.
Score analysis
Here is a radar chart summarizing Dover Corporation’s key financial scores for a quick comparative view:
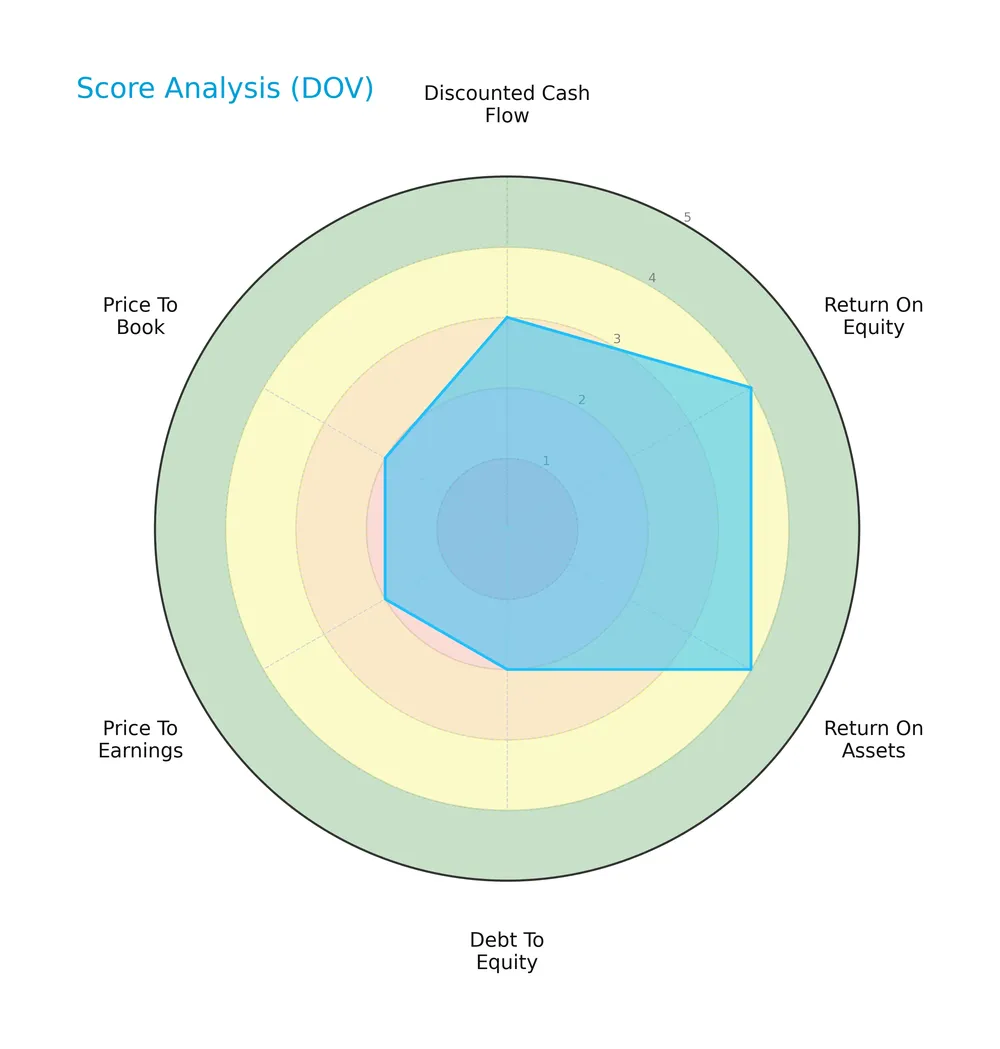
Dover shows favorable profitability scores with ROE and ROA both rated 4. Its discounted cash flow score is moderate at 3. However, leverage and valuation metrics such as debt-to-equity, P/E, and P/B are all unfavorable with scores of 2.
Analysis of the company’s bankruptcy risk
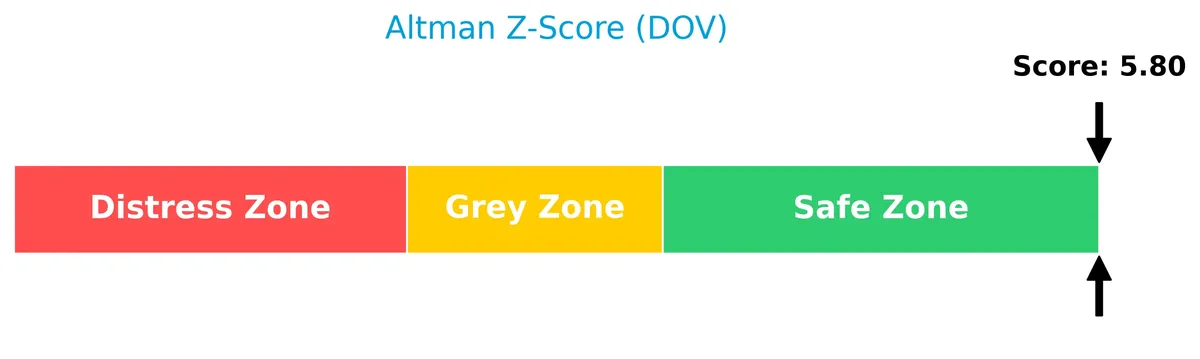
Dover’s Altman Z-Score places it firmly in the safe zone, indicating a low probability of financial distress and bankruptcy risk:
Is the company in good financial health?
The Piotroski Score diagram highlights Dover’s financial strength and operational efficiency as average:

With a score of 6, Dover demonstrates moderate financial health. This suggests reasonable but not outstanding fundamentals compared to stronger firms in the sector.
Competitive Landscape & Sector Positioning
This analysis explores Dover Corporation’s strategic positioning and revenue by segment within the industrial machinery sector. I will evaluate whether Dover holds a competitive advantage over its main competitors based on its key products and market footprint.
Strategic Positioning
Dover Corporation maintains a diversified product portfolio across five industrial segments, including Clean Energy & Fueling, Climate & Sustainability, Engineered Products, Imaging & Identification, and Pumps & Process Solutions. Its revenue streams span major geographic regions, with significant concentration in the United States and Europe.
Revenue by Segment
This pie chart displays Dover Corporation’s revenue distribution by segment for fiscal year 2024, illustrating the company’s diverse business streams and their relative contributions.
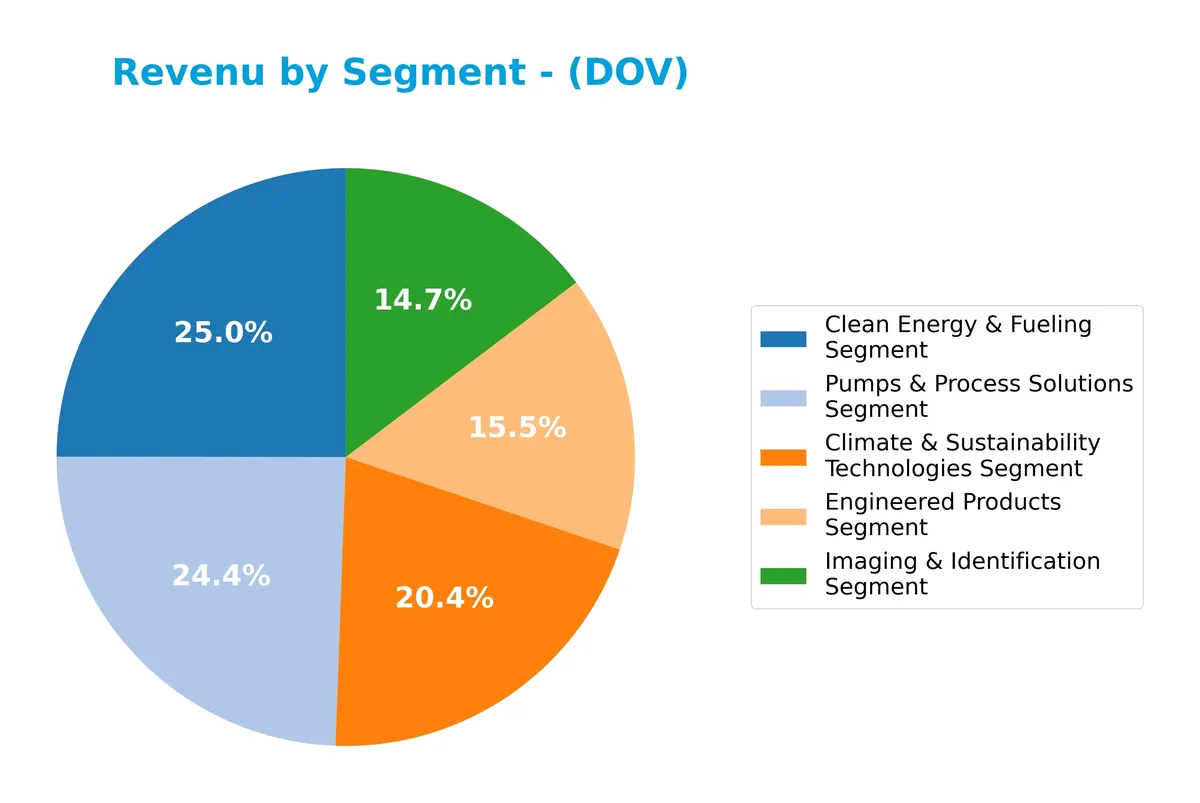
In 2024, Clean Energy & Fueling led with $1.9B, closely followed by Pumps & Process Solutions at $1.9B. Climate & Sustainability Technologies declined to $1.6B, signaling a recent slowdown. Engineered Products and Imaging & Identification generated $1.2B and $1.1B respectively, showing moderate stability. The shift toward energy and process solutions underlines Dover’s strategic focus on sustainable and industrial growth areas.
Key Products & Brands
Dover Corporation’s portfolio spans multiple industrial segments, offering diverse equipment and technology solutions:
| Product | Description |
|---|---|
| Engineered Products | Equipment and components for vehicle service, waste handling, industrial automation, aerospace, defense, and fluid dispensing. |
| Clean Energy & Fueling | Components, equipment, software, and services for safe transport and retail of traditional and clean fuels and hazardous substances. |
| Imaging & Identification | Precision marking, coding, packaging intelligence, product traceability, brand protection, and digital textile printing equipment. |
| Pumps & Process Solutions | Specialty pumps, connectors, flow meters, fluid connecting solutions, plastics processing equipment, and engineered rotating components. |
| Climate & Sustainability Technologies | Refrigeration systems, display cases, commercial glass doors, and heat exchangers for industrial and residential climate control. |
Dover’s product range addresses various end markets, focusing on industrial efficiency, clean energy, and sustainability technologies. The company’s diversified segments provide resilience amid market fluctuations.
Main Competitors
There are 24 competitors in the Industrials – Industrial Machinery sector, with the top 10 leaders by market capitalization listed below:
| Competitor | Market Cap. |
|---|---|
| Eaton Corporation plc | 127B |
| Parker-Hannifin Corporation | 114.2B |
| Howmet Aerospace Inc. | 85.2B |
| Emerson Electric Co. | 76.3B |
| Illinois Tool Works Inc. | 73B |
| Cummins Inc. | 71.9B |
| AMETEK, Inc. | 48.3B |
| Roper Technologies, Inc. | 46.8B |
| Rockwell Automation, Inc. | 44.8B |
| Symbotic Inc. | 35.9B |
Dover Corporation ranks 14th among 24 competitors, with a market cap about 25% that of Eaton Corporation plc, the sector leader. It stands below both the top 10 average of 72.4B and the sector median of 32.4B. Dover is positioned very close to the next competitor above, with only a ±0.8% market cap difference, but significantly below the competitor below by 84%.
Comparisons with competitors
Check out how we compare the company to its competitors:
Does Dover Corporation have a competitive advantage?
Dover Corporation currently does not present a competitive advantage as its return on invested capital (ROIC) trails its weighted average cost of capital (WACC), indicating value erosion. The company’s ROIC has steadily declined over the 2021-2025 period, reflecting decreasing profitability and inefficiencies in capital use.
Looking ahead, Dover’s diverse product segments spanning industrial machinery, clean energy, and climate technologies offer potential market opportunities. Expansion into software solutions and digital services across various industries could support future growth, though execution risks remain amid recent financial headwinds.
SWOT Analysis
This analysis highlights Dover Corporation’s key internal and external factors influencing its strategic position.
Strengths
- diversified industrial portfolio
- strong gross and net margins
- favorable liquidity and leverage ratios
Weaknesses
- declining ROIC trend
- recent net margin and EPS contraction
- unfavorable price-to-book ratio
Opportunities
- growth in clean energy and fueling solutions
- expanding digital and automation offerings
- geographic revenue diversification
Threats
- macroeconomic volatility impacting industrial demand
- intensifying competition in machinery sector
- raw material cost pressures
Dover’s solid margins and diversified base provide resilience. However, declining profitability metrics warrant caution. Strategic focus on clean energy and automation can drive future growth while managing industry headwinds.
Stock Price Action Analysis
The weekly stock chart for Dover Corporation (DOV) illustrates a significant upward price movement over the past year:
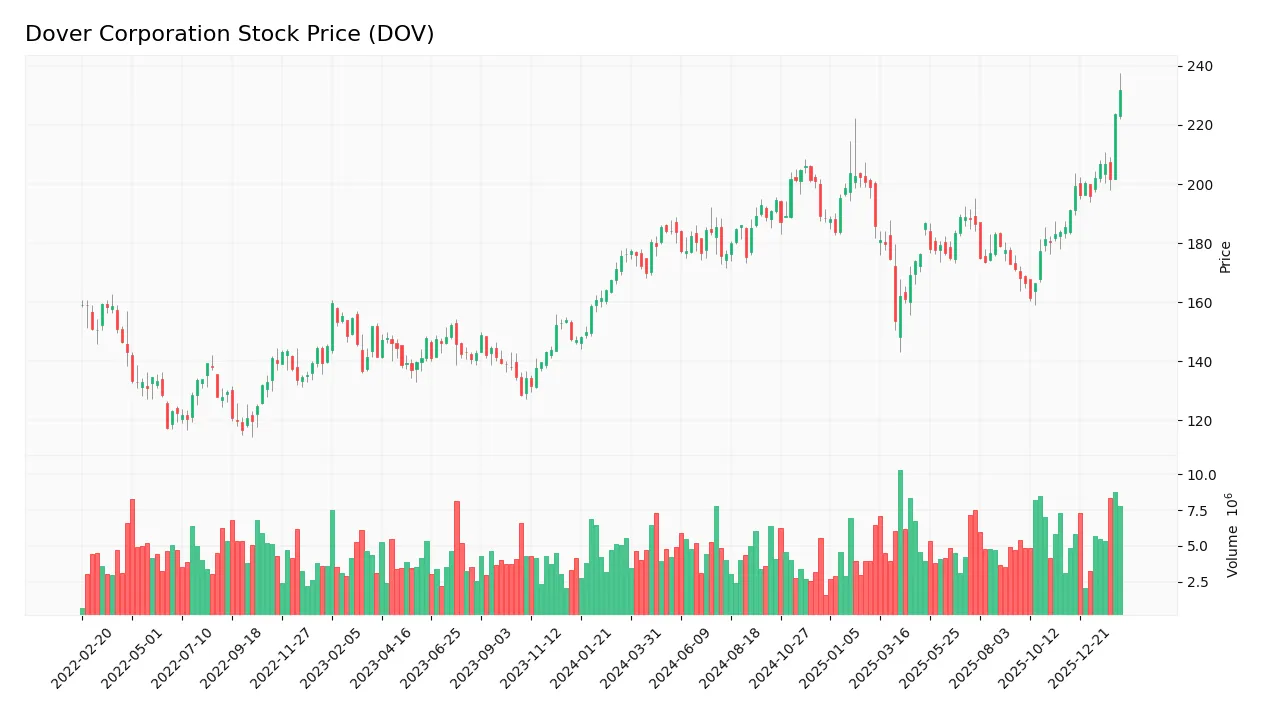
Trend Analysis
Over the past 12 months, DOV’s stock price rose 31.3%, marking a bullish trend with clear acceleration. The price fluctuated between 153.55 and a high of 231.63, with volatility measured by a 12.76% standard deviation. Recent months confirm sustained upward momentum.
Volume Analysis
Trading volume increased notably, with buyers accounting for 56.17% of total activity over the year. In the last three months, buyer dominance surged to 72.14%, indicating strong buyer-driven momentum and heightened market participation.
Target Prices
Analysts set a solid target consensus for Dover Corporation, reflecting confident growth expectations.
| Target Low | Target High | Consensus |
|---|---|---|
| 195 | 256 | 223.7 |
The target range from 195 to 256 indicates bullish sentiment, with a consensus price of 223.7 suggesting substantial upside potential.

Don’t Let Luck Decide Your Entry Point
Optimize your entry points with our advanced ProRealTime indicators. You’ll get efficient buy signals with precise price targets for maximum performance. Start outperforming now!
Analyst & Consumer Opinions
I present a detailed analysis of Dover Corporation’s recent analyst grades and consumer feedback to assess market sentiment.
Stock Grades
Here are the latest verified stock grades from leading financial institutions for Dover Corporation:
| Grading Company | Action | New Grade | Date |
|---|---|---|---|
| JP Morgan | Maintain | Overweight | 2026-01-30 |
| Wells Fargo | Maintain | Equal Weight | 2026-01-30 |
| RBC Capital | Maintain | Sector Perform | 2026-01-30 |
| Oppenheimer | Maintain | Outperform | 2026-01-26 |
| JP Morgan | Maintain | Overweight | 2026-01-16 |
| Barclays | Maintain | Equal Weight | 2026-01-07 |
| Wells Fargo | Maintain | Equal Weight | 2026-01-07 |
| UBS | Upgrade | Buy | 2026-01-05 |
| Wells Fargo | Maintain | Equal Weight | 2025-12-15 |
| Oppenheimer | Maintain | Outperform | 2025-11-14 |
The grades show a stable outlook with most firms maintaining their positions. UBS’s recent upgrade to Buy stands out amid consistent Overweight and Equal Weight assessments.
Consumer Opinions
Consumer sentiment around Dover Corporation reflects a blend of appreciation for product quality and concerns over service responsiveness.
| Positive Reviews | Negative Reviews |
|---|---|
| “Dover’s equipment reliability is top-notch.” | “Customer service response times are slow.” |
| “Impressed by the durability of their machinery.” | “Spare parts availability can be inconsistent.” |
| “Strong performance in industrial applications.” | “Pricing feels higher compared to competitors.” |
Overall, consumers praise Dover for robust, durable products, reinforcing its operational moat. However, service delays and pricing concerns recur, signaling areas for improvement in customer experience and cost competitiveness.
Risk Analysis
Below is a summary table of key risks facing Dover Corporation in 2026, highlighting their likelihood and potential impact:
| Category | Description | Probability | Impact |
|---|---|---|---|
| Market Valuation Risk | High price-to-book ratio (3.62) may signal overvaluation, increasing downside risk | Medium | Medium |
| Debt Management Risk | Moderate debt-to-equity ratio (0.45) is favorable but warrants monitoring in rising rate cycles | Low | Medium |
| Industry Cyclicality | Exposure to industrial machinery sector makes performance sensitive to economic slowdowns | Medium | High |
| Operational Efficiency | Asset turnover (0.6) is neutral, suggesting potential pressure on profitability margins | Medium | Medium |
| Dividend Sustainability | Modest dividend yield (1.06%) with moderate payout may limit income stability | Low | Low |
| Financial Health Risk | Altman Z-Score of 5.8 places company in safe zone, indicating low bankruptcy risk | Low | Low |
Dover’s primary risks stem from its industrial cyclical exposure and valuation premium relative to book value. The machinery sector usually contracts sharply during economic downturns, which could pressure Dover’s returns. However, the company’s robust liquidity and strong Altman Z-Score mitigate bankruptcy concerns. Prudence dictates monitoring macroeconomic trends closely.
Should You Buy Dover Corporation?
Dover Corporation appears to be a moderately profitable firm with a slightly unfavorable moat, as declining ROIC suggests value erosion. Despite a manageable leverage profile, some valuation metrics appear weak. Overall, the company’s rating could be seen as a solid B.
Strength & Efficiency Pillars
Dover Corporation maintains solid operational efficiency with a net margin of 13.52% and a return on equity of 14.77%. Its ROIC stands at 9.45%, slightly above the WACC of 9.08%, indicating the company is a modest value creator. Favorable interest coverage at 13.52 and a strong current ratio of 1.79 reinforce its ability to meet short-term obligations. These metrics suggest operational resilience despite a slight decline in profitability trends.
Weaknesses and Drawbacks
Dover faces valuation pressures with a price-to-book ratio of 3.62, which is unfavorable and implies a premium valuation relative to book value. While the P/E ratio of 24.49 is neutral, it still reflects market expectations that may limit upside. The company’s moderate debt-to-equity ratio of 0.45 is favorable, yet the overall trend shows declining ROIC, which signals deteriorating profitability. Investors should watch for margin compression and efficiency setbacks.
Our Final Verdict about Dover Corporation
The company’s profile may appear attractive for long-term exposure given its safe Altman Z-Score of 5.80 and bullish stock trend. Despite some valuation concerns and a slightly declining ROIC, recent strong buyer dominance and accelerating momentum could support further gains. However, the moderate Piotroski score of 6 suggests caution, and investors might prefer a wait-and-see approach for clearer fundamental improvements.
Disclaimer: This content is for informational purposes only and does not constitute financial, investment, or other professional advice. Investing in financial markets involves a significant risk of loss, and past performance is not indicative of future results.
Additional Resources
- Dover Corporation $DOV Shares Purchased by Varma Mutual Pension Insurance Co – MarketBeat (Feb 13, 2026)
- Are Wall Street Analysts Predicting Dover Stock Will Climb or Sink? – Yahoo Finance (Feb 13, 2026)
- Dover Declares Regular Quarterly Cash Dividend – PR Newswire (Feb 12, 2026)
- Dover sets March 13 payout: 52 cents a share for holders – Stock Titan (Feb 12, 2026)
- Dover Corporation (NYSE:DOV) Plans Quarterly Dividend of $0.52 – MarketBeat (Feb 13, 2026)
For more information about Dover Corporation, please visit the official website: dovercorporation.com