Home > Analyses > Technology > Domo, Inc.
Domo, Inc. transforms how businesses harness data by seamlessly connecting leaders and frontline employees to real-time insights. Its cloud-based platform stands out in the software application sector, empowering companies to manage operations directly from smartphones. Known for innovation and user-centric design, Domo shapes decision-making across diverse industries. As the company navigates market pressures and evolving tech demands, I examine whether its fundamentals still justify its valuation and growth prospects.

Table of contents
Business Model & Company Overview
Domo, Inc., founded in 2010 and headquartered in American Fork, Utah, commands a leading position in the Software – Application sector. Its cloud-based business intelligence platform integrates data, people, and systems across organizations—from CEOs to frontline employees. This digital ecosystem delivers real-time insights accessible on smartphones, enabling streamlined decision-making and operational agility.
The company monetizes through a blend of recurring software subscriptions and platform services, targeting clients in the United States, Japan, and other international markets. This diversified global footprint balances growth opportunities across the Americas, Europe, and Asia. Domo’s competitive advantage lies in its seamless connectivity that transforms data into actionable intelligence, securing its role as a pivotal force shaping the future of enterprise analytics.
Financial Performance & Fundamental Metrics
I analyze Domo, Inc.’s income statement, key financial ratios, and dividend payout policy to assess its operational efficiency and shareholder value creation.
Income Statement
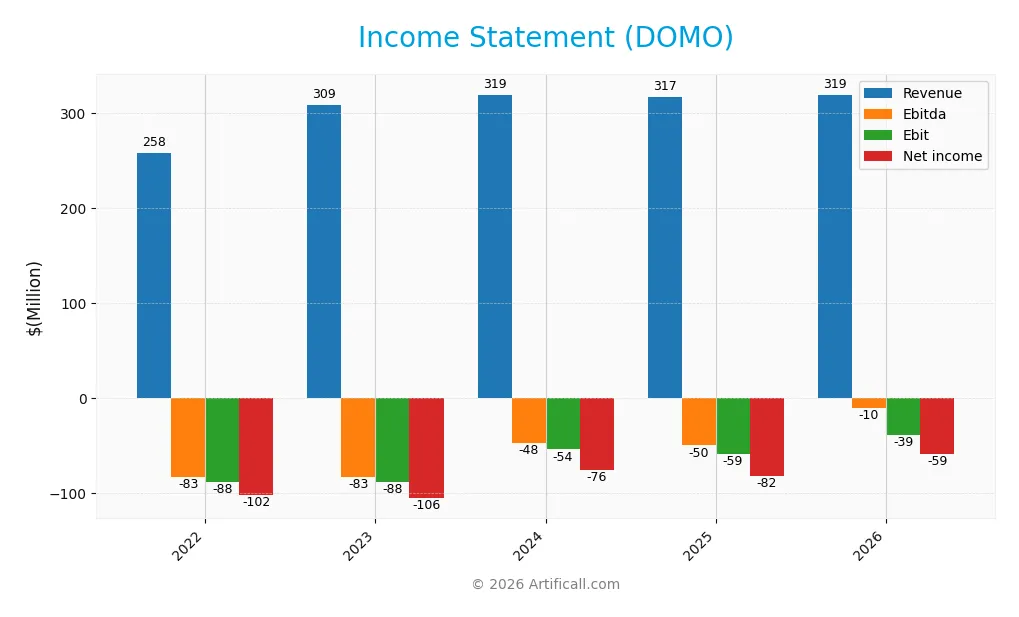
The table below summarizes Domo, Inc.’s key income statement figures for fiscal years 2022 through 2026, reflecting its revenue, profitability, and earnings per share trends.
| 2022 | 2023 | 2024 | 2025 | 2026 | |
|---|---|---|---|---|---|
| Revenue | 258M | 309M | 319M | 317M | 319M |
| Cost of Revenue | 67M | 73M | 75M | 81M | 80M |
| Operating Expenses | 279M | 324M | 298M | 295M | 278M |
| Gross Profit | 191M | 236M | 244M | 236M | 239M |
| EBITDA | -83M | -83M | -48M | -50M | -10M |
| EBIT | -88M | -88M | -54M | -59M | -39M |
| Interest Expense | 14M | 15M | 0 | 20M | 0 |
| Net Income | -102M | -106M | -76M | -82M | -59M |
| EPS | -3.19 | -3.10 | -2.10 | -2.13 | -1.45 |
| Filing Date | 2022-03-23 | 2023-03-27 | 2024-03-28 | 2025-04-04 | 2026-03-10 |
Income Statement Evolution
Domo, Inc. has shown steady revenue growth over 2022-2026, rising 23.6%. Gross profit remained stable, reflecting a favorable gross margin near 75%. Despite slight revenue growth slowdown last year (0.57%), net income improved significantly, with net margin rising nearly 53% over the period. Operating expenses grew moderately, supporting a 34% EBIT increase.
Is the Income Statement Favorable?
In 2026, revenue reached $319M with gross profit of $239M, maintaining strong margin control. However, Domo posted a net loss of $59M, though this was a marked improvement from prior years. EBIT margin remains negative at -12.3%, indicating ongoing operational challenges. Interest expense is negligible, supporting financial stability. Overall, fundamentals appear generally favorable given margin improvements and profit trajectory.
Financial Ratios
The following table presents key financial ratios for Domo, Inc. over the fiscal years 2022 to 2026, reflecting profitability, liquidity, leverage, and market valuation metrics:
| Ratios | 2022 | 2023 | 2024 | 2025 | 2026 |
|---|---|---|---|---|---|
| Net Margin | -39.6% | -34.2% | -23.7% | -25.8% | -18.6% |
| ROE | 81.1% | 72.1% | 49.2% | 46.2% | 31.9% |
| ROIC | -7.7% | 56.1% | 7.5% | 1.9% | 1.4% |
| P/E | -14.7 | -5.0 | -5.2 | -4.0 | -4.1 |
| P/B | -11.9 | -3.6 | -2.6 | -1.8 | -1.3 |
| Current Ratio | 0.73 | 0.68 | 0.58 | 0.56 | 0.57 |
| Quick Ratio | 0.73 | 0.68 | 0.58 | 0.56 | 0.57 |
| D/E | -0.99 | -0.88 | -0.84 | -0.76 | -0.75 |
| Debt-to-Assets | 50.8% | 53.2% | 57.4% | 63.2% | 59.3% |
| Interest Coverage | -6.3 | -5.7 | 0 | -3.0 | 0 |
| Asset Turnover | 1.05 | 1.27 | 1.41 | 1.48 | 1.35 |
| Fixed Asset Turnover | 7.6 | 8.4 | 8.2 | 8.2 | 8.0 |
| Dividend Yield | 0% | 0% | 0% | 0% | 0% |
Evolution of Financial Ratios
Return on Equity (ROE) showed improvement, rising to 31.9% in 2026 after fluctuations. The Current Ratio remained below 1, around 0.57, indicating persistent liquidity constraints. Debt-to-Equity Ratio stayed negative but favorable at -0.75, reflecting complex capital structure dynamics. Profitability margins remained negative but showed some reduction in net loss severity.
Are the Financial Ratios Favorable?
In 2026, profitability ratios remain unfavorable due to a negative net margin of -18.6%. Liquidity ratios such as the Current and Quick Ratios are weak, both below 1. Asset efficiency is strong, with asset turnover above 1.3 and fixed asset turnover near 8. Leverage ratios present mixed signals; debt-to-equity is favorable, yet debt-to-assets is high at 59%. Overall, ratios appear slightly favorable but warrant caution.
Shareholder Return Policy
Domo, Inc. does not pay dividends, reflecting its sustained net losses and reinvestment focus. The company prioritizes growth and R&D, with no dividend payout or buyback programs reported, indicating a strategy centered on long-term value creation rather than immediate shareholder returns.
This approach aligns with typical high-growth tech firms that reinvest cash flow to build competitive moats. However, persistent negative free cash flow and operating margins suggest risks to sustainability, requiring close monitoring of capital allocation effectiveness for future shareholder value support.
Score analysis
The following radar chart illustrates Domo, Inc.’s valuation and financial performance scores across key metrics:
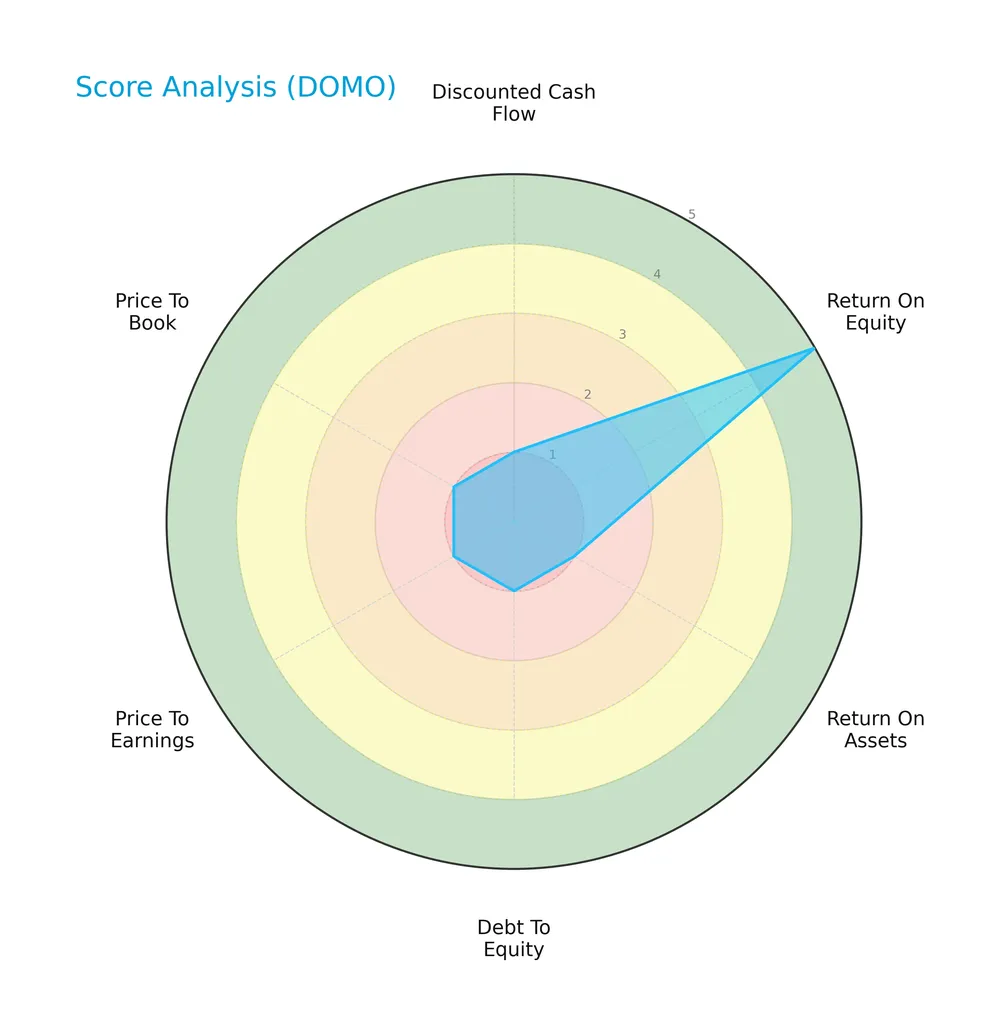
Domo shows a very favorable return on equity score of 5, indicating strong shareholder returns. However, discounted cash flow, return on assets, debt to equity, price to earnings, and price to book scores all rate very unfavorable at 1, signaling concerns in cash flow, efficiency, leverage, and valuation metrics.
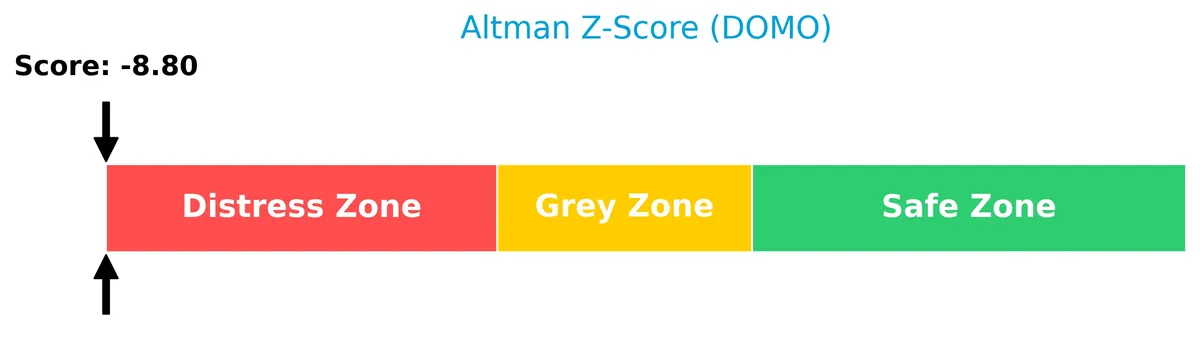
Analysis of the company’s bankruptcy risk
Domo’s Altman Z-Score places it deep in the distress zone, indicating a high probability of financial distress and bankruptcy risk:
Is the company in good financial health?
The Piotroski Score diagram below assesses Domo’s financial strength and operational efficiency:

With a Piotroski Score of 4, Domo ranks as average in financial health, showing moderate strengths but also room for improvement in profitability and balance sheet metrics.
Competitive Landscape & Sector Positioning
This analysis examines Domo, Inc.’s strategic positioning within the software application sector. We will explore its revenue by segment, key products, main competitors, and competitive advantages. I will assess whether Domo holds a sustainable competitive edge over its rivals.
Strategic Positioning
Domo, Inc. concentrates its revenue heavily in subscription services, exceeding $286M in 2025, complemented by professional services at $31M. Geographically, it focuses on the U.S. market with $252M revenue, while maintaining international presence primarily in Japan and other non-U.S. regions totaling $65M.
Revenue by Segment
This pie chart illustrates Domo, Inc.’s revenue breakdown by product segment for fiscal year 2025, highlighting the relative contributions of Subscription and Professional Services and Other.
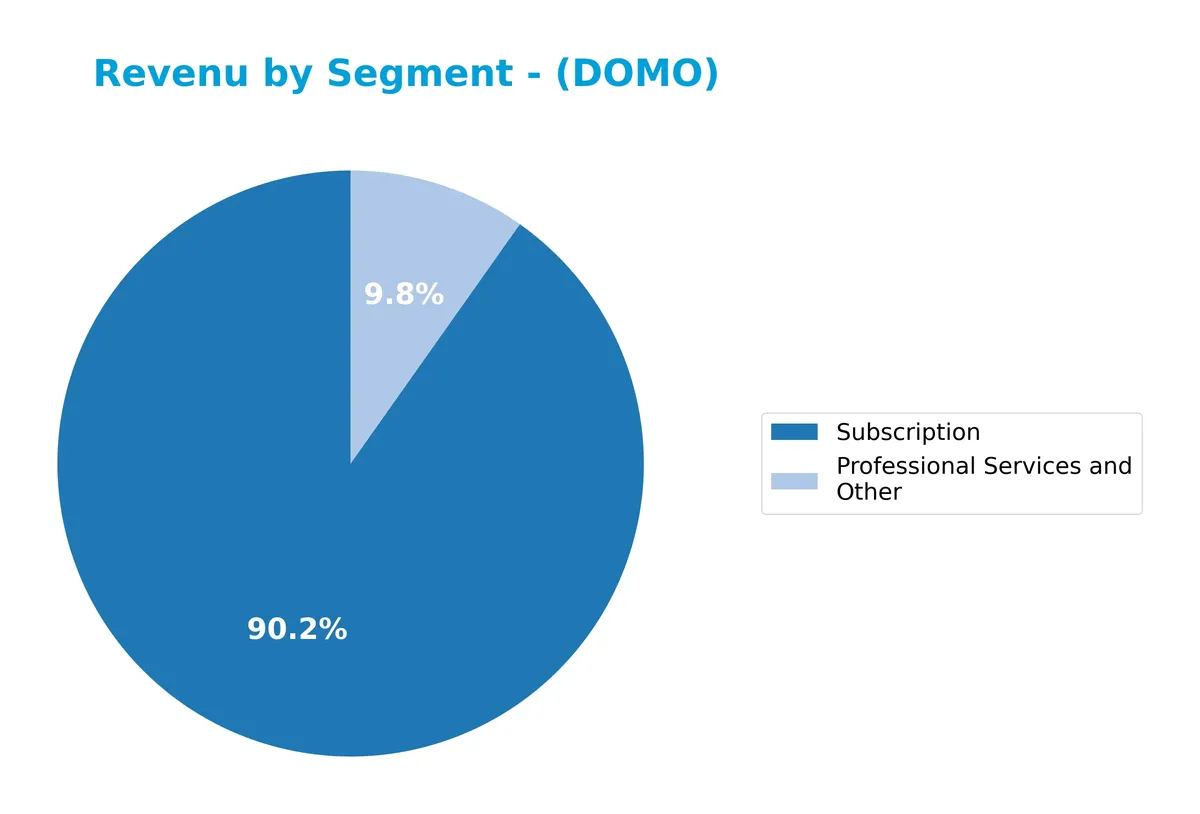
Subscription revenue dominates Domo’s business with $286M in 2025, showing steady growth from $117M in 2019. Professional Services and Other remain a smaller, relatively stable segment at $31M, down slightly from prior years. The trend indicates increasing reliance on recurring subscription income, signaling a maturing, scalable model but also concentration risk in this core segment.
Key Products & Brands
Domo, Inc. generates revenue primarily from its cloud-based platform subscriptions and related professional services:
| Product | Description |
|---|---|
| Subscription | Cloud-based business intelligence platform access, delivering real-time data and insights. |
| Professional Services and Other | Consulting, implementation, and support services complementing the subscription platform. |
Domo’s core revenue stream is subscription-based, reflecting steady growth in platform adoption. Professional services represent a smaller, yet stable, complementary revenue source.
Main Competitors
Domo, Inc. faces 33 competitors in the Technology sector, with the table below showing the top 10 leaders by market capitalization:
| Competitor | Market Cap. |
|---|---|
| Salesforce, Inc. | 242.5B |
| Shopify Inc. | 209.6B |
| AppLovin Corporation | 209.0B |
| Intuit Inc. | 175.2B |
| Uber Technologies, Inc. | 172.2B |
| ServiceNow, Inc. | 153.0B |
| Cadence Design Systems, Inc. | 84.5B |
| Snowflake Inc. | 73.4B |
| Autodesk, Inc. | 61.2B |
| Workday, Inc. | 54.9B |
Domo, Inc. ranks 32nd among 33 competitors, with a market cap just 0.05% of Salesforce’s. It sits well below both the average market cap of the top 10 (143.6B) and the sector median (18.8B). Notably, Domo’s market cap is 829% smaller than the next closest competitor above it, signaling a substantial gap.
Comparisons with competitors
Check out how we compare the company to its competitors:
Does DOMO have a competitive advantage?
Domo, Inc. demonstrates a clear competitive advantage, as its ROIC exceeds WACC by over 130%, indicating strong value creation. The company shows a growing ROIC trend, signaling increasing profitability and efficient capital use.
Looking ahead, Domo operates a cloud-based business intelligence platform in the U.S., Japan, and internationally. Expansion into new markets and continuous innovation in real-time data access could further strengthen its position in the software application industry.
SWOT Analysis
This analysis highlights Domo, Inc.’s internal strengths and weaknesses alongside external opportunities and threats that shape its strategic outlook.
Strengths
- very favorable moat with growing ROIC
- strong asset turnover ratios
- improving net margin growth
Weaknesses
- weak liquidity with low current and quick ratios
- high debt to assets ratio
- negative net margin
Opportunities
- expanding international sales, especially in Japan
- growing demand for cloud-based BI platforms
- potential to leverage mobile data management
Threats
- intense competition in software sector
- high beta indicating stock volatility
- risk of financial distress per Altman Z-score
Domo’s strong moat and improving profitability underpin its value creation. However, liquidity issues and leverage pose risks. Strategic focus on international growth and innovation is critical to mitigate competitive and financial threats.
Stock Price Action Analysis
The weekly stock chart displays Domo, Inc.’s price movement over the past 12 months, highlighting key highs and lows:
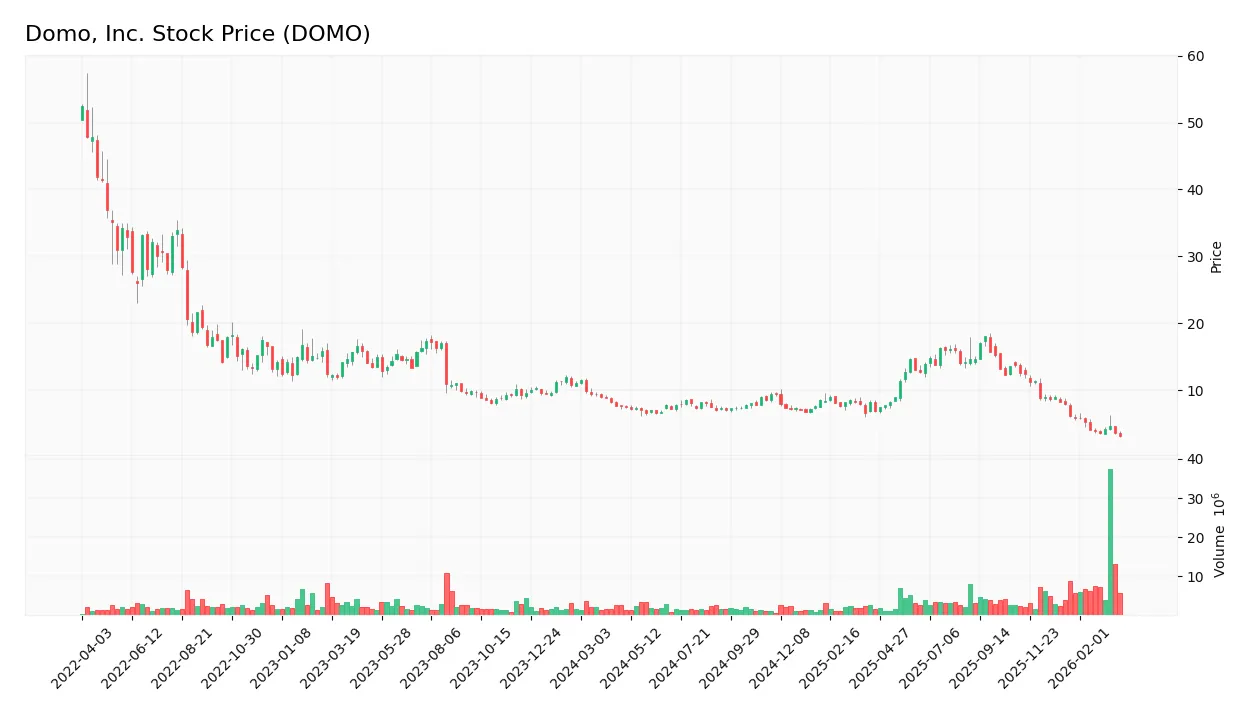
Trend Analysis
Over the past 12 months, Domo’s stock price fell by 58.39%, confirming a bearish trend. The decline shows deceleration, with a standard deviation of 3.4. The stock reached a high of 18.06 and a low of 3.1, reflecting significant volatility and weakening downward momentum.
Volume Analysis
Trading volume increased overall, with sellers dominating 53% of shares traded in the last three months. Buyer volume represented 42.19%, indicating slightly seller-driven activity. This suggests cautious investor sentiment and moderate market participation amid persistent selling pressure.
Target Prices
Analysts set a clear target consensus for Domo, Inc., indicating moderate upside potential.
| Target Low | Target High | Consensus |
|---|---|---|
| 10 | 13 | 11.5 |
The target range from 10 to 13 shows cautious optimism. The consensus at 11.5 suggests steady growth expectations.

Don’t Let Luck Decide Your Entry Point
Optimize your entry points with our advanced ProRealTime indicators. You’ll get efficient buy signals with precise price targets for maximum performance. Start outperforming now!
Analyst & Consumer Opinions
This section examines analyst ratings and consumer feedback to provide a balanced view of Domo, Inc.’s market perception.
Stock Grades
Here are the latest verified stock grades for Domo, Inc. from respected financial firms:
| Grading Company | Action | New Grade | Date |
|---|---|---|---|
| Lake Street | Maintain | Hold | 2026-03-11 |
| Cantor Fitzgerald | Maintain | Overweight | 2026-03-11 |
| DA Davidson | Maintain | Neutral | 2026-03-11 |
| TD Cowen | Maintain | Buy | 2026-02-20 |
| Citizens | Downgrade | Market Underperform | 2026-02-13 |
| Lake Street | Maintain | Hold | 2025-12-05 |
| DA Davidson | Maintain | Neutral | 2025-12-05 |
| TD Cowen | Maintain | Buy | 2025-12-05 |
| DA Davidson | Maintain | Neutral | 2025-12-01 |
| JMP Securities | Maintain | Market Outperform | 2025-09-10 |
The consensus shows a majority leaning toward buy ratings, balanced by a few neutral and hold recommendations. Notably, Citizens downgraded recently, signaling some caution amid generally positive sentiment.
Consumer Opinions
Consumers express a mix of enthusiasm and frustration toward Domo, Inc., reflecting its innovative promise alongside execution challenges.
| Positive Reviews | Negative Reviews |
|---|---|
| Intuitive dashboard enhances data visualization. | Occasional lags in real-time data updates. |
| Strong integration with multiple data sources. | Pricing feels steep for small businesses. |
| Responsive customer support improves user experience. | Learning curve can be steep for novice users. |
| Customizable reports meet diverse business needs. | Mobile app lacks some desktop functionalities. |
Overall, users praise Domo’s powerful visualization and integration capabilities. However, steep pricing and a challenging user interface limit adoption among smaller firms. The company must address these pain points to broaden its market appeal.
Risk Analysis
Below is a summary of key risks facing Domo, Inc., categorized by type, along with their estimated probabilities and potential impacts:
| Category | Description | Probability | Impact |
|---|---|---|---|
| Financial Health | Distress-level Altman Z-Score signals high bankruptcy risk | High | Severe |
| Liquidity | Current and quick ratios at 0.57 indicate weak short-term liquidity | High | Moderate |
| Leverage | Debt-to-assets ratio at 59.3% raises solvency concerns | High | High |
| Profitability | Negative net margin (-18.6%) despite high ROIC suggests operational issues | High | Moderate |
| Market Volatility | Beta of 1.75 shows above-average stock price sensitivity | Medium | Moderate |
| Dividend Policy | Zero dividend yield limits income potential for risk-averse investors | Medium | Low |
| Valuation | Negative P/E and P/B ratios reflect market skepticism and valuation risk | High | Moderate |
Domo’s most critical risks stem from severe financial distress signals and weak liquidity. The Altman Z-Score well below 1.8 places it firmly in the distress zone, foreshadowing potential solvency challenges. The company’s high debt load amplifies this risk. Despite a strong ROIC, negative margins and poor cash flow metrics highlight operational inefficiencies. Investors must weigh these red flags against the company’s technological position and market potential.
Should You Buy Domo, Inc.?
Domo, Inc. appears to be creating value with a very favorable and growing moat reflected in strong ROIC versus WACC. While operational efficiency struggles amid negative returns and weak liquidity, its leverage profile raises caution. The overall rating stands at C, suggesting a mixed financial health profile.
Strength & Efficiency Pillars
Domo, Inc. reveals strong operational efficiency with a gross margin of 74.99%, underscoring robust product profitability. Its return on invested capital (ROIC) stands at an impressive 138.55%, substantially exceeding the weighted average cost of capital (WACC) at 8%, marking the company as a clear value creator. Return on equity (ROE) is favorable at 31.89%, reflecting effective management of shareholder funds. These metrics suggest Domo sustains a competitive advantage through growing profitability despite some margin pressures.
Weaknesses and Drawbacks
Domo is currently in financial distress, as highlighted by a deeply negative Altman Z-Score of -8.80, signaling a high bankruptcy risk. The firm’s liquidity is weak, with a current ratio of 0.57, raising red flags about short-term solvency. Leverage is also a concern, with debt-to-assets at 59.29%, exacerbating financial vulnerability. Market sentiment is bearish, evidenced by a 58.4% price decline and seller dominance at 57.8% recently, indicating persistent selling pressure and valuation challenges.
Our Final Verdict about Domo, Inc.
Despite operational strengths and clear value creation, Domo’s severe solvency risk, as indicated by its Altman Z-Score in the distress zone, renders its investment profile highly speculative. The combination of weak liquidity and heavy debt elevates the risk of capital loss. Investors might consider Domo too risky for conservative portfolios, awaiting signs of financial stabilization before contemplating exposure.
Disclaimer: This content is for informational purposes only and does not constitute financial, investment, or other professional advice. Investing in financial markets involves a significant risk of loss, and past performance is not indicative of future results.
Additional Resources
- DOMO Earning Date, Earning Analysis and Earning Prediction – intellectia.ai (Mar 28, 2026)
- Domo adds a tool that lets admins see exactly what each user sees – Stock Titan (Mar 26, 2026)
- Why analysts remain split on Domo, Inc. (DOMO) – MSN (Mar 24, 2026)
- Here’s What Nine Entertainment’s Nod of Approval Means for Domo Inc (DOMO) – Yahoo Finance (Mar 24, 2026)
- DA Davidson cuts Domo stock price target on consumption pricing concerns – Investing.com (Mar 27, 2026)
For more information about Domo, Inc., please visit the official website: domo.com