Home > Analyses > Consumer Cyclical > Domino’s Pizza, Inc.
Domino’s Pizza transforms how millions satisfy hunger with fast, reliable delivery and a tech-driven ordering experience. It dominates the quick-service pizza market through relentless innovation and operational efficiency. Its global footprint spans nearly 19,000 stores, blending company-owned and franchised locations to fuel growth. As competition intensifies and consumer tastes evolve, I ask: can Domino’s fundamentals sustain its premium valuation and robust expansion trajectory?

Table of contents
Business Model & Company Overview
Domino’s Pizza, Inc., founded in 1960 and headquartered in Ann Arbor, Michigan, commands a leading position in the global restaurant industry. Operating approximately 18,800 stores across 90 markets, it delivers a cohesive food ecosystem anchored by its signature pizzas, complemented by oven-baked sandwiches, pasta, and sides. This integrated product suite drives brand loyalty and operational efficiency across company-owned and franchised outlets.
The company’s revenue engine balances direct retail sales through U.S. stores with a robust international franchise network and a strategic supply chain segment. This model ensures consistent cash flow and scalability across the Americas, Europe, and Asia. Domino’s sustainable competitive advantage lies in its efficient delivery infrastructure and global footprint, securing its role as a pivotal force shaping the quick-service restaurant sector’s future.
Financial Performance & Fundamental Metrics
I analyze Domino’s Pizza, Inc.’s income statement, key financial ratios, and dividend payout policy to assess its operational efficiency and shareholder returns.
Income Statement
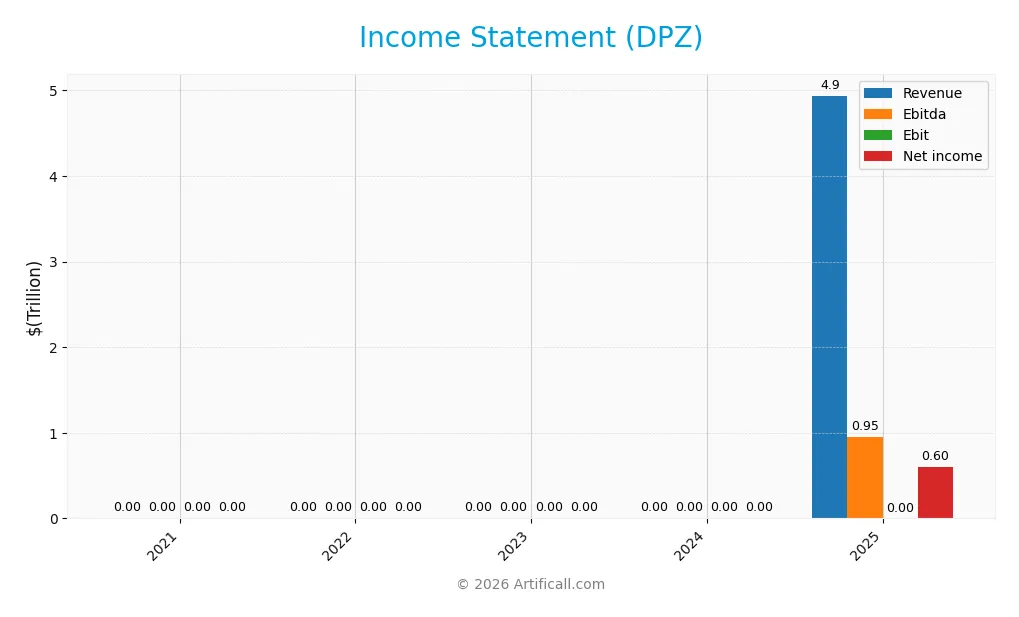
The table below summarizes Domino’s Pizza, Inc.’s key income statement figures for fiscal years 2021 to 2025, highlighting revenue, expenses, and profitability.
| 2021 | 2022 | 2023 | 2024 | 2025 | |
|---|---|---|---|---|---|
| Revenue | 4.36B | 4.54B | 4.48B | 4.71B | 4.94T |
| Cost of Revenue | 2.67B | 2.89B | 2.75B | 2.86B | 2.97T |
| Operating Expenses | 908M | 881M | 906M | 970M | 464B |
| Gross Profit | 1.69B | 1.65B | 1.73B | 1.85B | 1.97T |
| EBITDA | 890M | 851M | 930M | 1.01B | 954B |
| EBIT | 818M | 771M | 849M | 918M | 0 |
| Interest Expense | 191M | 198M | 196M | 196M | -181B |
| Net Income | 510M | 452M | 519M | 584M | 602B |
| EPS | 13.72 | 12.66 | 14.80 | 16.82 | 17.69 |
| Filing Date | 2022-03-01 | 2023-02-23 | 2024-02-26 | 2025-02-24 | 2026-02-23 |
Income Statement Evolution
From 2021 to 2025, Domino’s Pizza, Inc. experienced robust revenue growth, surging by over 113,000%. Net income followed a similar trajectory, increasing by 117,773%. Gross margins remained favorable near 40%, reflecting stable cost control. However, EBIT margin declined to zero in 2025, signaling challenges in operating profitability despite expanding top-line and bottom-line figures.
Is the Income Statement Favorable?
The 2025 income statement shows strong fundamentals with revenue at $4.94T and net income at $602B. Gross margin is solid at 39.95%, supporting profitability. Interest expenses are well managed, enhancing net margin of 12.18%. Yet, the zero EBIT margin and a 1.87% dip in net margin growth flag operational efficiency issues. Overall, the statement leans favorable with some caution warranted.
Financial Ratios
The following table summarizes key financial ratios for Domino’s Pizza, Inc. over the past five fiscal years:
| Ratios | 2021 | 2022 | 2023 | 2024 | 2025 |
|---|---|---|---|---|---|
| Net Margin | 12% | 10% | 12% | 12% | 12% |
| ROE | -12% | -11% | -13% | -15% | -179% |
| ROIC | 54% | 52% | 53% | 54% | -17% |
| P/E | 40.3 | 27.4 | 27.9 | 25.0 | 0.02 |
| P/B | -4.9 | -3.0 | -3.6 | -3.7 | -4.3 |
| Current Ratio | 1.46 | 1.47 | 1.49 | 0.56 | 1.65 |
| Quick Ratio | 1.34 | 1.32 | 1.34 | 0.52 | 1.65 |
| D/E | -1.26 | -1.25 | -1.28 | -1.31 | -71.0 |
| Debt-to-Assets | 3.2% | 3.3% | 3.1% | 3.0% | 14% |
| Interest Coverage | 4.08 | 3.87 | 4.17 | 4.49 | -0.01 |
| Asset Turnover | 2.61 | 2.83 | 2.67 | 2.71 | 2.88 |
| Fixed Asset Turnover | 8.15 | 8.70 | 8.75 | 9.20 | 9.09 |
| Dividend Yield | 0.68% | 1.27% | 1.17% | 1.44% | 16.4% |
Evolution of Financial Ratios
Return on Equity (ROE) showed a dramatic decline, turning sharply negative in 2025. The Current Ratio improved steadily, reaching 1.65 in 2025, indicating better short-term liquidity. The Debt-to-Equity Ratio remained negative, reflecting an unusual capital structure but showed favorable status. Profitability margins remained relatively stable with a slight improvement in net profit margin.
Are the Financial Ratios Fovorable?
In 2025, profitability is mixed: net margin is favorable at 12.18%, but ROE and ROIC are heavily negative, signaling poor capital efficiency. Liquidity ratios, including current and quick ratios at 1.65, are favorable, suggesting adequate short-term financial health. Leverage appears favorable with low debt-to-assets at 13.84%. Market valuation metrics like P/E and P/B ratios are favorable, but interest coverage is unfavorable. Overall, 71% of ratios are favorable, indicating a generally positive but cautious outlook.
Shareholder Return Policy
Domino’s Pizza maintains a consistent dividend payout ratio around 35-40%, with dividends per share rising steadily to 6.9K in 2025. The dividend yield surged notably to 16.4%, supported by free cash flow coverage and moderate capital expenditures.
The company also engages in share buybacks alongside dividends, balancing cash returns and reinvestment. This distribution approach appears sustainable, aligning well with long-term shareholder value creation given its positive net margins and cash flow metrics.
Score analysis
The following radar chart displays Domino’s Pizza, Inc.’s key financial scores to evaluate its investment profile:
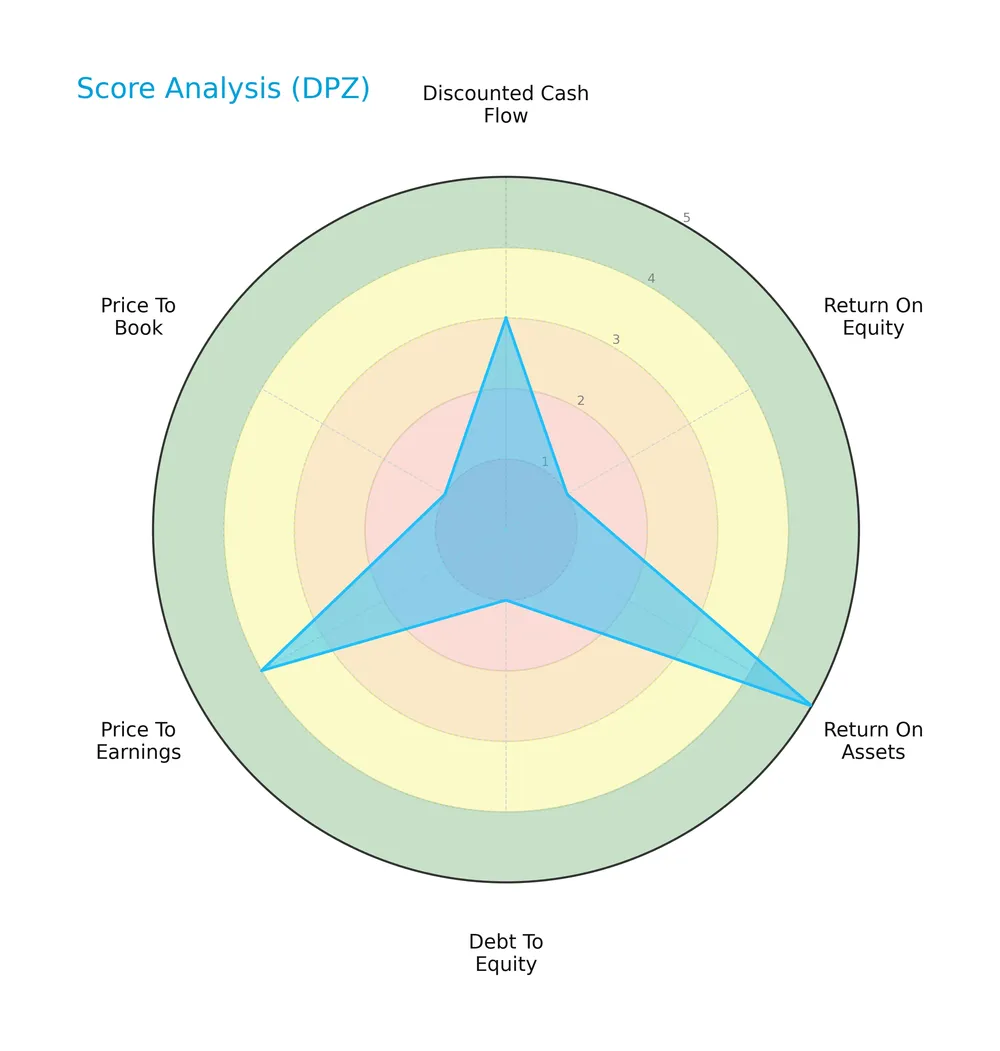
The discounted cash flow and overall scores show moderate strength. Return on assets scores very favorably at 5, while return on equity, debt to equity, and price to book scores are very unfavorable. Price to earnings is favorable, indicating mixed fundamentals.
Analysis of the company’s bankruptcy risk
Domino’s Pizza’s Altman Z-Score of 3.69 places it firmly in the safe zone, indicating low bankruptcy risk and strong financial stability:

Is the company in good financial health?
The Piotroski Score diagram illustrates Domino’s Pizza’s financial strength based on nine key criteria:

With a Piotroski Score of 7, the company demonstrates strong financial health, reflecting solid profitability, liquidity, and operational efficiency. This suggests a fundamentally sound business.
Competitive Landscape & Sector Positioning
This section examines Domino’s Pizza, Inc.’s strategic positioning, revenue segments, product offerings, and main competitors. I will assess whether Domino’s holds a competitive advantage over its peers in the restaurant sector.
Strategic Positioning
Domino’s Pizza has a concentrated product portfolio centered on pizza and complementary items. Geographically, it combines strong domestic presence with international franchising across 90 markets, generating dominant revenue from U.S. stores (1.6B in 2025) and significant supply chain operations (3B in 2025).
Revenue by Segment
The pie chart illustrates Domino’s Pizza, Inc. revenue breakdown by segment for fiscal year 2025, highlighting the contributions of Domestic Stores, Supply Chain, and International Franchise.
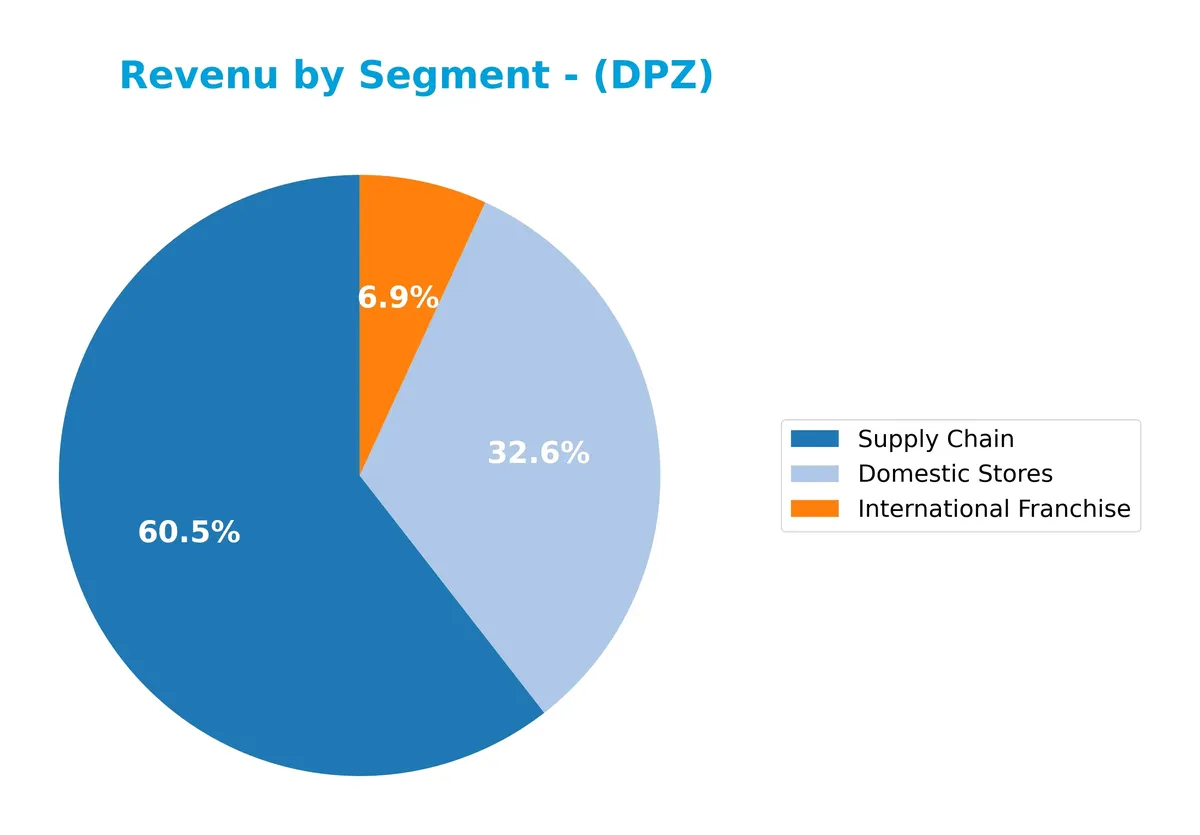
In 2025, Supply Chain leads with $3B, followed by Domestic Stores at $1.6B and International Franchise near $339M. Supply Chain’s steady rise signals strong operational leverage. Domestic Stores show consistent growth, while International Franchise expands moderately. The company’s revenue mix remains balanced but heavily dependent on Supply Chain, posing potential concentration risk if supply costs fluctuate.
Key Products & Brands
The table below outlines Domino’s core products and brand segments with brief descriptions:
| Product | Description |
|---|---|
| Domino’s Pizza | Pizza offerings delivered through company-owned and franchised stores across 90 markets. |
| Oven-Baked Sandwiches | A variety of hot, oven-baked sandwich options complementing the main pizza menu. |
| Pasta | Pasta dishes offered as part of the broader food selection. |
| Boneless Chicken & Wings | Chicken products including boneless chicken and traditional wings, served as sides or meals. |
| Bread & Dips | Side items including breadsticks and dipping sauces to augment the main meals. |
| Desserts | Sweet treats available to complete the customer meal experience. |
| Soft Drinks | Beverage options accompanying the food offerings. |
| U.S. Stores Segment | Domestic company-owned and franchised stores generating over $1.6B in revenue in FY 2025. |
| International Franchise Segment | Franchise operations outside the U.S., producing $339M revenue in FY 2025. |
| Supply Chain Segment | Distribution and supply chain services supporting stores, accounting for $3.0B revenue in FY 2025. |
Domino’s product lineup centers on pizza and complementary items, supported by a robust supply chain and a strong franchise model domestically and internationally. This diversified structure underpins its revenue streams and market reach.
Main Competitors
There are 6 main competitors in the sector; the table below lists the top 6 leaders by market capitalization:
| Competitor | Market Cap. |
|---|---|
| McDonald’s Corporation | 217B |
| Starbucks Corporation | 95.5B |
| Chipotle Mexican Grill, Inc. | 50.6B |
| Yum! Brands, Inc. | 41.8B |
| Darden Restaurants, Inc. | 21.8B |
| Domino’s Pizza, Inc. | 14.4B |
Domino’s Pizza ranks 6th among its competitors, holding just 6.24% of McDonald’s market cap. It stands below both the average market cap of the top 10 (73.5B) and the sector median (46.2B). The company trails Darden Restaurants by 61.44%, indicating a substantial gap with its closest rival.
Comparisons with competitors
Check out how we compare the company to its competitors:
Does Domino’s Pizza have a competitive advantage?
Domino’s Pizza does not currently show a competitive advantage, as its ROIC significantly lags behind its WACC, indicating value destruction and declining profitability. Despite favorable gross and net margins, the company’s returns on invested capital have trended sharply downward over the 2021-2025 period.
Looking ahead, Domino’s operates nearly 18,800 stores across 90 markets, with opportunities to expand its product range and international footprint. New menu items and global franchise growth could offer revenue potential, but the company must address its capital efficiency to sustain long-term value creation.
SWOT Analysis
This analysis highlights Domino’s Pizza, Inc.’s strategic position by examining internal and external factors.
Strengths
- strong brand recognition
- global footprint with 18,800 stores
- favorable net margin of 12.18%
Weaknesses
- declining ROIC indicates value destruction
- unfavorable EBIT margin
- weak return on equity (-17910%)
Opportunities
- expanding international franchise revenue
- growth in delivery and digital ordering
- innovation in menu offerings
Threats
- intense competition in fast food sector
- rising input costs
- economic sensitivity affecting consumer spending
Domino’s enjoys solid brand power and profitability, but its declining ROIC signals caution. The company must leverage global expansion and innovation while managing competitive and cost pressures carefully.
Stock Price Action Analysis
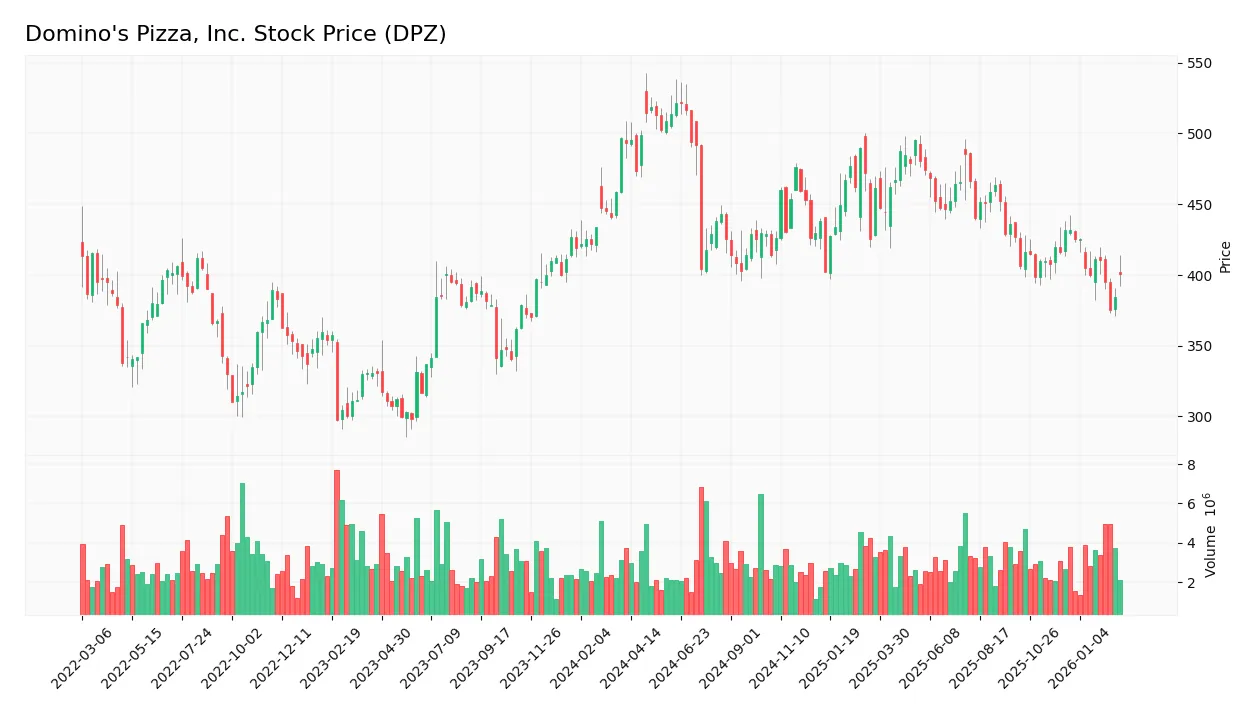
The weekly stock chart below illustrates Domino’s Pizza, Inc. (DPZ) price movement over the past 12 months, highlighting key trend shifts and volatility patterns:
Trend Analysis
Over the past year, DPZ’s stock price declined by 18.82%, indicating a bearish trend. The price trend decelerated despite a high volatility level (34.92 std. dev.). The stock peaked at 521.83 and bottomed at 375.5. Recent three-month data shows a further 7.27% drop with increased negative slope (-4.34), confirming continued bearishness.
Volume Analysis
Trading volume over the last three months increased but is seller-driven, with sellers accounting for 68.58% of activity. Buyer dominance dropped to 31.42%, signaling weaker buying interest and heightened selling pressure. This suggests cautious or negative investor sentiment and elevated market participation by sellers.
Target Prices
Analysts present a confident target consensus for Domino’s Pizza, Inc., reflecting robust growth expectations.
| Target Low | Target High | Consensus |
|---|---|---|
| 370 | 540 | 473.33 |
The target range suggests optimistic upside potential, with a consensus price indicating strong market confidence in Domino’s future performance.

Don’t Let Luck Decide Your Entry Point
Optimize your entry points with our advanced ProRealTime indicators. You’ll get efficient buy signals with precise price targets for maximum performance. Start outperforming now!
Analyst & Consumer Opinions
This section examines Domino’s Pizza, Inc. (DPZ) through analyst ratings and consumer feedback to gauge market sentiment.
Stock Grades
Here are the latest verified stock grades for Domino’s Pizza, Inc. from leading analysts:
| Grading Company | Action | New Grade | Date |
|---|---|---|---|
| TD Cowen | Maintain | Hold | 2026-02-23 |
| BTIG | Maintain | Buy | 2026-02-19 |
| Citigroup | Maintain | Neutral | 2026-02-11 |
| Guggenheim | Maintain | Neutral | 2026-01-28 |
| Wells Fargo | Maintain | Equal Weight | 2026-01-22 |
| Morgan Stanley | Downgrade | Equal Weight | 2026-01-20 |
| Evercore ISI Group | Maintain | Outperform | 2026-01-08 |
| Barclays | Maintain | Underweight | 2026-01-07 |
| Stifel | Maintain | Buy | 2026-01-07 |
| TD Cowen | Downgrade | Hold | 2026-01-05 |
The consensus leans toward a “Buy” rating, though recent downgrades by TD Cowen and Morgan Stanley indicate some caution. Most analysts maintain neutral to positive stances, reflecting balanced sentiment.
Consumer Opinions
Domino’s Pizza, Inc. consistently earns strong consumer loyalty, reflecting its brand strength and operational focus.
| Positive Reviews | Negative Reviews |
|---|---|
| Fast delivery and accurate orders | Inconsistent pizza quality |
| User-friendly app with easy ordering | Occasional late deliveries |
| Good value for money | Limited menu variety in some locations |
| Friendly customer service | Packaging sometimes arrives damaged |
Consumers praise Domino’s for speed and convenience, reinforcing its competitive moat. However, quality inconsistency and delivery delays remain notable pain points. Addressing these could strengthen consumer trust further.
Risk Analysis
Below is a summary table detailing key risks facing Domino’s Pizza, Inc. in 2026:
| Category | Description | Probability | Impact |
|---|---|---|---|
| Profitability Risk | Negative ROE (-17910%) and negative ROIC (-16.92%) signal weak capital returns. | High | High |
| Leverage Risk | Very unfavorable debt-to-equity ratio and interest coverage near zero indicate financial strain. | Medium | High |
| Market Volatility | Beta of 1.15 exposes stock to above-average market swings. | Medium | Medium |
| Operational Risk | Supply chain or franchise disruptions could reduce revenues. | Low | Medium |
| Valuation Anomaly | Extremely low P/E (0.02) and negative P/B ratio suggest market skepticism or accounting distortions. | High | Medium |
I view Domino’s as financially stable in terms of bankruptcy risk, supported by an Altman Z-Score of 3.69 in the safe zone. However, the massive negative ROE and weak interest coverage flag serious challenges in generating shareholder value and servicing debt. These risks dominate given their potential to undermine long-term returns despite favorable liquidity and asset turnover. Investors should monitor capital allocation closely as the company navigates competitive pressures and operational complexities.
Should You Buy Domino’s Pizza, Inc.?
Domino’s appears to be a company with improving operational efficiency but a very unfavorable moat, as it is shedding value with declining ROIC versus WACC. Despite a manageable leverage profile and a safe Altman Z-score, the overall B- rating suggests moderate investment appeal.
Strength & Efficiency Pillars
Domino’s Pizza, Inc. delivers operational resilience with a solid net margin of 12.18% and a strong gross margin near 40%. Its weighted average cost of capital (WACC) stands at a low 3.35%, reflecting efficient capital costs. However, the return on invested capital (ROIC) is deeply negative at -16.92%, indicating value destruction rather than creation. Despite an impressive asset turnover of 2.88, the company’s declining profitability signals operational challenges ahead.
Weaknesses and Drawbacks
The company’s financial health is under pressure despite a safe Altman Z-Score of 3.69, comfortably above distress levels. ROE is severely negative at -17,910%, pointing to significant equity erosion. The price-to-book ratio is also unfavorable, suggesting market skepticism about asset value. Recent market behavior is seller-dominant with only 31.42% buyer volume, amplifying short-term headwinds. Interest coverage is negative, highlighting potential difficulties servicing debt despite a favorable debt-to-equity ratio.
Our Final Verdict about Domino’s Pizza, Inc.
Domino’s Pizza, Inc. might appear operationally stable but suffers from deteriorating profitability and severe equity returns. The safe Altman Z-Score offers a cushion, yet bearish price trends and seller dominance suggest caution. Despite long-term strength, recent market pressure and value destruction indicate a wait-and-see approach for a better entry point. Investors should weigh the risks before committing capital.
Disclaimer: This content is for informational purposes only and does not constitute financial, investment, or other professional advice. Investing in financial markets involves a significant risk of loss, and past performance is not indicative of future results.
Additional Resources
- Domino’s Pizza® Announces Fourth Quarter and Fiscal 2025 Financial Results – Domino’s Pizza (Feb 23, 2026)
- Decoding Domino’s Pizza Inc (DPZ): A Strategic SWOT Insight – GuruFocus (Feb 24, 2026)
- Cowen Maintains Hold on Domino’s Pizza, Inc. (DPZ) Feb 2026 – Meyka (Feb 23, 2026)
- Domino’s Pizza Hikes Its Dividend By 14.3% After Free Cash Flow Rises 29% – Value Buyers Love DPZ Stock – Barchart.com (Feb 23, 2026)
- Domino’s Pizza Stock Enjoys Post-Earnings Boost – Schaeffer’s Investment Research (Feb 23, 2026)
For more information about Domino’s Pizza, Inc., please visit the official website: dominos.com