Home > Analyses > Utilities > Dominion Energy, Inc.
Dominion Energy powers millions of homes and businesses across key U.S. regions, shaping daily life through reliable electricity and natural gas. As a dominant force in regulated electric and gas distribution, it boasts a vast infrastructure and a growing renewable energy portfolio. Known for steady dividends and operational resilience, Dominion blends tradition with innovation. The critical question now: does its current valuation reflect sustainable growth amid evolving energy markets?

Table of contents
Business Model & Company Overview
Dominion Energy, Inc., founded in 1983 and headquartered in Richmond, Virginia, commands a dominant position in the regulated electric and gas utilities sector. Its integrated ecosystem spans electricity generation, transmission, and distribution alongside natural gas operations. The company serves over 6.9M customers across Virginia, North Carolina, South Carolina, and multiple states for gas services, blending traditional energy assets with expanding renewable facilities.
The company’s revenue engine balances regulated electric and gas sales with long-term contracted renewable generation and gas transportation. Dominion Energy’s expansive infrastructure—30.2GW capacity, 10,700 miles of transmission lines, and nearly 96,000 miles of gas mains—anchors its strategic presence across the Americas. Its strong regulatory footprint and asset scale create a robust economic moat, positioning Dominion Energy as a key architect of the evolving U.S. energy landscape.
Financial Performance & Fundamental Metrics
I analyze Dominion Energy, Inc.’s income statement, key financial ratios, and dividend payout policy to assess its operational efficiency and shareholder value.
Income Statement
The following table summarizes Dominion Energy, Inc.’s key income statement figures for fiscal years 2021 through 2025, highlighting revenue, expenses, profits, and earnings per share.

| 2021 | 2022 | 2023 | 2024 | 2025 | |
|---|---|---|---|---|---|
| Revenue | 11.4B | 13.9B | 14.4B | 14.5B | 16.5B |
| Cost of Revenue | 6.0B | 7.6B | 7.4B | 7.5B | 8.4B |
| Operating Expenses | 3.4B | 4.9B | 3.5B | 3.7B | 3.7B |
| Gross Profit | 5.4B | 6.4B | 7.0B | 6.9B | 8.1B |
| EBITDA | 5.4B | 4.4B | 7.5B | 6.7B | 8.0B |
| EBIT | 2.6B | 1.3B | 4.4B | 4.1B | 5.6B |
| Interest Expense | 1.3B | 1.0B | 1.7B | 1.9B | 2.0B |
| Net Income | 3.4B | 1.2B | 2.0B | 2.1B | 3.0B |
| EPS | 3.99 | 1.19 | 2.38 | 2.44 | 3.46 |
| Filing Date | 2022-02-24 | 2023-02-21 | 2024-02-23 | 2025-02-27 | 2026-02-23 |
Income Statement Evolution
Dominion Energy’s revenue rose steadily from 11.4B in 2021 to 16.5B in 2025, marking a 44.6% growth over five years. Gross margin improved to 49.0% in 2025, reflecting better cost control. However, net income declined by 11.8% over the period, with net margins shrinking by nearly 39%, signaling margin pressures despite top-line growth.
Is the Income Statement Favorable?
The 2025 income statement shows strong fundamentals with revenue growth of 14.2% and net income rising 23.6% year-over-year. EBIT margin of 34.1% and net margin of 18.2% remain favorable, although interest expense at 12.3% of revenue is a clear headwind. Overall, the income statement depicts solid operating performance but highlights financial costs as a risk factor.
Financial Ratios
The table below summarizes key financial ratios for Dominion Energy, Inc. over the past five fiscal years, highlighting profitability, liquidity, leverage, efficiency, and dividend metrics:
| Ratios | 2021 | 2022 | 2023 | 2024 | 2025 |
|---|---|---|---|---|---|
| Net Margin | 29.8% | 8.5% | 14.1% | 14.7% | 18.2% |
| ROE | 12.4% | 4.3% | 7.4% | 7.8% | 10.3% |
| ROIC | 2.1% | 1.2% | 2.8% | 2.9% | 3.4% |
| P/E | 18.7 | 42.4 | 18.6 | 21.3 | 16.7 |
| P/B | 2.32 | 1.83 | 1.37 | 1.66 | 1.72 |
| Current Ratio | 0.84 | 0.73 | 1.04 | 0.71 | 0.77 |
| Quick Ratio | 0.65 | 0.62 | 0.97 | 0.52 | 0.59 |
| D/E | 1.49 | 1.49 | 1.61 | 1.53 | 1.68 |
| Debt-to-Assets | 40.7% | 39.3% | 40.6% | 40.8% | 42.2% |
| Interest Coverage | 1.54 | 1.44 | 2.04 | 1.72 | 2.18 |
| Asset Turnover | 0.11 | 0.13 | 0.13 | 0.14 | 0.14 |
| Fixed Asset Turnover | 0.19 | 0.27 | 0.24 | 0.21 | 0.21 |
| Dividend Yield | 3.2% | 4.4% | 5.9% | 5.0% | 4.6% |
Evolution of Financial Ratios
Dominion Energy’s Return on Equity (ROE) showed moderate improvement, rising from 7.8% in 2024 to 10.3% in 2025. The Current Ratio remained below 1, indicating continued liquidity constraints. Meanwhile, the Debt-to-Equity Ratio increased slightly to 1.68 in 2025, reflecting stable but elevated leverage. Profitability margins expanded steadily, signaling stronger operational efficiency.
Are the Financial Ratios Fovorable?
In 2025, profitability ratios such as net margin (18.16%) and dividend yield (4.55%) are favorable, yet ROIC (3.41%) lags behind WACC (5.43%), marking an unfavorable capital efficiency. Liquidity ratios, including current (0.77) and quick (0.59), are below the optimal threshold, raising red flags. Leverage is high with a debt-to-equity ratio of 1.68, and asset turnovers are weak, resulting in an overall slightly unfavorable financial position.
Shareholder Return Policy
Dominion Energy maintains a dividend payout ratio near 76%, with a stable dividend per share around $2.67 and a yield of about 4.55%. Share buybacks occur but free cash flow coverage is negative, raising sustainability concerns amid high capital expenditures.
The payout aligns with a mature utility’s typical income distribution, yet free cash flow deficits and leverage suggest risks. This distribution strategy balances income with reinvestment but requires close monitoring to ensure long-term shareholder value remains intact.
Score analysis
The radar chart below illustrates key financial scores that reflect the company’s valuation and profitability metrics:

Dominion Energy scores favorably on discounted cash flow and return on equity, indicating solid cash generation and shareholder returns. Its debt-to-equity score is unfavorable, signaling higher leverage risk. Other metrics like return on assets, price-to-earnings, and price-to-book remain moderate.
Analysis of the company’s bankruptcy risk
The Altman Z-Score places the company in the distress zone, highlighting a significant risk of financial distress and potential bankruptcy:

Is the company in good financial health?
The Piotroski Score diagram provides insight into the company’s financial strength using nine specific criteria:

With a strong Piotroski score of 7, the company demonstrates solid financial health, reflecting good profitability, liquidity, and operational efficiency despite some leverage concerns.
Competitive Landscape & Sector Positioning
This analysis reviews Dominion Energy’s strategic positioning, revenue segmentation, key products, and main competitors in the regulated electric sector. I will examine whether Dominion Energy holds a competitive advantage over its industry peers.
Strategic Positioning
Dominion Energy concentrates its portfolio in regulated electric and gas distribution across Virginia, South Carolina, and multiple states for gas. It balances regulated operations with contracted renewable energy assets, reflecting a strategic focus on stable, regulated markets complemented by growth in renewables.
Revenue by Segment
This pie chart illustrates Dominion Energy’s revenue distribution by segment for the fiscal year 2025, highlighting the key business drivers and their relative scale.

Dominion Energy Virginia dominates with $11.8B, showing robust growth from $9.7B in 2022. South Carolina contributes $3.6B, steady but growing modestly. Contracted Energy, at $1.2B, remains a smaller yet consistent revenue source. The 2025 data reveals increasing concentration in the Virginia segment, underscoring geographic reliance and potential risk if regional dynamics shift.
Key Products & Brands
The following table outlines Dominion Energy’s principal products and service segments with brief descriptions:
| Product | Description |
|---|---|
| Dominion Energy Virginia | Regulated electricity generation, transmission, and distribution serving ~2.7M customers in VA and NC. |
| Dominion Energy South Carolina | Electricity generation, transmission, and distribution to ~772K customers plus natural gas to ~419K in SC. |
| Gas Distribution | Regulated natural gas sales, transportation, gathering, storage, and distribution across six states serving ~3.1M customers. Includes nonregulated renewable natural gas facilities. |
| Contracted Energy | Nonregulated long-term contracted renewable electric generation, solar development, gas transportation, LNG import, storage, and liquefaction operations. |
Dominion Energy’s revenue mix centers on regulated electric and gas utilities, with growing contributions from contracted renewable energy. This diversified portfolio supports stable cash flow but depends heavily on regulated segments in Virginia, South Carolina, and gas distribution markets.
Main Competitors
There are 23 competitors in the Regulated Electric sector, with the table showing the top 10 leaders by market capitalization:
| Competitor | Market Cap. |
|---|---|
| NextEra Energy, Inc. | 169B |
| The Southern Company | 96B |
| Duke Energy Corporation | 91B |
| American Electric Power Company, Inc. | 62B |
| Dominion Energy, Inc. | 51B |
| Exelon Corporation | 44B |
| Xcel Energy Inc. | 44B |
| Entergy Corporation | 42B |
| Public Service Enterprise Group Incorporated | 40B |
| Consolidated Edison, Inc. | 36B |
Dominion Energy ranks 5th among 23 competitors, with a market cap at 32.54% of the leader, NextEra Energy. It sits below the average market cap of the top 10 (67.5B) but above the sector median (34B). The company holds a 13.01% gap above its nearest competitor, American Electric Power, indicating a solid mid-tier position.
Comparisons with competitors
Check out how we compare the company to its competitors:
Does Dominion Energy have a competitive advantage?
Dominion Energy currently shows a slightly unfavorable competitive advantage, as its ROIC is below WACC by 2%, indicating value destruction despite improving profitability. The company operates extensive regulated electric and gas distribution networks serving millions of customers across multiple states, which provides some operational scale.
Looking ahead, Dominion Energy’s growth in ROIC and favorable income statement trends suggest improving efficiency and profitability. Its portfolio includes expanding renewable energy and long-term contracted assets, positioning the company to capitalize on emerging clean energy opportunities and regulatory shifts in the utility sector.
SWOT Analysis
This SWOT analysis highlights Dominion Energy’s key strategic factors shaping its competitive position and future prospects.
Strengths
- Regulated electric utility with stable cash flows
- Dividend yield at 4.55% supports income investors
- Revenue growth of 14.16% in past year
Weaknesses
- ROIC below WACC indicates value destruction
- Current ratio at 0.77 signals liquidity risk
- High debt-to-equity ratio of 1.68 raises leverage concerns
Opportunities
- Expansion in renewable energy and contracted assets
- Increasing demand for clean energy infrastructure
- Growth in regulated gas distribution markets
Threats
- Regulatory changes could limit returns
- Rising interest expenses at 12.25% of revenue
- Competition from alternative energy providers
Dominion Energy benefits from regulated markets and strong recent revenue gains but faces financial strain from weak ROIC and liquidity. The company must balance leveraging growth opportunities in renewables with tightening financial controls to mitigate rising debt and regulatory risks.
Stock Price Action Analysis
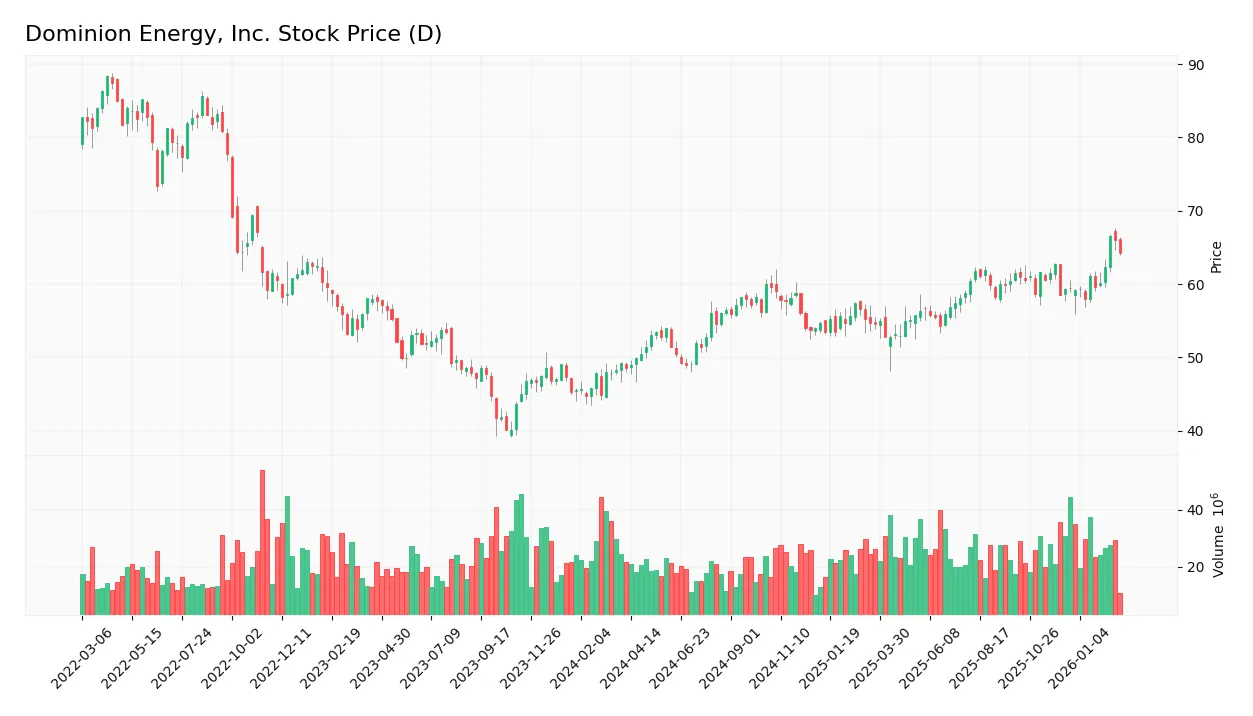
The weekly stock chart for Dominion Energy, Inc. (ticker: D) shows price movements over the past 12 months, highlighting key highs and lows:
Trend Analysis
Over the past year, Dominion Energy’s stock price rose 32.24%, indicating a bullish trend with acceleration. Price volatility, measured by a 3.8 standard deviation, is moderate. The highest price reached 66.51, and the lowest was 48.57, confirming strong upward momentum.
Volume Analysis
Trading volume over the last three months is increasing, with buyers dominating 62.14% of activity. Buyer volume stands at 210M versus seller volume of 128M, signaling strong investor demand and positive market participation in the recent period.
Target Prices
Analysts set a clear target consensus for Dominion Energy, Inc., reflecting moderate upside potential.
| Target Low | Target High | Consensus |
|---|---|---|
| 63 | 69 | 66 |
The target range signals steady confidence, with analysts expecting a modest price increase from current levels.

Don’t Let Luck Decide Your Entry Point
Optimize your entry points with our advanced ProRealTime indicators. You’ll get efficient buy signals with precise price targets for maximum performance. Start outperforming now!
Analyst & Consumer Opinions
This section examines the latest analyst ratings and consumer feedback related to Dominion Energy, Inc.’s performance and reputation.
Stock Grades
Here is the latest consensus and individual analyst grades for Dominion Energy, Inc. from leading financial institutions:
| Grading Company | Action | New Grade | Date |
|---|---|---|---|
| Barclays | Maintain | Overweight | 2026-01-22 |
| Wells Fargo | Maintain | Overweight | 2026-01-20 |
| Barclays | Maintain | Overweight | 2025-12-17 |
| JP Morgan | Maintain | Underweight | 2025-12-11 |
| BMO Capital | Maintain | Market Perform | 2025-11-03 |
| Morgan Stanley | Maintain | Equal Weight | 2025-10-22 |
| Barclays | Maintain | Overweight | 2025-10-07 |
| Morgan Stanley | Maintain | Equal Weight | 2025-09-25 |
| JP Morgan | Maintain | Underweight | 2025-08-21 |
| JP Morgan | Maintain | Underweight | 2025-07-15 |
The grades show a mixed but stable outlook, with Barclays favoring an overweight stance while JP Morgan consistently maintains an underweight view. The consensus currently leans toward a Hold rating, reflecting cautious optimism.
Consumer Opinions
Dominion Energy, Inc. receives mixed feedback from consumers, reflecting both satisfaction and areas needing improvement.
| Positive Reviews | Negative Reviews |
|---|---|
| Reliable energy supply with minimal outages. | Customer service response times can be slow. |
| Competitive pricing compared to regional peers. | Billing errors reported during peak seasons. |
| Strong commitment to renewable energy projects. | Limited communication about service disruptions. |
Overall, consumers praise Dominion Energy for consistent energy delivery and competitive rates. However, slow customer support and billing issues recur as common complaints.
Risk Analysis
Below is a summary table of key risks facing Dominion Energy, highlighting their likelihood and potential impact:
| Category | Description | Probability | Impact |
|---|---|---|---|
| Financial Health | Altman Z-Score in distress zone signals high bankruptcy risk | High | High |
| Liquidity | Current ratio at 0.77 and quick ratio 0.59 indicate weak liquidity | Medium | Medium |
| Leverage | Debt-to-equity ratio of 1.68 raises concerns about financial risk | Medium | High |
| Profitability | ROIC (3.41%) below WACC (5.43%) suggests value destruction | Medium | Medium |
| Market Volatility | Beta of 0.706 shows lower sensitivity to market fluctuations | Low | Low |
Dominion Energy’s most pressing risk is its distressed Altman Z-Score, implying potential financial distress. Despite a strong Piotroski score, weak liquidity ratios and high leverage pose red flags. The company’s ROIC below WACC warns of inefficient capital use, demanding close investor scrutiny.
Should You Buy Dominion Energy, Inc.?
Dominion Energy appears to be improving profitability with a growing ROIC, yet it currently destroys value relative to WACC, suggesting a slightly unfavorable moat. Despite a substantial leverage profile and distress-zone Altman Z-Score, its B+ rating implies very favorable overall financial health.
Strength & Efficiency Pillars
Dominion Energy, Inc. posts robust operational margins, including a gross margin of 49.02% and an EBIT margin of 34.13%. Its net margin stands at a healthy 18.16%, reflecting solid profitability. However, the company’s return on invested capital (ROIC) is 3.41%, below its weighted average cost of capital (WACC) at 5.43%, indicating value destruction despite improving profitability trends. These figures suggest operational strength but limited value creation from capital deployment.
Weaknesses and Drawbacks
The company is in financial distress, with an Altman Z-Score of 0.70, signaling a high bankruptcy risk. Leverage is elevated, with a debt-to-equity ratio of 1.68 and weak liquidity ratios (current ratio 0.77, quick ratio 0.59), raising concerns about short-term solvency. Interest expense consumes 12.25% of earnings, pressuring cash flow. Moderate valuation multiples (P/E 16.69, P/B 1.72) offer some valuation cushion, but the distress signals dominate the risk profile.
Our Final Verdict about Dominion Energy, Inc.
Despite favorable operational margins and strong Piotroski health (score 7), Dominion Energy’s Z-Score in the distress zone makes the investment profile highly speculative. The solvency risk overshadows profitability gains and recent bullish price trends. This profile might appear too risky for conservative capital and demands cautious monitoring until financial stability improves.
Disclaimer: This content is for informational purposes only and does not constitute financial, investment, or other professional advice. Investing in financial markets involves a significant risk of loss, and past performance is not indicative of future results.
Additional Resources
- Dominion Energy (D) Reports Q4 Earnings: What Key Metrics Have to Say – Yahoo Finance (Feb 23, 2026)
- Dominion Energy: Q4 Earnings Snapshot – kens5.com (Feb 23, 2026)
- Dominion Energy (D) Q4 Earnings and Revenues Surpass Estimates – Nasdaq (Feb 23, 2026)
- Earnings call transcript: Dominion Energy Q4 2025 sees revenue beat, EPS miss – Investing.com (Feb 23, 2026)
- What’s Going On With Dominion Energy Stock Monday? – Dominion Energy (NYSE:D) – Benzinga (Feb 23, 2026)
For more information about Dominion Energy, Inc., please visit the official website: dominionenergy.com