Home > Analyses > Consumer Defensive > Dollar Tree, Inc.
Dollar Tree, Inc. transforms everyday shopping with its fixed-price bargain model, shaping the discount retail landscape. Operating over 16,000 stores across two major brands—Dollar Tree and Family Dollar—it offers a vast range of consumables, household goods, and seasonal products. Known for its relentless focus on value and convenience, the company commands a strong presence in consumer defensive retail. The key question now: does Dollar Tree’s robust market footprint still justify its current valuation and growth prospects?

Table of contents
Business Model & Company Overview
Dollar Tree, Inc., founded in 1986 and headquartered in Chesapeake, Virginia, commands a leading position in the discount variety retail sector. It operates two complementary segments—Dollar Tree and Family Dollar—that together form a cohesive retail ecosystem. Dollar Tree offers fixed-price merchandise at $1.25, spanning consumables to seasonal goods, while Family Dollar provides a broader general merchandise range, including apparel and electronics. This dual-brand strategy underpins its scale with over 16,000 stores and multiple distribution centers across North America.
The company’s revenue engine balances fixed-price retail with diverse product offerings, driving strong customer loyalty. It leverages a strategic footprint across the Americas, supported by 26 distribution centers enabling efficient supply chains. This blend of recurring consumer demand and operational breadth creates a robust economic moat, positioning Dollar Tree as a durable force shaping the future of discount retailing.
Financial Performance & Fundamental Metrics
I analyze Dollar Tree, Inc.’s income statement, key financial ratios, and dividend payout policy to assess its operational efficiency and shareholder value creation.
Income Statement
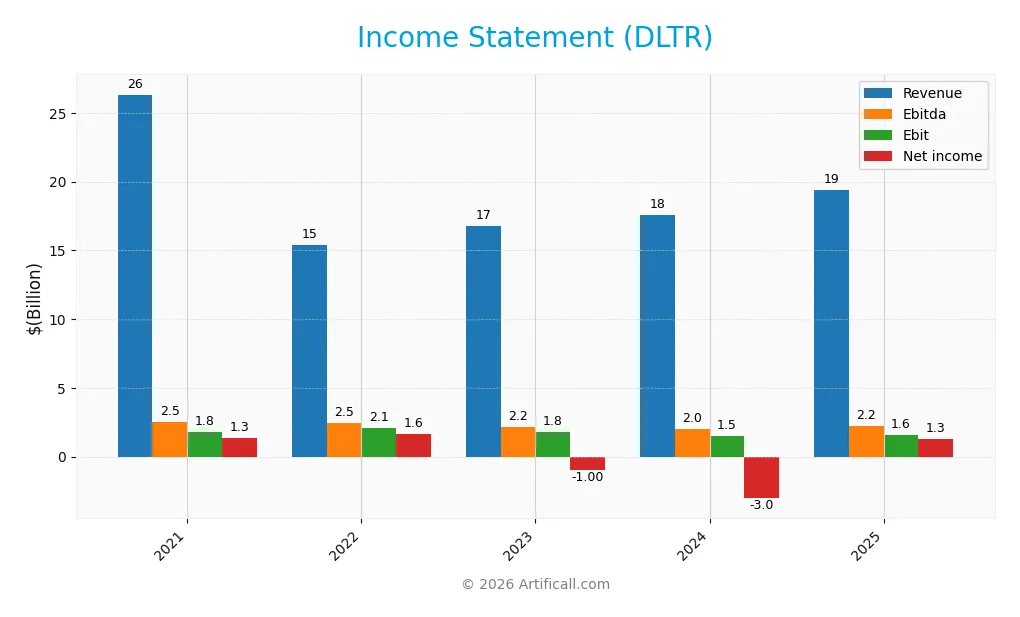
The table below presents Dollar Tree, Inc.’s key income statement figures for fiscal years 2021 through 2025, reflecting revenue, expenses, profitability, and earnings per share.
| 2021 | 2022 | 2023 | 2024 | 2025 | |
|---|---|---|---|---|---|
| Revenue | 26.3B | 15.4B | 16.8B | 17.6B | 19.4B |
| Cost of Revenue | 18.6B | 9.6B | 10.8B | 11.3B | 12.3B |
| Operating Expenses | 5.9B | 3.7B | 4.2B | 4.8B | 5.5B |
| Gross Profit | 7.7B | 5.8B | 6.0B | 6.3B | 7.1B |
| EBITDA | 2.5B | 2.5B | 2.2B | 2.0B | 2.2B |
| EBIT | 1.8B | 2.1B | 1.8B | 1.5B | 1.6B |
| Interest Expense | 179M | 127M | 113M | 108M | 85M |
| Net Income | 1.3B | 1.6B | -998M | -3.0B | 1.3B |
| EPS | 5.8 | 7.2 | -4.6 | -14.1 | 6.2 |
| Filing Date | 2022-03-15 | 2023-03-10 | 2024-03-20 | 2025-03-26 | 2026-03-16 |
Income Statement Evolution
From 2021 to 2025, Dollar Tree’s revenue declined by 26.25%, reflecting sector challenges. However, 2025 showed a 10.43% rebound in revenue and a 12.27% rise in gross profit. Gross margins stabilized favorably at 36.4%, while net margin improved by 30.96%, signaling better cost control despite operating expenses growing alongside revenue.
Is the Income Statement Favorable?
In 2025, Dollar Tree posted $19.4B revenue and $1.28B net income, reversing prior losses. The net margin of 6.61% and interest expense at 0.44% of revenue mark financial discipline. EBIT margin stood neutral at 8.23%. Earnings per share surged 142.28%. Overall, the fundamentals for 2025 appear favorable, supported by strong margin recovery and positive earnings growth.
Financial Ratios
The table below summarizes key financial ratios for Dollar Tree, Inc. over the last five fiscal years, offering insight into profitability, liquidity, leverage, and efficiency:
| Ratios | 2021 | 2022 | 2023 | 2024 | 2025 |
|---|---|---|---|---|---|
| Net Margin | 5.0% | 10.5% | -5.9% | -17.2% | 6.6% |
| ROE | 17.2% | 18.5% | -13.7% | -76.2% | 34.2% |
| ROIC | 7.8% | 7.5% | 7.4% | 9.2% | 10.7% |
| P/E | 22.1 | 20.8 | -30.5 | -5.2 | 18.9 |
| P/B | 3.79 | 3.84 | 4.16 | 3.98 | 6.44 |
| Current Ratio | 1.34 | 1.51 | 1.31 | 1.06 | 1.07 |
| Quick Ratio | 0.30 | 0.22 | 0.77 | 0.75 | 0.29 |
| D/E | 1.29 | 1.16 | 1.01 | 1.97 | 1.23 |
| Debt-to-Assets | 46% | 44% | 33% | 42% | 34% |
| Interest Coverage | 10.1 | 16.5 | 15.8 | 13.6 | 18.7 |
| Asset Turnover | 1.21 | 0.67 | 0.76 | 0.94 | 1.44 |
| Fixed Asset Turnover | 2.41 | 1.35 | 2.24 | 2.03 | 2.07 |
| Dividend Yield | 0% | 0% | 0% | 0% | 0% |
Evolution of Financial Ratios
From 2021 to 2025, Dollar Tree’s Return on Equity (ROE) fluctuated significantly, dropping sharply in 2023 and 2024 before rebounding strongly in 2025 to 34.16%. The Current Ratio showed a declining trend, stabilizing near 1.07 in 2025, reflecting moderate liquidity. The Debt-to-Equity Ratio remained high and unstable, peaking above 1.9 in 2024 before easing to 1.23 in 2025, indicating persistent leverage challenges.
Are the Financial Ratios Fovorable?
In 2025, Dollar Tree’s profitability is favorable with ROE at 34.16% exceeding the sector’s cost of capital of 6.4%. Liquidity ratios are neutral to unfavorable; the Current Ratio sits at 1.07 while the Quick Ratio is low at 0.29. Leverage remains elevated with a Debt-to-Equity ratio of 1.23, flagged as unfavorable. Market valuation metrics show mixed signals: P/E is neutral at 18.87, but Price-to-Book at 6.44 is unfavorable. Overall, ratios suggest a slightly favorable financial position with notable risks in liquidity and leverage.
Shareholder Return Policy
Dollar Tree, Inc. does not pay dividends, reflecting its focus on reinvestment and growth rather than immediate shareholder payouts. The company has no dividend payout ratio or yield, but it maintains free cash flow, supporting potential future distributions or strategic initiatives.
The absence of dividends aligns with a growth strategy prioritizing operational cash flow and capital expenditures. Lack of share buybacks suggests management is currently reinvesting capital to sustain long-term value. This approach may benefit shareholders if growth translates into higher future returns.
Score analysis
The following radar chart presents Dollar Tree, Inc.’s key financial scores across valuation, profitability, and leverage metrics:
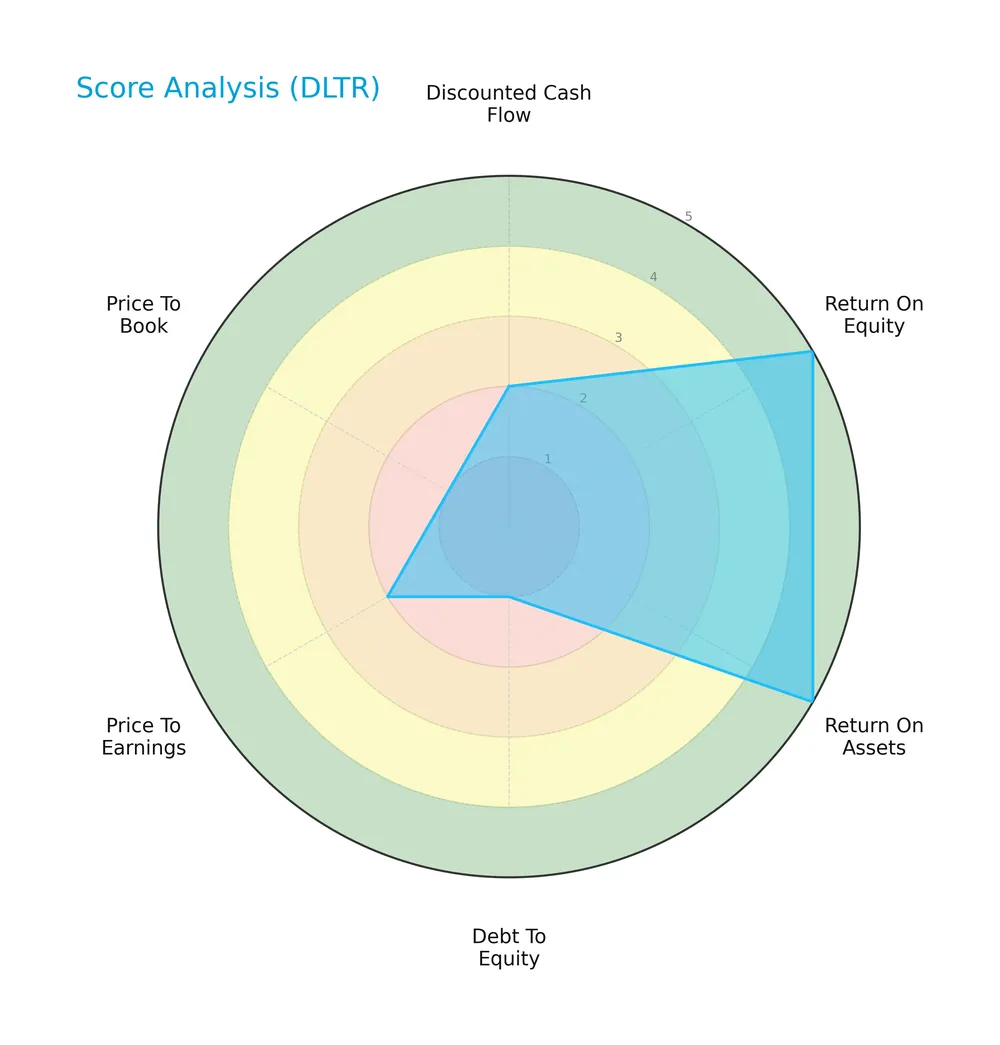
Dollar Tree scores very favorably on return on equity and assets, indicating efficient use of capital and assets. However, its debt-to-equity, price-to-earnings, and price-to-book scores are very unfavorable to unfavorable, signaling financial leverage concerns and valuation pressures. The discounted cash flow score also registers as unfavorable.
Analysis of the company’s bankruptcy risk
Dollar Tree’s Altman Z-Score places it firmly in the safe zone, indicating a low risk of bankruptcy based on its financial ratios:

Is the company in good financial health?
The Piotroski Score diagram highlights Dollar Tree’s strong financial health and operational efficiency:

With a Piotroski score of 8, Dollar Tree exhibits very strong financial strength, reflecting solid profitability, liquidity, and improved leverage metrics.
Competitive Landscape & Sector Positioning
This section analyzes Dollar Tree, Inc.’s strategic positioning, revenue streams, key products, and competitors within the discount retail sector. I will assess whether Dollar Tree holds a competitive advantage over its main rivals.
Strategic Positioning
Dollar Tree, Inc. focuses on discount retail through two core segments: Dollar Tree and Family Dollar. It maintains a concentrated product portfolio in consumables and general merchandise, serving the U.S. and Canada markets with over 16K stores and distribution centers, emphasizing geographic concentration rather than diversification.
Revenue by Segment
This pie chart illustrates Dollar Tree, Inc.’s revenue composition by segment for fiscal year 2025, highlighting the relative scale and contribution of each business unit.
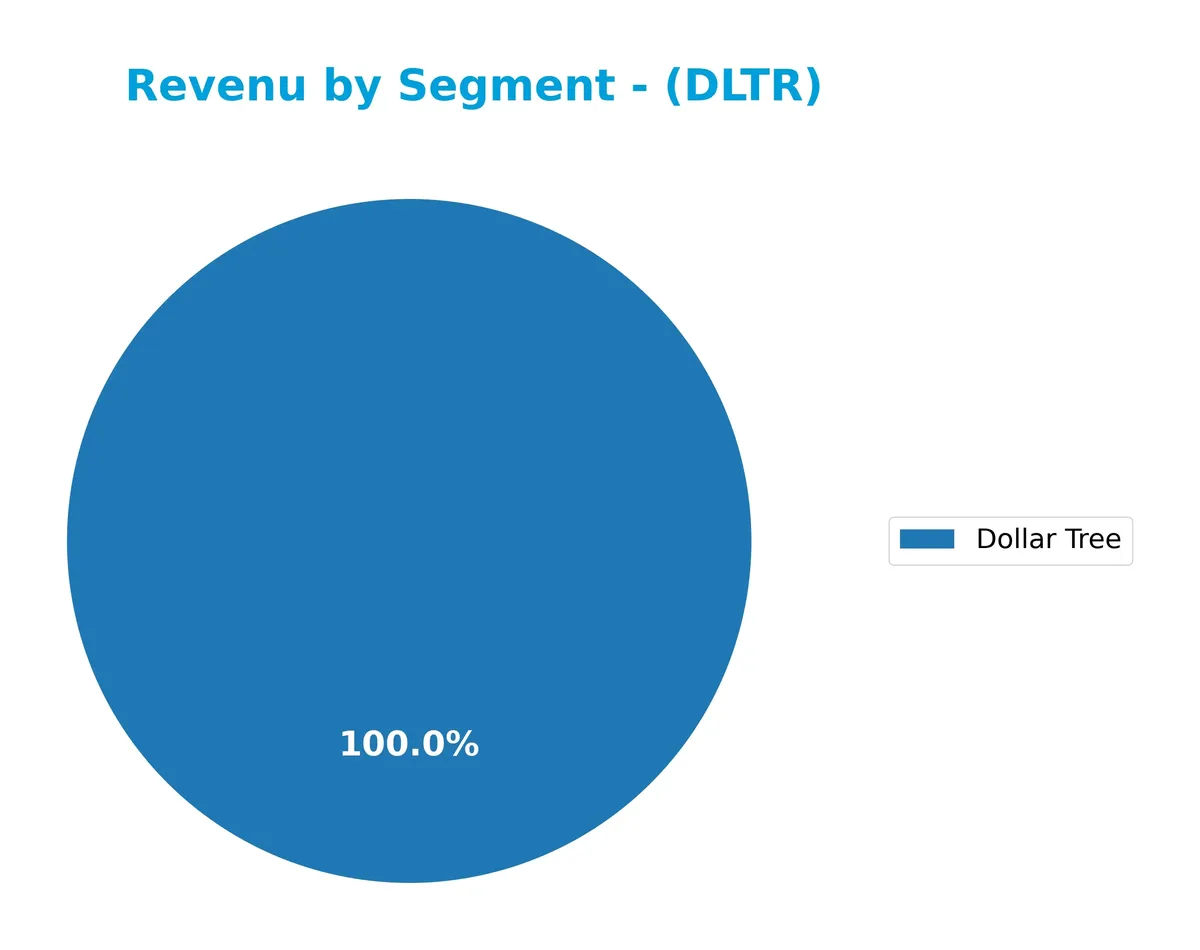
Dollar Tree segment clearly dominates, generating $19.4B in 2025, up from $17.6B in 2024, showing steady acceleration. Family Dollar, once a significant contributor, is absent from 2024 and 2025 data, signaling a potential strategic shift or divestiture. Historically, both segments balanced revenue, but Dollar Tree now concentrates the company’s sales, raising concentration risk but reflecting focused capital allocation and operational emphasis.
Key Products & Brands
Dollar Tree, Inc. operates two main retail segments with distinct product offerings and pricing models:
| Product | Description |
|---|---|
| Dollar Tree | Fixed-price stores ($1.25) offering consumables, variety merchandise, seasonal goods, and household items. |
| Family Dollar | Discount stores selling consumables, home products, apparel, electronics, and seasonal merchandise. |
Dollar Tree focuses on value-priced fixed merchandise, while Family Dollar offers a broader discount retail mix. Both segments serve the affordable retail market with extensive product variety.
Main Competitors
Dollar Tree, Inc. competes with a total of 6 companies in the Discount Stores industry; the table lists the top 6 leaders by market capitalization:
| Competitor | Market Cap. |
|---|---|
| Walmart Inc. | 899B |
| Costco Wholesale Corporation | 379B |
| Target Corporation | 46B |
| Dollar General Corporation | 30B |
| Dollar Tree, Inc. | 27B |
| BJ’s Wholesale Club Holdings | 12B |
Dollar Tree ranks 5th among its competitors and holds just 2.37% of Walmart’s market cap, the sector leader. The company is below both the average market cap of the top 10 competitors (232B) and the sector median (38B). It maintains a +41.54% gap relative to the next competitor above, highlighting a notable scale difference with Dollar General.
Comparisons with competitors
Check out how we compare the company to its competitors:
Does DLTR have a competitive advantage?
Dollar Tree, Inc. presents a clear competitive advantage, evidenced by a very favorable moat with ROIC exceeding WACC by 4.3% and a strong upward ROIC trend of 37.5% from 2021 to 2025. This reflects efficient capital use and sustained value creation amid a challenging retail sector.
Looking ahead, Dollar Tree’s dual-segment model—Dollar Tree and Family Dollar—positions it well to leverage growth opportunities across discount retail markets. Expansion in consumables, seasonal goods, and distribution centers supports potential revenue growth and margin improvement.
SWOT Analysis
This SWOT analysis highlights Dollar Tree, Inc.’s core competitive position and risks to guide strategic investment decisions.
Strengths
- Strong ROE of 34%
- Growing ROIC well above WACC
- Diverse store footprint with 16,000+ locations
Weaknesses
- High debt-to-equity ratio of 1.23
- Low quick ratio at 0.29 signals liquidity risk
- Unfavorable price-to-book ratio of 6.44
Opportunities
- Expansion in value retail segment
- Rising consumer demand for discount goods
- Potential e-commerce integration
Threats
- Intense competition from other discount retailers
- Economic downturns impact consumer spending
- Rising supply chain costs and inflation pressures
Dollar Tree demonstrates robust profitability and a growing competitive moat, but liquidity and leverage concerns require caution. The company should leverage growth opportunities while managing financial risks to sustain its market position.
Stock Price Action Analysis
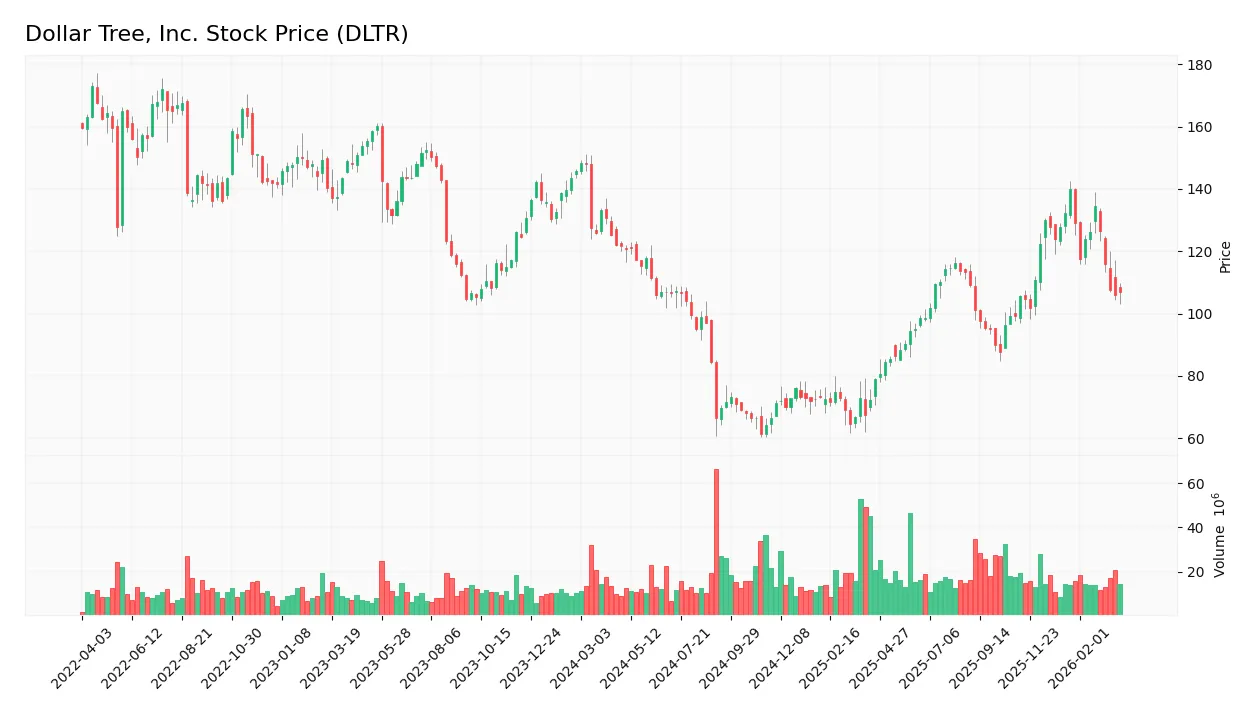
The weekly stock chart of Dollar Tree, Inc. (DLTR) illustrates price movements and volatility patterns over the past 12 months:
Trend Analysis
Over the past 12 months, DLTR’s stock price declined by 11.37%, establishing a bearish trend. The price showed deceleration in its downward momentum. The stock reached a high of 140 and a low near 61, with high volatility indicated by a 20.86 standard deviation.
Volume Analysis
Trading volume is increasing, with a nearly balanced buyer-to-seller ratio historically at 50.23% buyers. In the recent quarter, seller volume slightly exceeds buyer volume at 53%, reflecting neutral buyer behavior and modestly seller-driven activity. This suggests cautious investor sentiment and steady market participation.
Target Prices
Analysts set a clear target consensus for Dollar Tree, Inc., reflecting moderate optimism.
| Target Low | Target High | Consensus |
|---|---|---|
| 75 | 165 | 128.29 |
The target range spans from 75 to 165, with a consensus of 128.29, indicating positive but cautious market expectations.

Don’t Let Luck Decide Your Entry Point
Optimize your entry points with our advanced ProRealTime indicators. You’ll get efficient buy signals with precise price targets for maximum performance. Start outperforming now!
Analyst & Consumer Opinions
This section reviews Dollar Tree, Inc.’s analyst ratings and consumer feedback, highlighting key opinions and sentiment trends.
Stock Grades
Here are the latest verified grades from reputable financial institutions for Dollar Tree, Inc.:
| Grading Company | Action | New Grade | Date |
|---|---|---|---|
| Citigroup | Maintain | Neutral | 2026-03-17 |
| Piper Sandler | Maintain | Neutral | 2026-03-17 |
| Telsey Advisory Group | Maintain | Outperform | 2026-03-17 |
| Morgan Stanley | Maintain | Equal Weight | 2026-03-17 |
| Bernstein | Maintain | Market Perform | 2026-03-17 |
| Jefferies | Maintain | Underperform | 2026-03-17 |
| Truist Securities | Maintain | Buy | 2026-03-17 |
| Guggenheim | Maintain | Buy | 2026-03-17 |
| B of A Securities | Maintain | Underperform | 2026-03-17 |
The consensus leans toward a Buy rating, with a range from Underperform to Outperform. Most firms maintain their previous grades, reflecting a steady outlook without major shifts.
Consumer Opinions
Dollar Tree, Inc. sparks a mix of enthusiasm and frustration among its customers, reflecting the challenges of balancing value with quality.
| Positive Reviews | Negative Reviews |
|---|---|
| Consistently low prices make shopping easy and affordable. | Some products feel cheaply made and lack durability. |
| Friendly and helpful staff enhance the in-store experience. | Stores occasionally suffer from poor organization and clutter. |
| Wide variety of seasonal items excites bargain hunters. | Limited fresh food options disappoint health-conscious shoppers. |
Overall, consumers appreciate Dollar Tree’s unbeatable pricing and customer service. However, product quality and store upkeep emerge as frequent concerns, signaling areas for operational improvement.
Risk Analysis
Below is a table summarizing key risks facing Dollar Tree, Inc., including their likelihood and potential impact:
| Category | Description | Probability | Impact |
|---|---|---|---|
| Leverage | High debt-to-equity ratio (1.23) increases financial risk. | Medium | High |
| Liquidity | Very low quick ratio (0.29) signals cash flow constraints. | High | Medium |
| Valuation | Elevated price-to-book ratio (6.44) may indicate overvaluation. | Medium | Medium |
| Competitive Risk | Intense discount retail competition pressures margins. | High | High |
| Dividend Policy | No dividend yield could deter income-focused investors. | Medium | Low |
| Market Volatility | Beta of 0.69 suggests moderate sensitivity to market swings. | Medium | Medium |
The most prominent risks are leverage and liquidity concerns. Dollar Tree’s high debt level paired with a weak quick ratio may strain operations during economic downturns. Competition in discount retail remains fierce, impacting margins despite favorable returns on capital. Investors should monitor debt management closely.
Should You Buy Dollar Tree, Inc.?
Dollar Tree, Inc. appears to be a company with a robust profitability profile and a durable competitive moat, supported by a growing ROIC well above WACC. While its leverage profile raises caution, the overall rating of B suggests a very favorable financial standing despite some valuation concerns.
Strength & Efficiency Pillars
Dollar Tree, Inc. exhibits solid operational efficiency with a favorable return on equity of 34.16% and a return on invested capital (ROIC) of 10.69%. The weighted average cost of capital (WACC) stands at 6.4%, confirming that the company is a value creator with ROIC comfortably exceeding WACC by over 4 percentage points. Its gross margin of 36.4% further underscores effective cost control and pricing power, supporting sustained profitability and shareholder value creation.
Weaknesses and Drawbacks
Despite operational strengths, Dollar Tree faces valuation and leverage concerns. The price-to-book ratio at 6.44 signals an expensive valuation relative to book value, which may limit upside. Leverage is elevated with a debt-to-equity ratio of 1.23, increasing financial risk in volatile markets. Liquidity metrics also raise caution: a quick ratio of 0.29 suggests limited short-term asset coverage. The stock trend remains bearish with an 11.37% decline over the past year, while recent seller dominance at 52.97% introduces near-term market pressure.
Our Final Verdict about Dollar Tree, Inc.
Dollar Tree’s financial profile could appeal to long-term investors due to its strong value creation and robust profitability metrics. However, the bearish price trend and recent seller dominance suggest a cautious stance. Despite a very strong Piotroski score of 8 and a safe-zone Altman Z-Score of 3.59, these market signals imply a wait-and-see approach might be prudent before committing new capital.
Disclaimer: This content is for informational purposes only and does not constitute financial, investment, or other professional advice. Investing in financial markets involves a significant risk of loss, and past performance is not indicative of future results.
Additional Resources
- SG Americas Securities LLC Buys 128,230 Shares of Dollar Tree, Inc. $DLTR – MarketBeat (Mar 28, 2026)
- Dollar Tree, Inc. Reports Fourth Quarter and Full Year 2025 Results – corporate.dollartree.com (Mar 16, 2026)
- How Dollar Tree (DLTR) is using store closures and higher price points to defend margins – MSN (Mar 25, 2026)
- Vanguard disaggregates holdings; Dollar Tree (NASDAQ: DLTR) shows 0% ownership – Stock Titan (Mar 26, 2026)
- Dollar Tree (DLTR) Rebounded from Liberation Day Sell-Off – MSN (Mar 26, 2026)
For more information about Dollar Tree, Inc., please visit the official website: dollartree.com