Home > Analyses > Consumer Defensive > Dollar General Corporation
Dollar General transforms everyday shopping for millions across 47 states, offering unbeatable value in discount retail. It dominates the sector with over 18,000 stores, blending convenience with a broad range of consumables, apparel, and seasonal goods. Known for operational efficiency and deep market penetration, Dollar General continually innovates its supply chain to keep prices low. The key question: does its current financial strength and growth trajectory justify its market valuation today?

Table of contents
Business Model & Company Overview
Dollar General Corporation, founded in 1939 and headquartered in Goodlettsville, Tennessee, dominates the U.S. discount retail sector. Its vast ecosystem spans consumables, apparel, and seasonal goods, creating a one-stop shopping experience for value-conscious consumers. Operating 18,190 stores across 47 states, it serves diverse communities with a consistent mission to deliver affordability and convenience.
The company’s revenue engine balances high-turnover consumables with steady apparel and home products sales. Its footprint extends mainly across the southern, southwestern, Midwestern, and eastern U.S., capturing broad demographic demand. Dollar General’s scale and efficient supply chain build a durable competitive advantage, reinforcing its role as a key player shaping discount retail’s future.
Financial Performance & Fundamental Metrics
I analyze Dollar General Corporation’s income statement, key financial ratios, and dividend payout policy to reveal its operational efficiency and shareholder value creation.
Income Statement
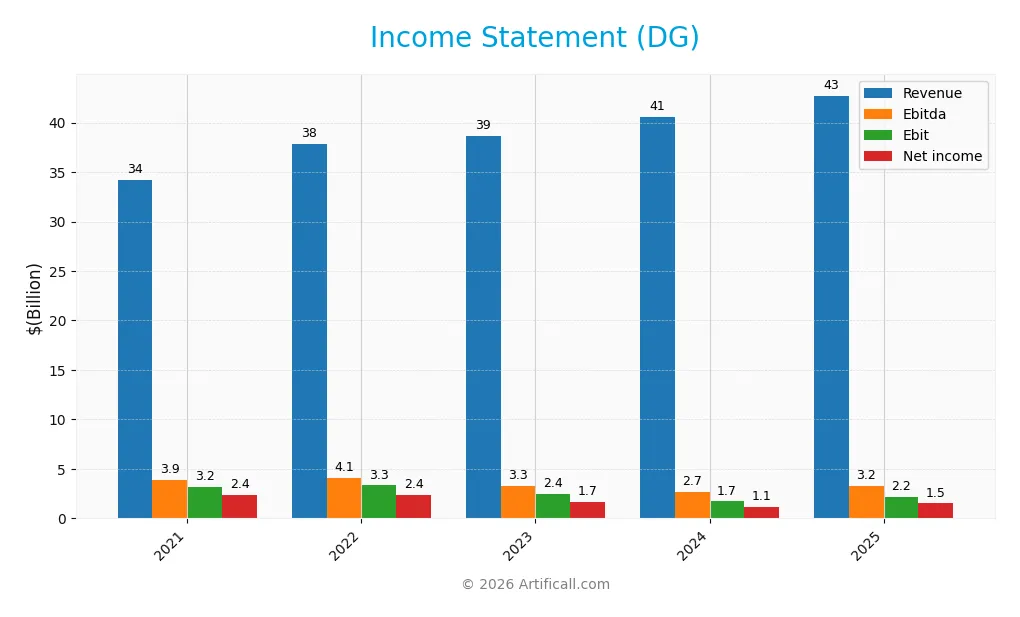
The table below summarizes Dollar General Corporation’s key income statement metrics over the last five fiscal years, showing revenue, profits, expenses, and earnings per share.
| 2021 | 2022 | 2023 | 2024 | 2025 | |
|---|---|---|---|---|---|
| Revenue | 34.2B | 37.8B | 38.7B | 40.6B | 42.7B |
| Cost of Revenue | 23.4B | 26.0B | 27.0B | 28.6B | 29.6B |
| Operating Expenses | 7.6B | 8.5B | 9.3B | 10.3B | 10.9B |
| Gross Profit | 10.8B | 11.8B | 11.7B | 12.0B | 13.1B |
| EBITDA | 3.9B | 4.1B | 3.3B | 2.7B | 3.2B |
| EBIT | 3.2B | 3.3B | 2.4B | 1.7B | 2.2B |
| Interest Expense | 158M | 211M | 327M | 274M | 231M |
| Net Income | 2.4B | 2.4B | 1.7B | 1.1B | 1.5B |
| EPS | 10.24 | 10.73 | 7.57 | 5.12 | 6.87 |
| Filing Date | 2022-03-18 | 2023-03-24 | 2024-03-25 | 2025-03-21 | 2026-03-20 |
Income Statement Evolution
Dollar General’s revenue rose steadily by 24.9% from 2021 to 2025, with a 5.2% increase in the latest year. Gross profit growth of 9.0% in 2025 outpaced revenue growth, improving gross margins to a favorable 30.7%. Operating expenses grew at the same pace as revenue, weighing on margin expansion despite a 28.6% jump in EBIT.
Is the Income Statement Favorable?
In 2025, Dollar General posted a net margin of 3.5%, classified as neutral, alongside a favorable interest expense ratio of 0.54%. Earnings per share climbed 34.1%, signaling improved profitability. However, net income declined 37% over five years, reflecting margin pressure over the period. Overall, the income statement fundamentals in 2025 appear favorable but warrant attention to expense management.
Financial Ratios
The table below summarizes Dollar General Corporation’s key financial ratios from 2021 to 2025, providing insight into profitability, liquidity, leverage, and valuation metrics:
| Ratios | 2021 | 2022 | 2023 | 2024 | 2025 |
|---|---|---|---|---|---|
| Net Margin | 7.0% | 6.4% | 4.3% | 2.8% | 3.5% |
| ROE | 38.3% | 43.6% | 24.6% | 15.2% | 17.8% |
| ROIC | 11.7% | 10.5% | 7.3% | 5.1% | 6.6% |
| P/E | 20.0 | 21.3 | 18.0 | 13.9 | 20.9 |
| P/B | 7.6 | 9.3 | 4.4 | 2.1 | 3.7 |
| Current Ratio | 1.05 | 1.29 | 1.19 | 1.19 | 1.13 |
| Quick Ratio | 0.12 | 0.14 | 0.15 | 0.21 | 0.22 |
| D/E | 2.28 | 3.19 | 2.68 | 2.36 | 1.85 |
| Debt-to-Assets | 54.1% | 60.7% | 58.7% | 56.1% | 50.8% |
| Interest Coverage | 20.4 | 15.8 | 7.5 | 6.2 | 9.6 |
| Asset Turnover | 1.30 | 1.30 | 1.26 | 1.30 | 1.38 |
| Fixed Asset Turnover | 2.37 | 2.38 | 2.25 | 2.34 | 2.45 |
| Dividend Yield | 0.82% | 0.96% | 1.73% | 3.32% | 1.65% |
Evolution of Financial Ratios
From 2021 to 2025, Dollar General’s Return on Equity (ROE) experienced volatility, peaking above 40% in 2022 and settling at 17.8% in 2025. The Current Ratio declined modestly from 1.29 to 1.13, indicating slightly reduced liquidity. Debt-to-Equity ratio trended downward but remained elevated at 1.85 in 2025. Profitability margins narrowed, with net margin dropping to 3.54%.
Are the Financial Ratios Fovorable?
In 2025, Dollar General shows a mixed financial profile. ROE at 17.8% exceeds the cost of capital, signaling effective equity use. However, net margin at 3.54% and debt ratios above 50% reveal profit pressure and leverage risk. Liquidity ratios are borderline, with a current ratio of 1.13 and quick ratio at 0.22. Market multiples suggest neutral valuation; overall, the ratio set is slightly unfavorable.
Shareholder Return Policy
Dollar General maintains a consistent dividend payout with a ratio near 34% in 2025 and a 1.65% yield, supported by free cash flow coverage of about 66%. The company also engages in share buybacks, enhancing shareholder returns alongside dividends.
The payout appears balanced, avoiding excessive distributions or buybacks relative to cash flow. This disciplined approach aligns with sustainable value creation, ensuring capital allocation supports both shareholder income and business reinvestment.
Score analysis
Here is an overview of Dollar General Corporation’s key financial scores to assess its valuation and risk profile:
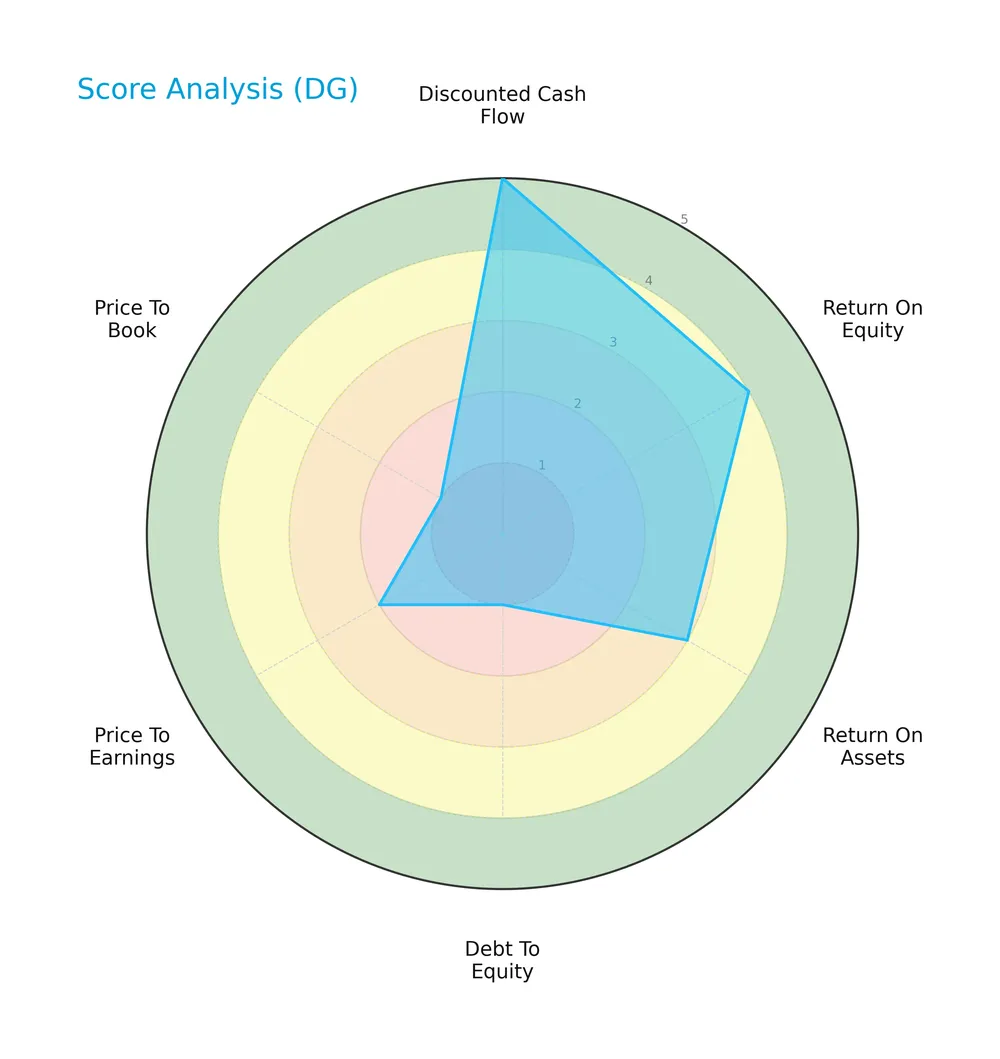
Dollar General shows strength in discounted cash flow (5) and return on equity (4), indicating solid profitability and cash generation. However, the low debt-to-equity (1) and price-to-book (1) scores reveal concerns around leverage and valuation. Overall, the scores present a mixed financial picture.
Analysis of the company’s bankruptcy risk
Dollar General’s Altman Z-Score places it in the grey zone, indicating moderate bankruptcy risk and financial uncertainty:

Is the company in good financial health?
This Piotroski diagram summarizes Dollar General’s financial robustness and operational efficiency:

With a Piotroski Score of 7, the company demonstrates strong financial health. This score reflects solid profitability, liquidity, and operational efficiency, positioning it well compared to weaker peers.
Competitive Landscape & Sector Positioning
This sector analysis will explore Dollar General Corporation’s strategic positioning, revenue segments, key products, and main competitors. I will assess whether Dollar General holds a competitive advantage within the discount retail industry.
Strategic Positioning
Dollar General concentrates its portfolio primarily in consumables, which generated $35B in 2025, complemented by apparel, seasonal, and home products. Its geographic reach covers 18,190 stores across 47 U.S. states, reflecting a focused domestic presence with diversified product categories.
Revenue by Segment
This pie chart illustrates Dollar General Corporation’s revenue distribution by product segment for the fiscal year 2025, highlighting the composition and relative scale of each business line.
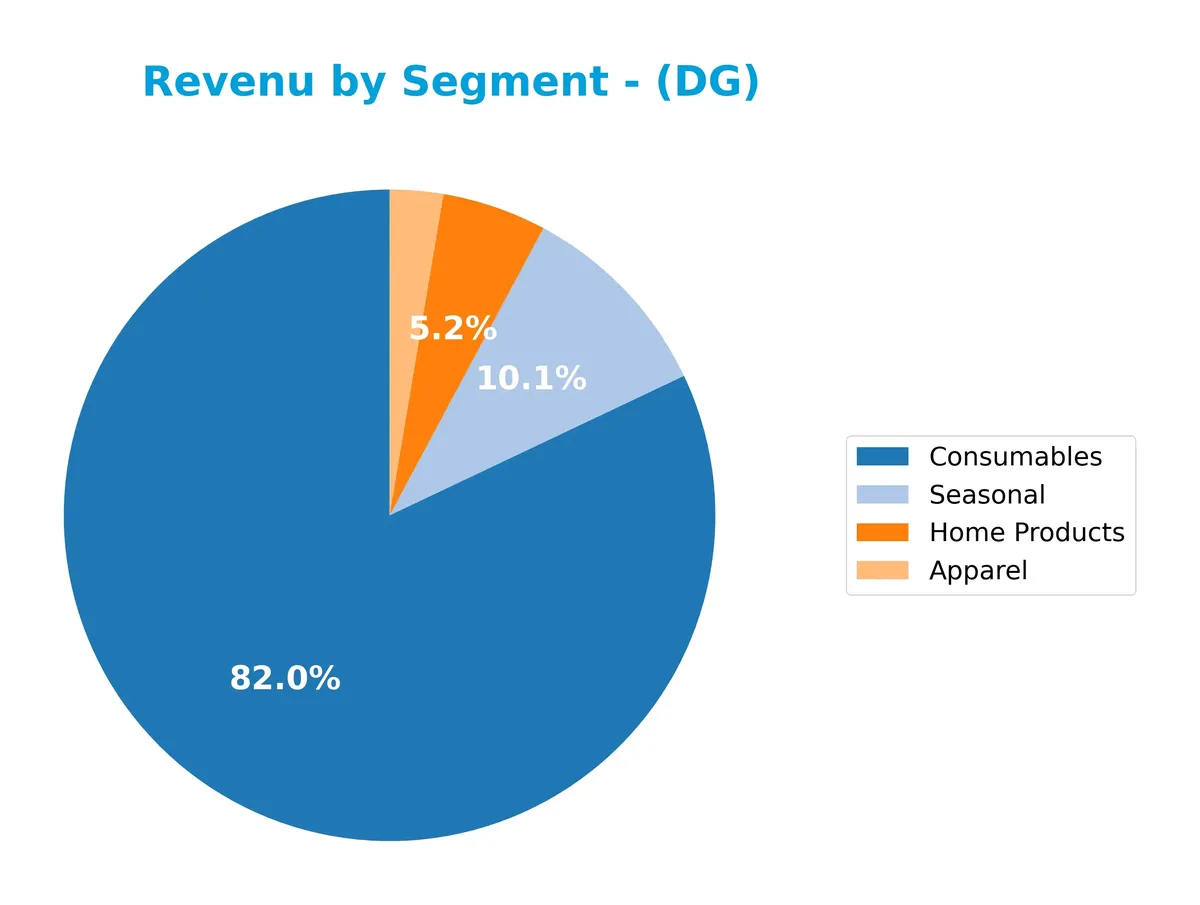
Dollar General’s revenue heavily relies on Consumables, which generated $35B in 2025, demonstrating steady growth and dominance. Seasonal products follow at $4.3B, showing a moderate increase and supporting diversification. Home Products and Apparel contribute $2.2B and $1.1B respectively, with Apparel revenue relatively stable. The company’s concentration in Consumables underscores a moat in essential goods but poses risks if market preferences shift or supply chains disrupt.
Key Products & Brands
The table below outlines Dollar General Corporation’s primary product categories and their descriptions:
| Product | Description |
|---|---|
| Consumables | Includes paper and cleaning products, packaged food, perishables, snacks, health and beauty items, pet supplies, and tobacco products. |
| Apparel | Casual everyday clothing for all ages, socks, underwear, disposable diapers, shoes, and accessories. |
| Home Products | Kitchen supplies, cookware, small appliances, light bulbs, storage containers, candles, craft supplies, and bed and bath soft goods. |
| Seasonal | Holiday items, toys, batteries, small electronics, greeting cards, stationery, prepaid phones, gardening supplies, hardware, and automotive and office supplies. |
Dollar General’s diverse product portfolio spans essential consumables to apparel and seasonal goods, supporting its broad discount retail strategy across multiple U.S. regions.
Main Competitors
There are 6 competitors in the Discount Stores industry; below is a table of the top 10 leaders by market capitalization:
| Competitor | Market Cap. |
|---|---|
| Walmart Inc. | 899B |
| Costco Wholesale Corporation | 379B |
| Target Corporation | 46B |
| Dollar General Corporation | 30B |
| Dollar Tree, Inc. | 27B |
| BJ’s Wholesale Club Holdings, Inc. | 12B |
Dollar General ranks 4th among its competitors with a market cap just 2.87% that of the leader, Walmart. It sits below both the average market cap of the top 10 (232B) and the median sector market cap (38B). The company maintains a 77% market cap gap to its nearest larger competitor, Target, indicating a significant scale difference.
Comparisons with competitors
Check out how we compare the company to its competitors:
Does Dollar General have a competitive advantage?
Dollar General demonstrates a competitive advantage by generating returns above its cost of capital, indicating value creation despite a declining profitability trend. Its extensive footprint of 18,190 stores across 47 states supports a wide consumer reach in the discount retail sector.
Looking ahead, Dollar General’s diverse product mix and strong market presence position it to leverage opportunities in consumables and apparel. Continued expansion and product innovation could help sustain its value creation amid evolving consumer demands.
SWOT Analysis
This analysis highlights Dollar General’s key strategic factors shaping its competitive positioning and growth potential.
Strengths
- strong brand recognition
- wide geographic footprint with 18K+ stores
- efficient asset turnover (1.38x)
Weaknesses
- high debt-to-equity ratio (1.85)
- low quick ratio (0.22) indicating liquidity risk
- declining ROIC trend (-43%)
Opportunities
- expanding consumables and perishables categories
- growth potential in underserved rural markets
- digital transformation and e-commerce integration
Threats
- intense discount retail competition
- margin pressure from rising operating expenses
- economic downturn impacting consumer spending
Dollar General creates value with solid operational efficiency but faces rising leverage and liquidity concerns. The company must balance aggressive expansion with prudent capital management to sustain growth and margin resilience.
Stock Price Action Analysis
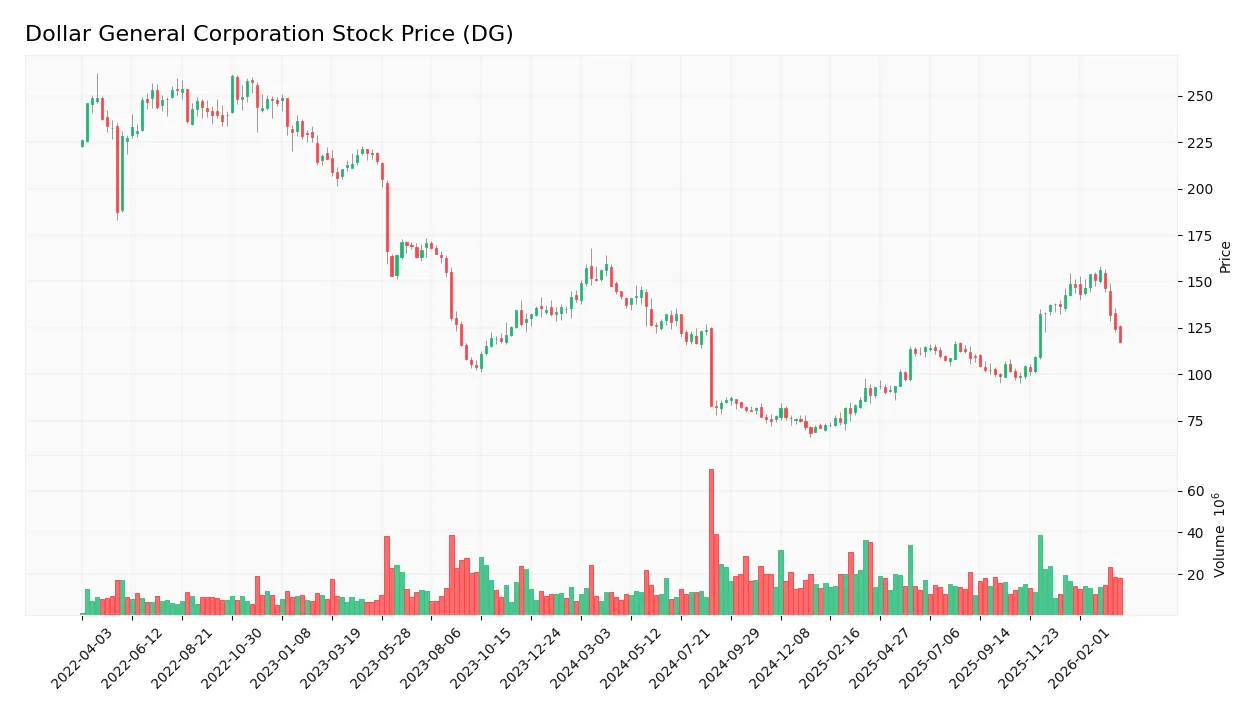
The weekly chart illustrates Dollar General Corporation’s stock price movement and volatility over the past 12 months:
Trend Analysis
Over the past year, Dollar General’s stock declined by 14.79%, confirming a bearish trend. The price dropped from a high of 156.24 to a low of 68.44. Volatility is elevated with a 24.29 standard deviation. The downtrend shows deceleration, indicating a slowing pace of decline.
Volume Analysis
Trading volumes have increased overall, with sellers accounting for 54.25% historically. In the recent quarter, seller dominance intensified to 59.23%, suggesting selling pressure. This volume pattern implies cautious investor sentiment and reduced buying interest in the stock.
Target Prices
Analysts present a balanced target price consensus for Dollar General Corporation.
| Target Low | Target High | Consensus |
|---|---|---|
| 111 | 170 | 145 |
The target range reflects moderate optimism, with a consensus price suggesting a potential upside aligned with sector growth trends.

Don’t Let Luck Decide Your Entry Point
Optimize your entry points with our advanced ProRealTime indicators. You’ll get efficient buy signals with precise price targets for maximum performance. Start outperforming now!
Analyst & Consumer Opinions
This section reviews Dollar General Corporation’s analyst ratings alongside consumer feedback to gauge market sentiment and brand perception.
Stock Grades
Here are the latest verified stock grades from recognized financial firms for Dollar General Corporation:
| Grading Company | Action | New Grade | Date |
|---|---|---|---|
| Telsey Advisory Group | Maintain | Market Perform | 2026-03-25 |
| Guggenheim | Maintain | Buy | 2026-03-13 |
| Morgan Stanley | Maintain | Equal Weight | 2026-03-13 |
| Piper Sandler | Maintain | Neutral | 2026-03-13 |
| Telsey Advisory Group | Maintain | Market Perform | 2026-03-13 |
| Telsey Advisory Group | Maintain | Market Perform | 2026-03-09 |
| Piper Sandler | Maintain | Neutral | 2026-03-06 |
| Oppenheimer | Maintain | Outperform | 2026-02-24 |
| Guggenheim | Maintain | Buy | 2026-02-17 |
| Evercore ISI Group | Maintain | In Line | 2026-02-03 |
The grades show steady sentiment with most firms maintaining neutral to positive views. Guggenheim and Oppenheimer lean bullish, while Telsey Advisory Group consistently holds a market perform stance, reflecting balanced expectations.
Consumer Opinions
Consumer sentiment around Dollar General Corporation reflects a mix of appreciation and concern, revealing key insights into its market positioning.
| Positive Reviews | Negative Reviews |
|---|---|
| Affordable prices make shopping convenient | Limited product variety frustrates some buyers |
| Stores are widely accessible and well-stocked | Customer service can be inconsistent |
| Efficient checkout speeds save time | Some locations show cleanliness issues |
Overall, consumers praise Dollar General for affordability and convenience. However, recurring complaints around product range and store upkeep suggest areas needing attention to sustain loyalty.
Risk Analysis
The following table summarizes key risks facing Dollar General Corporation, highlighting their likelihood and potential impact:
| Category | Description | Probability | Impact |
|---|---|---|---|
| Financial Leverage | High debt-to-equity ratio of 1.85 increases financial risk, limiting flexibility. | High | High |
| Liquidity | Low quick ratio of 0.22 signals potential short-term cash flow constraints. | Medium | Medium |
| Profitability | Net margin at 3.54% is below industry average, pressuring earnings growth. | Medium | Medium |
| Market Valuation | Unfavorable price-to-book ratio of 3.71 suggests overvaluation risk. | Medium | Medium |
| Bankruptcy Risk | Altman Z-Score of 2.55 places the company in the grey zone with moderate distress risk. | Medium | High |
| Operational | Competition and inflation could erode margins and sales volume. | Medium | Medium |
Dollar General’s most pressing risks stem from its high leverage and borderline bankruptcy risk. Despite a strong Piotroski score of 7 reflecting operational strength, its debt load and liquidity ratios warrant caution. The grey-zone Altman Z-score indicates moderate financial distress risk, underscoring the need for prudent risk management amid economic volatility.
Should You Buy Dollar General Corporation?
Dollar General appears to be a slightly favorable investment with a durable moat driven by value creation despite a declining ROIC trend. While profitability shows moderate improvement, its leverage profile remains substantial, resulting in a cautious B rating overall.
Strength & Efficiency Pillars
Dollar General Corporation maintains operational strength with a favorable gross margin of 30.66% and a return on equity of 17.77%. Its ROIC stands at 6.64%, comfortably exceeding the WACC of 4.37%, confirming the company as a value creator. Despite a neutral net margin of 3.54%, Dollar General delivers efficient capital allocation. The strong Piotroski score of 7 further supports solid financial health and operational execution, even as ROIC shows a declining trend.
Weaknesses and Drawbacks
The company faces moderate solvency risk, reflected by an Altman Z-Score of 2.55, placing it in the grey zone. This uncertainty tempers confidence despite operational strengths. Dollar General’s leverage is concerning with a debt-to-equity ratio of 1.85 and debt-to-assets at 50.76%, increasing financial risk. Valuation metrics also raise red flags: a price-to-book ratio of 3.71 is very unfavorable, and price-to-earnings at 20.87 sits at a neutral but premium level. Market sentiment leans seller-dominant recently, with buyers at only 40.77%, signaling short-term pressure.
Our Final Verdict about Dollar General Corporation
Dollar General may appear as a value-creating company with decent operational metrics, but the grey zone Altman Z-Score introduces caution. Despite favorable long-term fundamentals, the moderate solvency risk and recent seller dominance suggest a wait-and-see approach. This profile might appeal to investors with a tolerance for risk but could be too speculative for conservative capital seeking stability. Prudence dictates monitoring solvency improvements before increasing exposure.
Disclaimer: This content is for informational purposes only and does not constitute financial, investment, or other professional advice. Investing in financial markets involves a significant risk of loss, and past performance is not indicative of future results.
Additional Resources
- Dollar General Corporation Appoints Jerry W. “JJ” Fleeman Jr., as Chief Executive Officer – Business Wire (Mar 24, 2026)
- Dollar General Corporation (DG): Billionaire Seth Klarman Trims Position – Yahoo Finance (Mar 23, 2026)
- Why Dollar General (DG) Stock Is Down Today – StockStory (Mar 24, 2026)
- Dollar General continues to reduce its product lineup as it works to sharpen operations (DG:NYSE) – Seeking Alpha (Mar 27, 2026)
- Dollar General names Jerry Fleeman as next CEO – Investing.com (Mar 24, 2026)
For more information about Dollar General Corporation, please visit the official website: dollargeneral.com