Home > Analyses > Technology > DocuSign, Inc.
DocuSign transforms how agreements shape business and daily life, replacing paper with seamless digital workflows. It commands the e-signature software space, offering a robust suite that includes AI-driven contract lifecycle management and industry-specific cloud solutions. Renowned for innovation and reliability, DocuSign empowers millions to sign, manage, and automate agreements securely. As competition intensifies, I ask: does DocuSign’s current valuation reflect its ability to sustain growth and deepen its market moat?

Table of contents
Business Model & Company Overview
DocuSign, Inc., founded in 2003 and headquartered in San Francisco, dominates the electronic signature software industry. It offers a comprehensive ecosystem that digitally prepares, signs, and manages agreements worldwide. Its platform integrates AI-driven contract lifecycle management, remote online notarization, and industry-specific cloud solutions, empowering businesses to streamline complex workflows efficiently.
The company’s revenue engine balances subscription-based software, AI-enhanced services, and tailored industry modules. DocuSign commands strategic global markets across the Americas, Europe, and Asia through direct and partner-assisted sales. Its strong competitive advantage lies in its integrated digital agreement platform, which sets the standard for secure, scalable, and compliant contract management worldwide.
Financial Performance & Fundamental Metrics
I will analyze DocuSign, Inc.’s income statement, key financial ratios, and dividend payout policy to assess its core financial health and shareholder value creation.
Income Statement
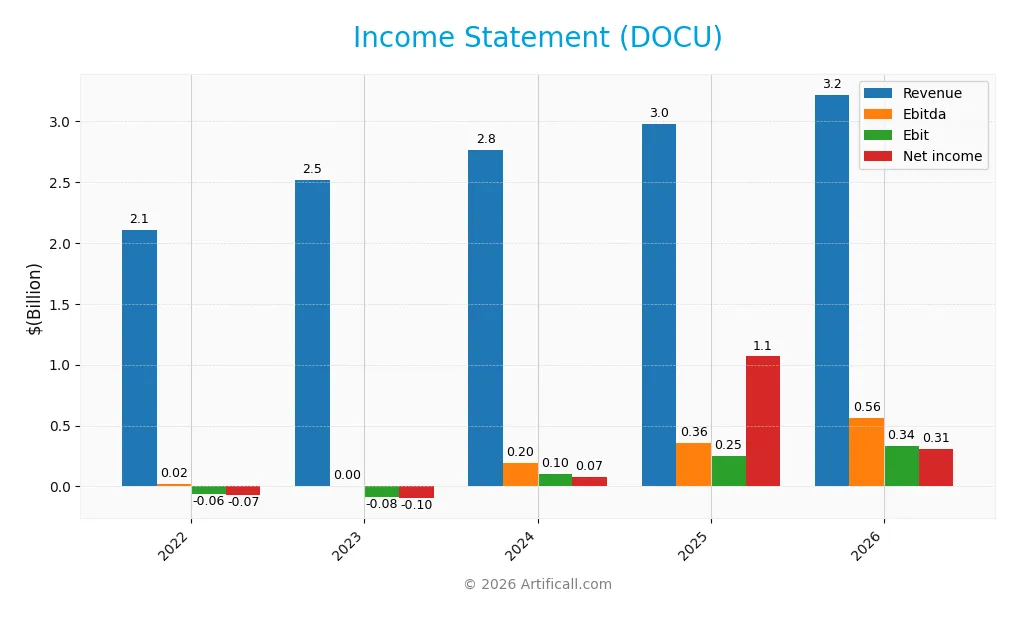
The table below presents DocuSign, Inc.’s key income statement figures for fiscal years 2022 through 2026, reflecting revenue growth and fluctuating profitability.
| 2022 | 2023 | 2024 | 2025 | 2026 | |
|---|---|---|---|---|---|
| Revenue | 2.11B | 2.52B | 2.76B | 2.98B | 3.22B |
| Cost of Revenue | 466M | 536M | 573M | 622M | 663M |
| Operating Expenses | 1.70B | 2.07B | 2.16B | 2.16B | 2.26B |
| Gross Profit | 1.64B | 1.98B | 2.19B | 2.36B | 2.56B |
| EBITDA | 21M | 3M | 196M | 357M | 562M |
| EBIT | -60M | -83M | 101M | 249M | 335M |
| Interest Expense | 6.44M | 6.39M | 6.84M | 1.55M | 2.55M |
| Net Income | -70M | -97M | 74M | 1.07B | 309M |
| EPS | -0.36 | -0.49 | 0.36 | 5.23 | 1.52 |
| Filing Date | 2022-03-25 | 2023-03-27 | 2024-03-21 | 2025-03-18 | 2026-03-18 |
Income Statement Evolution
DocuSign’s revenue rose consistently from 2.1B in 2022 to 3.2B in 2026, marking a 52.8% growth over five years. Gross profit and operating expenses grew proportionally, maintaining a stable gross margin near 79.4%. EBIT expanded sharply by 34.5% in the latest year, while net income showed significant volatility but improved overall.
Is the Income Statement Favorable?
In 2026, DocuSign delivered a solid 9.6% net margin with net income of 309M on 3.2B revenue, reflecting generally favorable fundamentals. EBIT margin stood at a healthy 10.4%, and interest expenses remained minimal at 0.08% of revenue. Despite a recent dip in net margin growth, the overall income statement signals operational strength and disciplined cost management.
Financial Ratios
The following table presents key financial ratios for DocuSign, Inc. over the fiscal years 2022 to 2026, reflecting profitability, valuation, liquidity, leverage, efficiency, and dividend metrics:
| Ratios | 2022 | 2023 | 2024 | 2025 | 2026 |
|---|---|---|---|---|---|
| Net Margin | -3.3% | -3.9% | 2.7% | 35.9% | 9.6% |
| ROE | -25.4% | -15.8% | 6.5% | 53.3% | 16.1% |
| ROIC | -5.1% | -5.7% | 1.9% | 9.1% | 12.0% |
| P/E | -353.5 | -125.0 | 168.0 | 18.5 | 34.1 |
| P/B | 89.8 | 19.7 | 11.0 | 9.9 | 5.5 |
| Current Ratio | 0.96 | 0.74 | 0.94 | 0.81 | 0.73 |
| Quick Ratio | 0.96 | 0.74 | 0.94 | 0.81 | 0.73 |
| D/E | 3.20 | 1.44 | 0.13 | 0.06 | 0.10 |
| Debt-to-Assets | 34.7% | 29.5% | 4.8% | 3.1% | 4.4% |
| Interest Coverage | -9.6 | -13.8 | 4.6 | 129.0 | 117.3 |
| Asset Turnover | 0.83 | 0.84 | 0.93 | 0.74 | 0.76 |
| Fixed Asset Turnover | 6.78 | 7.37 | 7.50 | 7.28 | 6.10 |
| Dividend Yield | 0% | 0% | 0% | 0% | 0% |
Evolution of Financial Ratios
DocuSign’s Return on Equity (ROE) improved significantly, rising from negative in 2022 and 2023 to a favorable 16.12% in 2026. The Current Ratio declined steadily, reaching an unfavorable 0.73 in 2026, indicating decreasing short-term liquidity. Debt-to-Equity Ratio improved substantially, dropping from over 3.2 in 2022 to a favorable 0.1 in 2026. Profitability showed clear recovery, with net margins turning positive and stabilizing at 9.6% in 2026.
Are the Financial Ratios Favorable?
In 2026, DocuSign’s profitability ratios, including ROE (16.12%) and ROIC (12.04%), are favorable, reflecting efficient capital use above the WACC (8.98%). Liquidity ratios remain unfavorable, with both Current and Quick Ratios at 0.73, below the standard 1.0 benchmark. Leverage is well controlled, evidenced by a low Debt-to-Equity of 0.1 and strong interest coverage at 131.77x. Market valuation ratios such as P/E (34.08) and P/B (5.49) appear elevated, signaling potential overvaluation relative to fundamentals. Overall, the ratio profile is slightly favorable but mixed across categories.
Shareholder Return Policy
DocuSign, Inc. does not pay dividends, reflecting its focus on reinvestment and growth. The company’s dividend payout ratio remains at zero, with no dividend yield, indicating no direct cash returns to shareholders.
The absence of dividends aligns with DocuSign’s strategy to prioritize capital allocation toward growth and innovation. The policy supports sustainable long-term value creation, assuming the firm continues generating positive free cash flow and profit margins as observed recently.
Score analysis
The following radar chart illustrates DocuSign’s key financial scores across valuation, profitability, and leverage metrics:
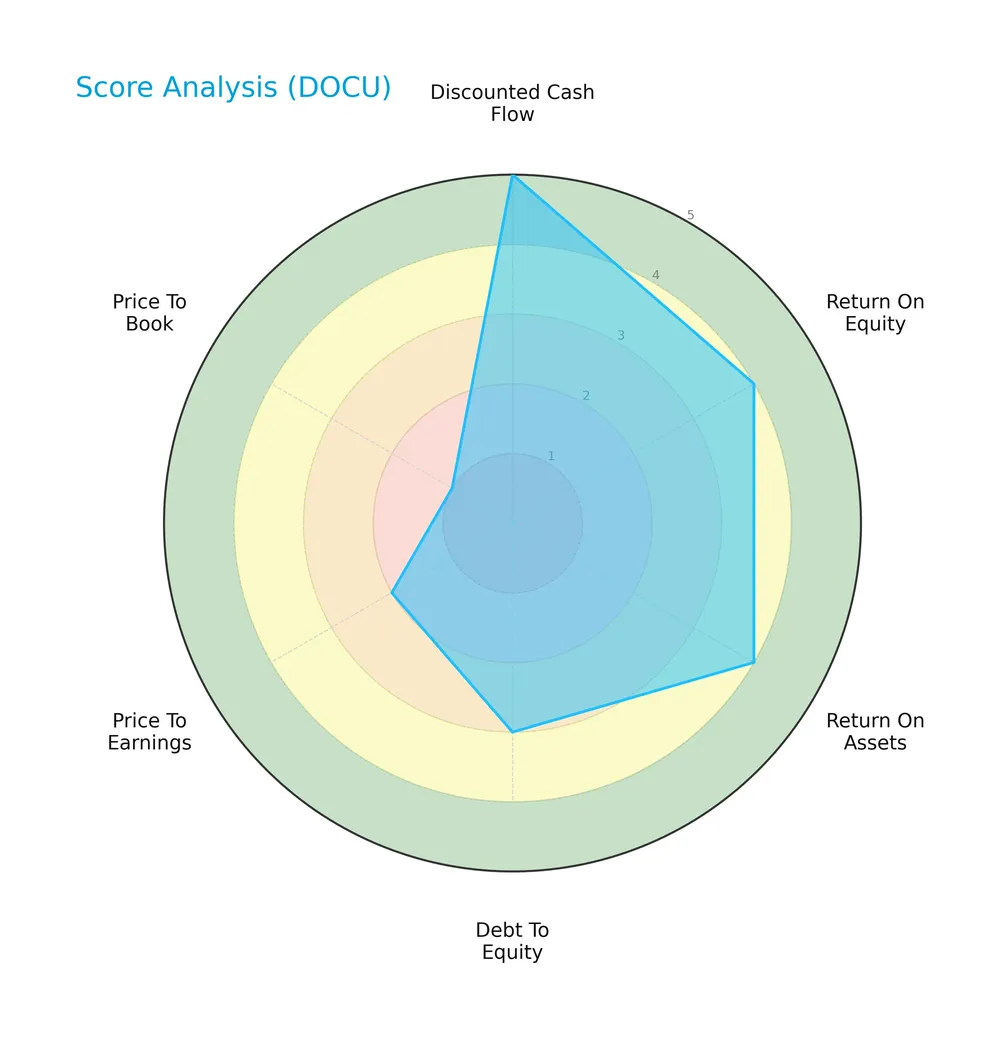
DocuSign shows very favorable discounted cash flow and favorable returns on equity and assets. Its debt-to-equity score is moderate. However, valuation metrics are weak, with unfavorable price-to-earnings and very unfavorable price-to-book scores.
Analysis of the company’s bankruptcy risk
DocuSign’s Altman Z-Score places it in the grey zone, indicating a moderate risk of bankruptcy:

Is the company in good financial health?
The Piotroski diagram below summarizes DocuSign’s financial strength based on nine accounting criteria:

With a score of 6, DocuSign’s financial health is average, reflecting neither strong nor weak fundamentals at this time.
Competitive Landscape & Sector Positioning
This section examines DocuSign, Inc.’s position within the software application sector, focusing on key business aspects. I will assess whether DocuSign holds a competitive advantage over its main rivals.
Strategic Positioning
DocuSign concentrates on subscription-based electronic signature software, generating over 3.15B in 2026, with a smaller segment in professional services at 69M. Geographically, it focuses primarily on the US market (2.27B), while steadily expanding international revenue to 945M.
Revenue by Segment
This pie chart displays DocuSign, Inc.’s revenue distribution by segment for fiscal year 2026, highlighting the relative contribution of Subscription and Circulation versus Professional Services and Other.
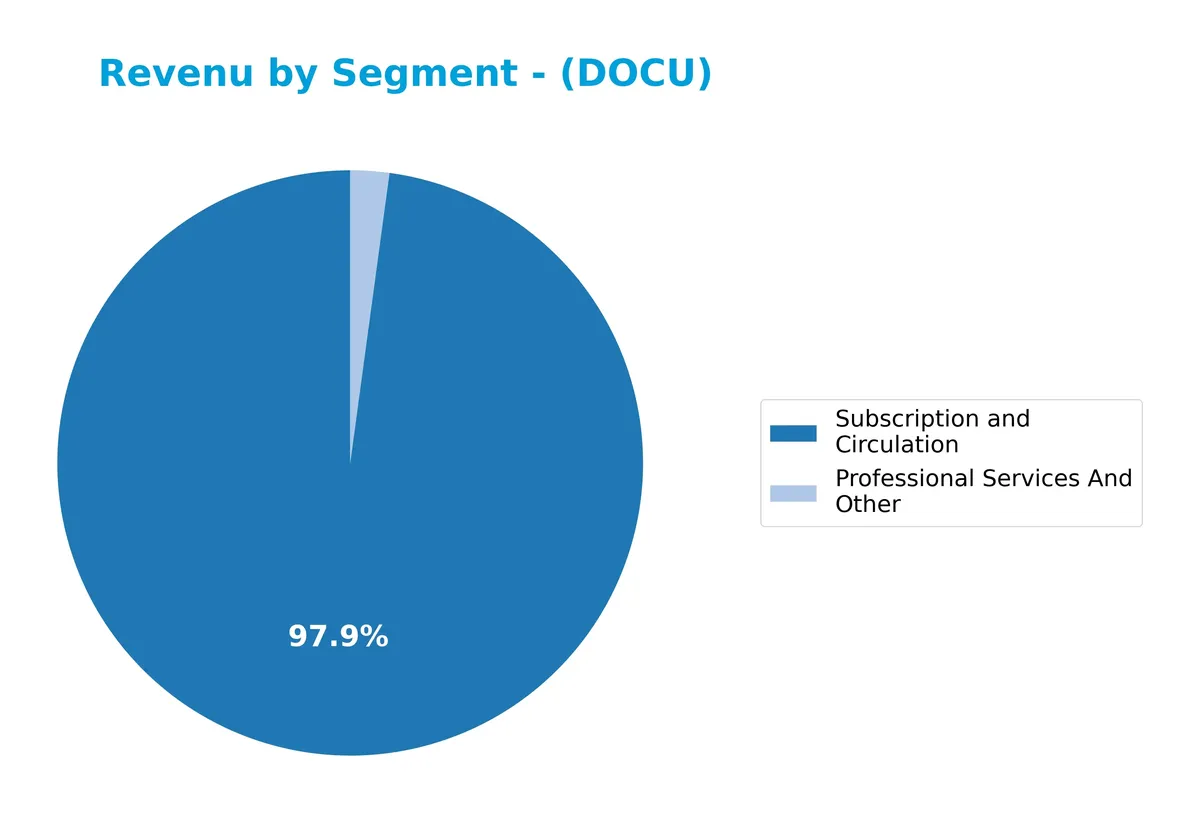
DocuSign’s revenue remains heavily concentrated in Subscription and Circulation, which reached $3.15B in 2026, showing steady growth from $663M in 2019. Professional Services and Other trails significantly at $69M. The subscription segment drives the business, underscoring strong recurring revenue. However, the slight decline in professional services suggests a shift toward a more focused SaaS model, reducing revenue diversification risks but enhancing predictability.
Key Products & Brands
The table below summarizes DocuSign’s primary products and brand offerings:
| Product | Description |
|---|---|
| eSignature | Digital signature solution enabling businesses to prepare, sign, and manage agreements electronically. |
| Contract Lifecycle Management (CLM) | Workflow automation across the entire agreement process, including AI-driven contract management tools. |
| Insights | AI-powered search and analysis of agreements by legal concepts and clauses. |
| Gen for Salesforce | Tool allowing sales teams to generate agreements quickly within Salesforce. |
| Negotiate for Salesforce | Supports approval workflows, document comparisons, and version control within Salesforce. |
| Analyzer | Helps customers understand agreement content before signing. |
| Guided Forms | Interactive step-by-step process for filling complex forms. |
| Click | Supports no-signature-required agreements for standard terms and consents. |
| Identify | Signer identification via government-issued ID verification. |
| Standards-Based Signatures | Supports digital certificate-based signatures. |
| Payments | Enables collection of signatures along with payment processing. |
| Remote Online Notary | Uses audio-visual and identity verification for remote notarization. |
| Monitor | Advanced analytics tracking usage across web, mobile, and API accounts. |
| Industry Cloud Offerings | Includes Rooms for Real Estate and Mortgage, FedRAMP for federal agencies, and Life Sciences compliance modules. |
DocuSign’s portfolio centers on electronic signature software and comprehensive contract management solutions. Its offerings leverage AI and integrations to streamline agreement workflows across various industries. Subscription revenue dominates its sales, complemented by professional services.
Main Competitors
There are 33 competitors in the sector; below are the top 10 leaders by market capitalization:
| Competitor | Market Cap. |
|---|---|
| Salesforce, Inc. | 242B |
| Shopify Inc. | 210B |
| AppLovin Corporation | 209B |
| Intuit Inc. | 175B |
| Uber Technologies, Inc. | 172B |
| ServiceNow, Inc. | 153B |
| Cadence Design Systems, Inc. | 84.5B |
| Snowflake Inc. | 73.4B |
| Autodesk, Inc. | 61.2B |
| Workday, Inc. | 54.9B |
DocuSign, Inc. ranks 20th among 33 competitors and holds just 3.67% of the market cap of leader Salesforce. It stands below both the average market cap of the top 10 (143.6B) and the sector median (18.8B). The company enjoys a substantial 105% market cap gap over its nearest competitor above.
Comparisons with competitors
Check out how we compare the company to its competitors:
Does DocuSign have a competitive advantage?
DocuSign demonstrates a sustainable competitive advantage, creating value with a ROIC exceeding its WACC by 3%, and showing a strong upward ROIC trend. Its 79.4% gross margin and 10.4% EBIT margin reflect efficient capital use and industry-leading profitability.
Looking ahead, DocuSign expands through AI-driven contract lifecycle management and industry-specific cloud solutions. Growth in non-US revenue and innovations like Remote Online Notary position the company to capture new markets and digital agreement opportunities.
SWOT Analysis
This SWOT analysis highlights DocuSign’s core strategic factors guiding its competitive stance and growth prospects.
Strengths
- Strong gross margin at 79.4%
- Growing ROIC well above WACC
- Robust product suite with AI-driven CLM
- Market leader in e-signature software
Weaknesses
- Low current and quick ratios (0.73)
- High valuation multiples (PE 34, PB 5.5)
- Recent net margin and EPS growth decline
Opportunities
- Expansion in non-US markets with 945M revenue
- AI and automation integration in contract lifecycle
- Increasing adoption in regulated industries
Threats
- Intense competition in SaaS and e-signature space
- Economic slowdown impacting enterprise IT spend
- Regulatory risks around data privacy and digital signatures
DocuSign’s strengths in profitability and innovation support sustained competitive advantage. However, liquidity concerns and valuation caution require prudent risk management. Growth hinges on international expansion and AI leverage amid rising sector competition.
Stock Price Action Analysis
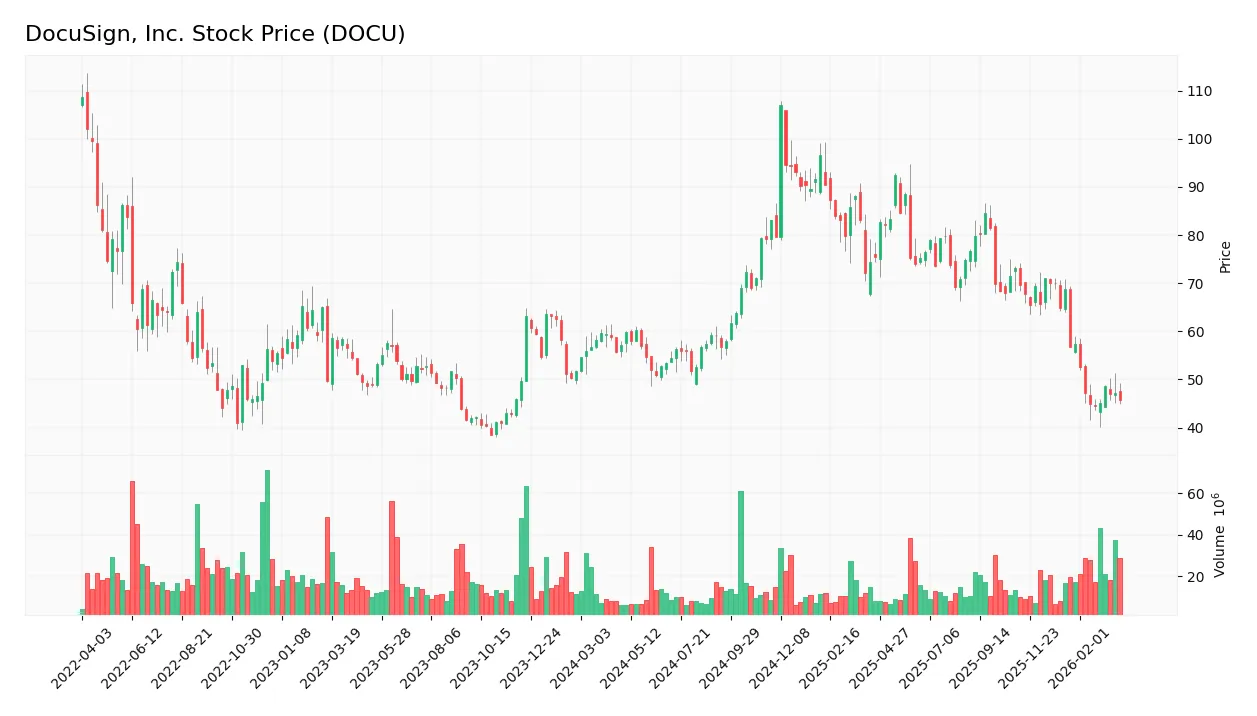
The upcoming weekly chart of DocuSign, Inc. (DOCU) highlights price movements over the past 12 months with key highs and lows:
Trend Analysis
DOCU’s stock price fell by 23.56% over the past year, confirming a bearish trend. The decline shows deceleration, with volatility at a 14.21 standard deviation. The stock peaked at 107 and bottomed at 44.5, indicating wide price swings but slowing momentum.
Volume Analysis
Over the last three months, volume increased, with sellers slightly dominating at 54.3%. Buyer activity accounts for 45.7%, reflecting cautious investor sentiment amid persistent selling pressure and moderate market participation.
Target Prices
Analysts set a clear target consensus for DocuSign, Inc., reflecting moderate upside potential.
| Target Low | Target High | Consensus |
|---|---|---|
| 45 | 80 | 68.67 |
The target range shows expectations between $45 and $80, with a consensus near $69, suggesting cautious optimism among analysts.

Don’t Let Luck Decide Your Entry Point
Optimize your entry points with our advanced ProRealTime indicators. You’ll get efficient buy signals with precise price targets for maximum performance. Start outperforming now!
Analyst & Consumer Opinions
This section examines DocuSign, Inc.’s analyst ratings and consumer feedback to gauge market sentiment and user satisfaction.
Stock Grades
Here is a concise overview of recent analyst grades for DocuSign, Inc., reflecting their latest assessments:
| Grading Company | Action | New Grade | Date |
|---|---|---|---|
| Citizens | Maintain | Market Outperform | 2026-03-18 |
| Wells Fargo | Maintain | Equal Weight | 2026-03-18 |
| Morgan Stanley | Maintain | Equal Weight | 2026-03-18 |
| JP Morgan | Maintain | Neutral | 2026-03-18 |
| Baird | Maintain | Neutral | 2026-03-18 |
| UBS | Maintain | Neutral | 2026-03-18 |
| BTIG | Maintain | Buy | 2026-03-18 |
| Piper Sandler | Maintain | Neutral | 2026-03-18 |
| Citigroup | Maintain | Buy | 2026-03-18 |
| RBC Capital | Maintain | Sector Perform | 2026-03-18 |
Analyst ratings predominantly hold steady, with a clear bias towards neutral or hold positions. A minority favor buys, indicating cautious optimism without aggressive upward revisions.
Consumer Opinions
DocuSign, Inc. evokes strong sentiments from its user base, reflecting its pivotal role in digital transaction management.
| Positive Reviews | Negative Reviews |
|---|---|
| Streamlines contract signing with ease. | Occasional glitches slow document uploads. |
| Intuitive interface boosts productivity. | Customer support response times can lag. |
| Saves significant time compared to paper. | Advanced features require steep learning curve. |
Overall, consumers praise DocuSign for simplifying workflows and enhancing efficiency. However, recurring issues with platform stability and customer service highlight areas for improvement.
Risk Analysis
Below is a summary of key risks facing DocuSign, Inc., categorized by type, with their likelihood and potential impact:
| Category | Description | Probability | Impact |
|---|---|---|---|
| Market Risk | High valuation multiples (PE 34.08, PB 5.49) increase vulnerability to market corrections. | High | High |
| Liquidity Risk | Current and quick ratios at 0.73 signal potential short-term liquidity constraints. | Medium | Medium |
| Financial Risk | Moderate Altman Z-Score (2.56) places company in grey zone, indicating some bankruptcy risk. | Medium | High |
| Competitive Risk | Intense competition in software sector pressures growth and pricing power. | High | Medium |
| Operational Risk | Dependence on continuous innovation and AI integration for competitive edge. | Medium | Medium |
| Dividend Risk | No dividend yield may deter income-focused investors, limiting appeal to certain investors. | Low | Low |
Market risk due to stretched valuation stands out as the most critical. The stock trades near its 52-week low (range 40.16–94.67) but retains a PE well above the sector average, heightening sensitivity to downturns. Liquidity metrics below 1.0 raise caution on short-term obligations despite strong interest coverage. The grey zone Altman Z-Score reflects moderate financial distress risk, warranting close monitoring. Overall, risks are balanced but favor prudence given the sector’s cyclical volatility and innovation demands.
Should You Buy DocuSign, Inc.?
DocuSign appears to be generating improving profitability with strong value creation supported by a durable competitive moat as ROIC significantly outpaces WACC. Despite a manageable leverage profile, liquidity ratios suggest caution. The overall B+ rating reflects a very favorable but nuanced financial stance.
Strength & Efficiency Pillars
DocuSign, Inc. exhibits operational efficiency with a solid gross margin of 79.4% and an EBIT margin of 10.42%. The return on equity stands at a favorable 16.12%, while the return on invested capital (ROIC) at 12.04% exceeds the weighted average cost of capital (WACC) of 8.98%. This differential confirms DocuSign as a clear value creator. I observe a growing ROIC trend, signaling sustainable competitive advantages and improving profitability over time.
Weaknesses and Drawbacks
DocuSign operates within the Altman Z-Score grey zone at 2.56, indicating moderate financial stress but no immediate bankruptcy risk. Valuation metrics raise caution: the price-to-earnings ratio at 34.08 and price-to-book ratio at 5.49 signal a premium market valuation that may be vulnerable to downturns. Liquidity is a concern with a current ratio of 0.73, suggesting potential short-term cash flow constraints. Recent seller dominance at 54.27% and a bearish overall stock trend further heighten market pressure risks.
Our Final Verdict about DocuSign, Inc.
DocuSign’s fundamentals suggest a solid value creation profile bolstered by strong operational margins and efficient capital allocation. However, the moderate solvency risk and stretched valuation metrics imply caution. Despite its long-term strength, recent market pressure and liquidity concerns suggest a wait-and-see approach may be prudent. This profile might appear attractive for investors with a higher risk tolerance but remains speculative for conservative capital.
Disclaimer: This content is for informational purposes only and does not constitute financial, investment, or other professional advice. Investing in financial markets involves a significant risk of loss, and past performance is not indicative of future results.
Additional Resources
- Analysts maintain neutral outlook on DocuSign, Inc. (DOCU) despite solid results – MSN (Mar 28, 2026)
- SG Americas Securities LLC Acquires 226,076 Shares of Docusign Inc. $DOCU – MarketBeat (Mar 28, 2026)
- Docusign Inc (DOCU) Stock Price Down 4.69% on Mar 24 – GuruFocus (Mar 24, 2026)
- DOCU Stock Price, Quote & Chart | DOCUSIGN INC (NASDAQ:DOCU) – ChartMill (Mar 24, 2026)
- Docusign Named to Fast Company’s Annual List of the World’s Most Innovative Companies of 2026 – PR Newswire (Mar 24, 2026)
For more information about DocuSign, Inc., please visit the official website: DocuSign.com