Home > Analyses > Real Estate > Digital Realty Trust, Inc.
Digital Realty Trust, Inc. powers the digital backbone of global enterprises, enabling seamless data flow across continents. Its PlatformDIGITALR delivers scalable data center, colocation, and interconnection solutions, connecting over 280 facilities worldwide. Known for innovation and operational excellence, Digital Realty shapes how businesses manage digital infrastructure. As data demands soar, I question whether its robust fundamentals still justify its premium valuation and growth prospects in 2026.

Table of contents
Business Model & Company Overview
Digital Realty Trust, Inc. stands as a global leader in the REIT – Office sector, founded in 2004 and headquartered in Dallas, TX. It operates a vast ecosystem of data center, colocation, and interconnection solutions under its PlatformDIGITALR brand. The company’s 284 facilities span 48 metros across 23 countries, delivering a seamless digital infrastructure that supports enterprises and service providers worldwide.
Its revenue engine balances robust hardware infrastructure with scalable software-driven services, addressing the growing demands of digital business and data gravity challenges. Digital Realty’s strategic footprint covers the Americas, Europe, and Asia, enabling customers to tap into vital connected communities. The company’s enduring competitive advantage lies in its pervasive global platform that shapes the future of digital real estate.
Financial Performance & Fundamental Metrics
I analyze Digital Realty Trust, Inc.’s income statement, key financial ratios, and dividend payout policy to assess its core financial health and shareholder value creation.
Income Statement
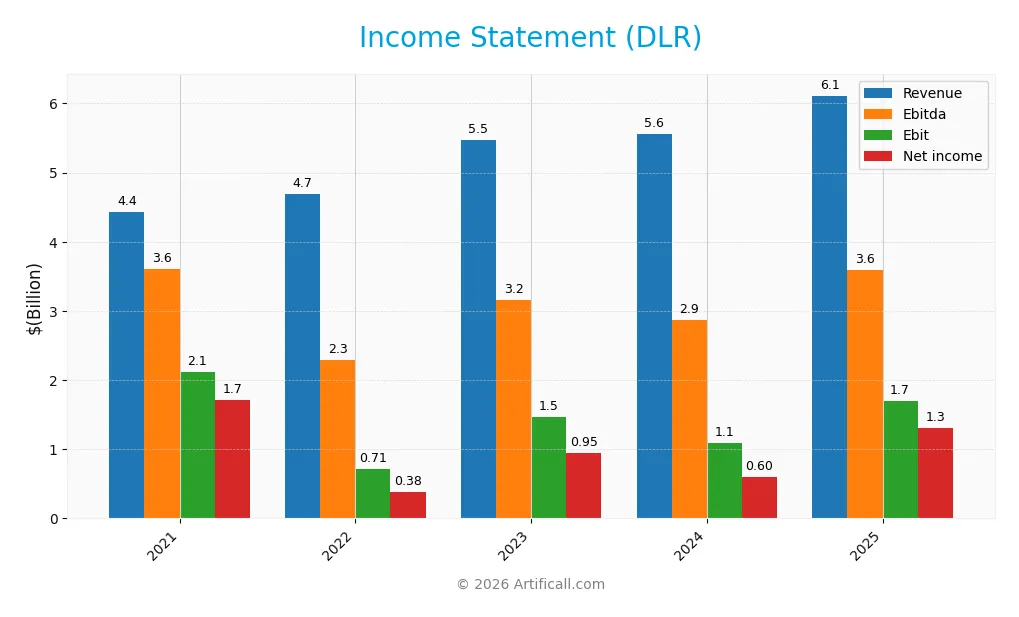
The table below summarizes key income statement figures for Digital Realty Trust, Inc. (DLR) over the past five fiscal years.
| 2021 | 2022 | 2023 | 2024 | 2025 | |
|---|---|---|---|---|---|
| Revenue | 4.43B | 4.69B | 5.48B | 5.55B | 6.11B |
| Cost of Revenue | 1.78B | 2.02B | 2.60B | 2.52B | 2.73B |
| Operating Expenses | 1.96B | 2.08B | 2.35B | 2.56B | 2.73B |
| Gross Profit | 2.65B | 2.67B | 2.88B | 3.04B | 3.39B |
| EBITDA | 3.60B | 2.29B | 3.16B | 2.87B | 3.59B |
| EBIT | 2.11B | 711M | 1.46B | 1.10B | 1.69B |
| Interest Expense | 294M | 299M | 438M | 453M | 438M |
| Net Income | 1.71B | 378M | 949M | 602M | 1.31B |
| EPS | 5.95 | 1.18 | 3.04 | 1.74 | 3.73 |
| Filing Date | 2022-02-25 | 2023-02-27 | 2024-02-23 | 2025-02-25 | 2026-02-13 |
Income Statement Evolution
Digital Realty Trust’s revenue increased steadily by 10% in 2025, continuing a 38% rise since 2021. Gross profit grew 11.5% last year, sustaining a strong 55.4% margin. However, net income declined 23.4% over five years, with net margin contracting 44.5%, indicating margin pressure despite recent recovery. Operating expenses grew in line with revenue.
Is the Income Statement Favorable?
In 2025, DLR posted a 21.4% net margin, up nearly 100% year-over-year, reflecting significant profitability improvement. EBIT surged 54%, aided by controlled interest expenses at 7.2% of revenue. EPS growth exceeded 120%, signaling efficient capital allocation. Overall, fundamentals appear favorable, bolstered by margin expansion and strong top-line growth, despite past net income volatility.
Financial Ratios
The following table presents key financial ratios for Digital Realty Trust, Inc. (DLR) over recent fiscal years, highlighting profitability, liquidity, valuation, and leverage metrics:
| Ratios | 2021 | 2022 | 2023 | 2024 | 2025 |
|---|---|---|---|---|---|
| Net Margin | 39% | 8.0% | 17% | 11% | 21% |
| ROE | 9.5% | 2.1% | 5.0% | 2.8% | 5.7% |
| ROIC | 2.0% | 1.4% | 1.2% | 1.0% | 1.4% |
| P/E | 29.2 | 76.0 | 42.4 | 95.2 | 40.6 |
| P/B | 2.77 | 1.63 | 2.10 | 2.69 | 2.32 |
| Current Ratio | 0.31 | 0.23 | 0.70 | 1.11 | 1.36 |
| Quick Ratio | 0.31 | 0.23 | 0.70 | 1.11 | 1.36 |
| D/E | 0.83 | 1.03 | 0.99 | 0.84 | 0.86 |
| Debt-to-Assets | 41% | 44% | 43% | 40% | 40% |
| Interest Coverage | 2.36 | 1.97 | 1.20 | 1.04 | 1.50 |
| Asset Turnover | 0.12 | 0.11 | 0.12 | 0.12 | 0.12 |
| Fixed Asset Turnover | 3.15 | 3.47 | 3.87 | 4.71 | 0.23 |
| Dividend Yield | 2.8% | 5.1% | 3.8% | 2.8% | 3.3% |
I note the spike in fixed asset turnover in 2024 and a sharp drop in 2025, indicating possible asset base changes. The current ratio improves steadily, reflecting better liquidity. Interest coverage remains low, signaling tighter debt servicing capacity compared to typical investment-grade benchmarks.
Evolution of Financial Ratios
From 2021 to 2025, Digital Realty Trust’s ROE declined from 9.49% to 5.71%, indicating a slowdown in profitability. The current ratio improved significantly, rising from 0.31 to 1.36, reflecting enhanced liquidity. Debt-to-equity remained relatively stable near 0.86, signaling consistent leverage management despite profitability fluctuations.
Are the Financial Ratios Favorable?
In 2025, profitability shows mixed signals: a strong net margin at 21.41% contrasts with a weak ROE of 5.71% and low asset turnover of 0.12. Liquidity is solid with a quick ratio of 1.36, but leverage metrics such as debt-to-assets at 39.78% and interest coverage near 3.87 are neutral. Market ratios like P/E at 40.61 appear unfavorable, while dividend yield at 3.25% is favorable. Overall, the financial ratios tilt slightly unfavorable.
Shareholder Return Policy
Digital Realty Trust, Inc. maintains a consistent dividend, with a payout ratio exceeding 100% in recent years, supported by stable free cash flow. The 2025 dividend yield stands at 3.25%, complemented by ongoing share buybacks.
This distribution strategy carries risks of unsustainable payouts. However, coverage by free cash flow and buybacks indicates a focus on shareholder value. The policy suggests a balance between income and capital return, supporting long-term value creation.
Score analysis
The following radar chart illustrates Digital Realty Trust’s key financial scores across valuation, profitability, and leverage metrics:
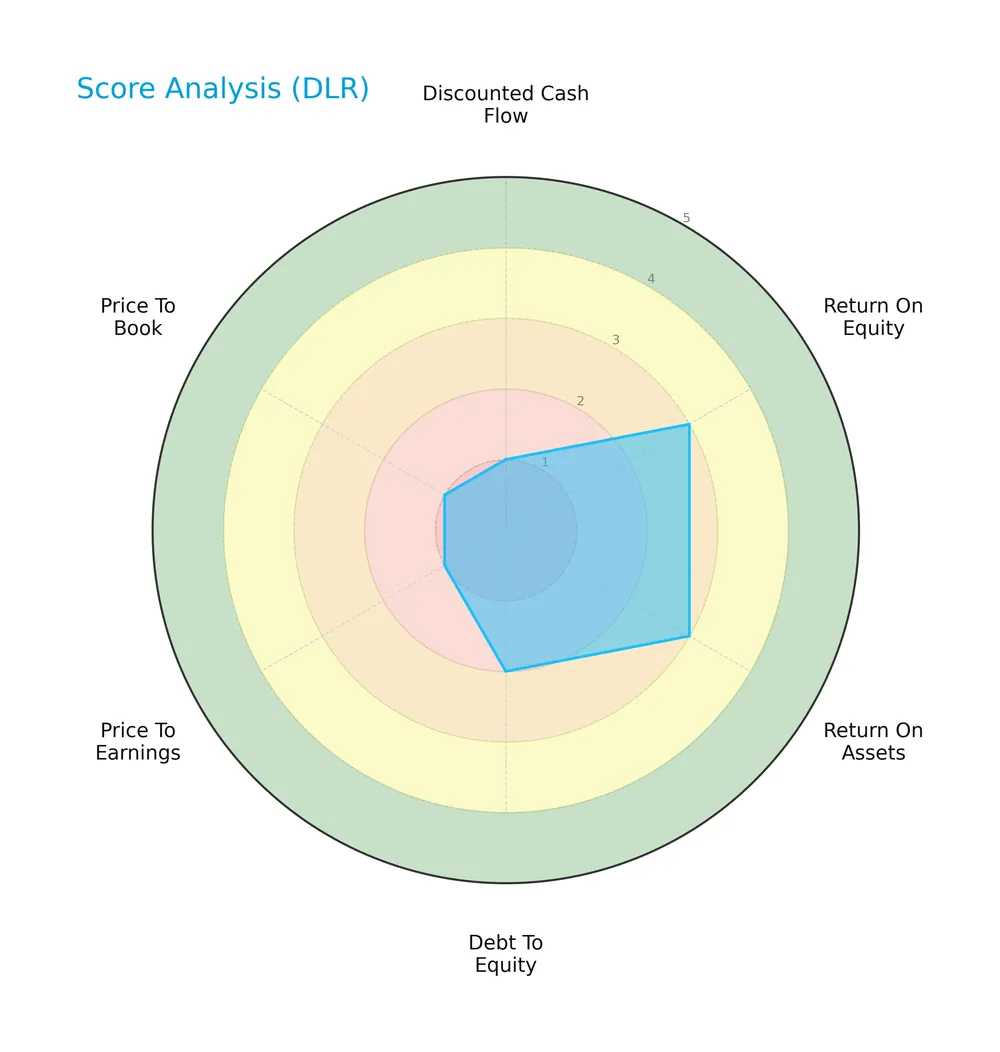
The company shows moderate profitability with Return on Equity and Assets scores at 3. However, valuation metrics like Price to Earnings and Price to Book scores are very unfavorable at 1. Debt to Equity is also unfavorable at 2, while the Discounted Cash Flow score is very unfavorable at 1.
Analysis of the company’s bankruptcy risk
Digital Realty Trust currently falls into the distress zone with an Altman Z-Score of 1.6, indicating a high risk of financial distress and potential bankruptcy:

Is the company in good financial health?
The Piotroski Score diagram below summarizes the company’s financial strength using nine accounting criteria:

With a score of 7, Digital Realty Trust demonstrates strong financial health, suggesting good operational efficiency and profitability despite some valuation and leverage concerns.
Competitive Landscape & Sector Positioning
This sector analysis examines Digital Realty Trust, Inc.’s strategic positioning, revenue breakdown, key products, and main competitors. I will evaluate whether Digital Realty maintains a competitive advantage within the REIT – Office industry.
Strategic Positioning
Digital Realty Trust concentrates on data center rental and services, generating $5.5B in 2024, split nearly evenly between the US ($2.9B) and international markets ($2.6B). Its portfolio spans 284 facilities across 23 countries, emphasizing a global footprint in digital infrastructure.
Revenue by Segment
This pie chart illustrates Digital Realty Trust, Inc.’s revenue distribution by segment for the fiscal year 2024, highlighting shifts and growth trends across its business lines.
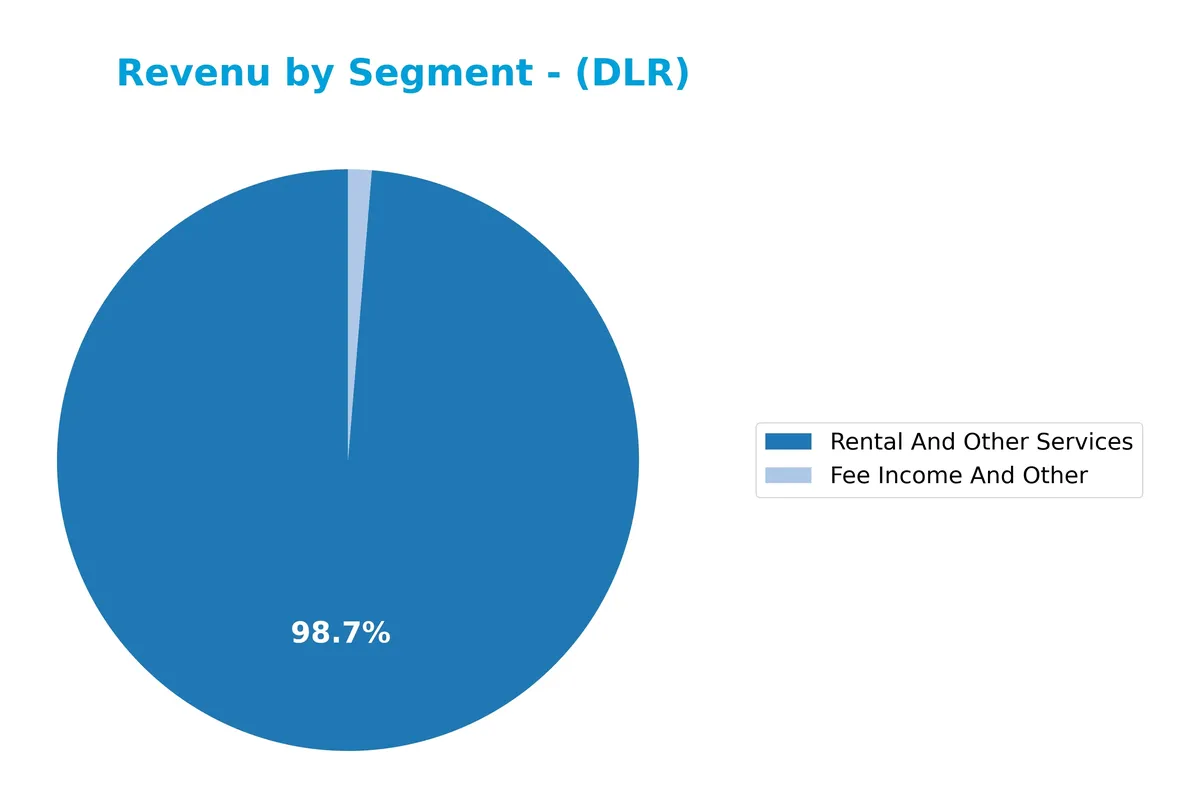
Rental and Other Services dominate Digital Realty’s revenue, reaching $5.48B in 2024, up from $5.43B in 2023, reflecting steady demand for data center leasing. Fee Income and Other, though smaller at $72M, nearly doubled from the prior year, signaling a growing contribution from ancillary services. The concentration remains heavily weighted towards Rental Services, underscoring a core strength but also a concentration risk if market dynamics shift.
Key Products & Brands
Digital Realty Trust generates revenue primarily from data center rental services and ancillary fee income:
| Product | Description |
|---|---|
| Rental And Other Services | Leasing data center space and providing related infrastructure services to enterprises and providers. |
| Fee Income And Other | Ancillary revenue from data center-related services beyond core rentals, including platform offerings. |
Digital Realty’s key revenue stream is data center rentals, which amounted to $5.48B in 2024. Fee income, while smaller at $72M, reflects additional service diversification supporting its global data center platform.
Main Competitors
There are 3 competitors in total, with the table below listing the top 3 leaders by market capitalization:
| Competitor | Market Cap. |
|---|---|
| Digital Realty Trust, Inc. | 53.3B |
| BXP, Inc. | 10.7B |
| Alexandria Real Estate Equities, Inc. | 8.5B |
Digital Realty Trust, Inc. ranks 1st among its competitors and has a market cap 17% larger than the nearest rival. It stands well above both the average market cap of the top 10 and the sector median. The gap to the next competitor is substantial, highlighting Digital Realty’s dominant scale in its segment.
Comparisons with competitors
Check out how we compare the company to its competitors:
Does DLR have a competitive advantage?
Digital Realty Trust, Inc. does not exhibit a competitive advantage based on its ROIC falling 6.3% below WACC and a declining ROIC trend. This indicates value destruction and weakening profitability over 2021-2025.
Looking ahead, Digital Realty’s extensive global footprint with 284 data centers across 23 countries supports potential growth through expanding data center demand and interconnection solutions. The company’s PlatformDIGITALR offers scalable digital business infrastructure that may unlock new market opportunities.
SWOT Analysis
This SWOT analysis highlights key strategic factors shaping Digital Realty Trust, Inc.’s position and future prospects.
Strengths
- Strong global footprint with 284 facilities in 23 countries
- Robust revenue growth of 10% in 2025
- Favorable net margin at 21.4%
Weaknesses
- Declining ROIC below WACC indicates value destruction
- Low asset turnover signals inefficient asset use
- High P/E ratio of 40.6 suggests overvaluation risk
Opportunities
- Expansion in high-growth international markets
- Rising demand for data center and interconnection services
- Leveraging PlatformDIGITAL and PDxTM solutions for differentiation
Threats
- Intense competition in data center REIT sector
- Macroeconomic risks affecting real estate valuations
- Rising interest rates increasing financing costs
Digital Realty’s strengths in scale and revenue growth support market leadership, but declining profitability metrics and valuation caution warrant vigilance. Strategic focus should target operational efficiency and international expansion to mitigate competitive and macro risks.
Stock Price Action Analysis
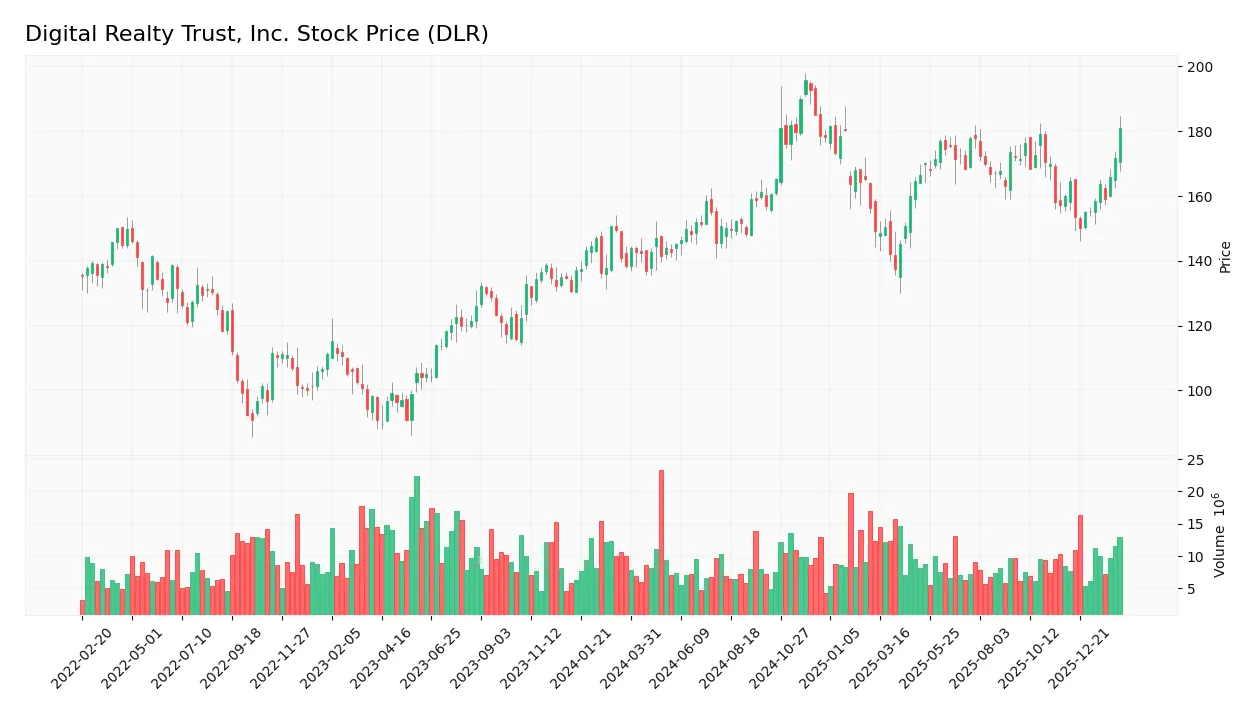
The weekly stock chart of Digital Realty Trust, Inc. (DLR) highlights price movements and volatility trends over the last 12 months:
Trend Analysis
Over the past year, DLR’s stock price rose 30.65%, marking a clear bullish trend with accelerating momentum. The price ranged between 136.83 and 195.69, reflecting robust upward movement. Volatility remains elevated with a standard deviation of 13.52%, signaling sustained price fluctuations during this advance.
Volume Analysis
Trading volume has decreased overall, with buyers accounting for 49.22% historically. However, in the recent three months, buyer volume surged to 70.59%, strongly dominating sellers. This shift indicates heightened investor confidence and increased market participation on the buy side despite the general volume decline.
Target Prices
Analysts show a strong consensus on Digital Realty Trust’s target price, reflecting confidence in its growth prospects.
| Target Low | Target High | Consensus |
|---|---|---|
| 164 | 210 | 188.3 |
The target range suggests moderate upside potential, with a consensus price well above current levels, signaling bullish analyst sentiment.

Don’t Let Luck Decide Your Entry Point
Optimize your entry points with our advanced ProRealTime indicators. You’ll get efficient buy signals with precise price targets for maximum performance. Start outperforming now!
Analyst & Consumer Opinions
This section examines the latest analyst ratings and consumer feedback related to Digital Realty Trust, Inc. (DLR).
Stock Grades
Here are the latest verified stock grades for Digital Realty Trust, Inc., showing analyst perspectives and recent changes:
| Grading Company | Action | New Grade | Date |
|---|---|---|---|
| Citigroup | maintain | Buy | 2026-02-06 |
| Stifel | maintain | Buy | 2026-02-06 |
| HSBC | upgrade | Buy | 2026-01-15 |
| Scotiabank | maintain | Sector Outperform | 2026-01-14 |
| Barclays | upgrade | Equal Weight | 2026-01-13 |
| Mizuho | maintain | Outperform | 2026-01-12 |
| B of A Securities | downgrade | Neutral | 2026-01-08 |
| Truist Securities | maintain | Buy | 2025-11-05 |
| Citigroup | maintain | Buy | 2025-10-29 |
| Barclays | maintain | Underweight | 2025-10-27 |
The consensus leans bullish with most firms maintaining or upgrading to buy ratings, although a few neutral and underweight stances indicate some caution. The mix reflects nuanced views on the stock’s near-term outlook.
Consumer Opinions
Digital Realty Trust, Inc. (DLR) garners mixed reactions from its user base, reflecting diverse experiences with its services.
| Positive Reviews | Negative Reviews |
|---|---|
| Reliable data center infrastructure. | Customer support response times are slow. |
| Strong network connectivity and uptime. | Pricing perceived as high compared to peers. |
| Flexible leasing options for various business sizes. | Some complaints about contract rigidity. |
Overall, consumers appreciate Digital Realty’s robust infrastructure and network reliability. However, recurring concerns include customer service delays and pricing issues, signaling areas for improvement to enhance client satisfaction.
Risk Analysis
Below is a table summarizing key risks facing Digital Realty Trust, Inc. in 2026:
| Category | Description | Probability | Impact |
|---|---|---|---|
| Financial Health | Altman Z-Score at 1.6 signals distress zone, indicating bankruptcy risk. | Medium | High |
| Valuation | Elevated P/E of 40.6 suggests overvaluation risk amid market shifts. | High | Medium |
| Profitability | Low ROIC (1.39%) below WACC (7.7%) signals suboptimal capital returns. | High | High |
| Leverage | Debt-to-equity ratio of 0.86 is neutral but interest coverage at 3.87 is modest. | Medium | Medium |
| Operational Efficiency | Unfavorable asset turnover ratios (0.12) highlight inefficiencies. | Medium | Medium |
I consider the combination of weak profitability and a distress-level Altman Z-Score as the most critical risk. Despite a strong Piotroski score of 7, these financial vulnerabilities expose DLR to potential distress if economic conditions tighten. The high valuation amplifies downside risk amid market volatility. Investors should weigh these factors carefully before committing capital.
Should You Buy Digital Realty Trust, Inc.?
Digital Realty Trust, Inc. appears to be grappling with declining profitability and a deteriorating competitive moat, suggesting value destruction. Despite a manageable leverage profile, its overall rating of C reflects financial challenges. This analytical interpretation signals caution.
Strength & Efficiency Pillars
Digital Realty Trust, Inc. posts solid operational margins with a gross margin of 55.39%, EBIT margin at 27.69%, and net margin of 21.41%. These figures reflect effective cost control and pricing power. However, the company’s return on invested capital (ROIC) stands at a disappointing 1.39%, well below its weighted average cost of capital (WACC) of 7.7%. This signals that Digital Realty is currently destroying value rather than creating it, highlighting underlying inefficiencies despite strong profitability metrics.
Weaknesses and Drawbacks
Digital Realty is in financial distress, as indicated by an Altman Z-Score of 1.60, below the critical 1.8 threshold, signaling a high bankruptcy risk. This solvency warning overrides other financial positives. The valuation is stretched, with a price-to-earnings ratio of 40.61, suggesting an expensive market premium. Additionally, the company’s asset turnover ratios are unfavorable, reflecting inefficient asset utilization. While leverage metrics like debt-to-equity at 0.86 appear neutral, the distressed financial condition casts a shadow on leverage sustainability.
Our Final Verdict about Digital Realty Trust, Inc.
Despite strong operational margins and a bullish stock trend, Digital Realty’s low Altman Z-Score exposes it to significant solvency risk. This financial distress makes the investment profile highly speculative and too risky for conservative capital. Investors might consider waiting for clearer signs of balance sheet stabilization before allocating long-term capital.
Disclaimer: This content is for informational purposes only and does not constitute financial, investment, or other professional advice. Investing in financial markets involves a significant risk of loss, and past performance is not indicative of future results.
Additional Resources
- Digital Realty Trust, Inc. $DLR Holdings Lifted by ING Groep NV – MarketBeat (Feb 13, 2026)
- Digital Realty Q4 2025: Stability And Growth Without Surprises (NYSE:DLR) – Seeking Alpha (Feb 13, 2026)
- Digital Realty Trust (DLR): Strong Growth Outlook, Strategic Expansion, and Positive Analyst Sentiment Fuel REIT Potential – Yahoo Finance (Feb 10, 2026)
- The Bull Case For Digital Realty Trust (DLR) Could Change Following Mixed 2025 Earnings And 2026 Guidance – Learn Why – simplywall.st (Feb 10, 2026)
- A Look At Digital Realty Trust’s Valuation As AI Demand And 2026 Guidance Support Record Bookings – Sahm (Feb 12, 2026)
For more information about Digital Realty Trust, Inc., please visit the official website: digitalrealty.com