Home > Analyses > Energy > Diamondback Energy, Inc.
Diamondback Energy, Inc. powers a significant portion of America’s energy landscape by unlocking vast oil and natural gas reserves in the Permian Basin, one of the most prolific onshore basins in the United States. As a top independent player in oil and gas exploration and production, Diamondback is renowned for its operational efficiency, innovative development strategies, and expansive midstream infrastructure. With energy markets evolving rapidly, I explore whether Diamondback’s solid fundamentals and strategic position continue to support its growth and valuation potential.
Table of contents
Business Model & Company Overview
Diamondback Energy, Inc., founded in 2007 and headquartered in Midland, Texas, stands as a leading independent oil and natural gas company specializing in the Permian Basin’s onshore unconventional resources. It operates a tightly integrated ecosystem centered on the acquisition, development, and exploitation of key formations like Spraberry, Wolfcamp, and Bone Spring, leveraging nearly 525K gross acres and a vast portfolio of producing and royalty wells to dominate its niche in the energy sector.
The company’s revenue engine hinges on a balanced mix of upstream exploration and production alongside midstream infrastructure, including 866 miles of pipelines and an integrated water system servicing the Permian. This diversified asset base underpins its footprint across the Americas, with critical operations that bolster sustainable value capture. Diamondback’s robust asset control and operational integration form a formidable economic moat, positioning it to shape the future of energy production in one of the world’s most prolific basins.
Financial Performance & Fundamental Metrics
In this section, I analyze Diamondback Energy, Inc.’s income statement, key financial ratios, and dividend payout policy to assess its fundamental strength.
Income Statement
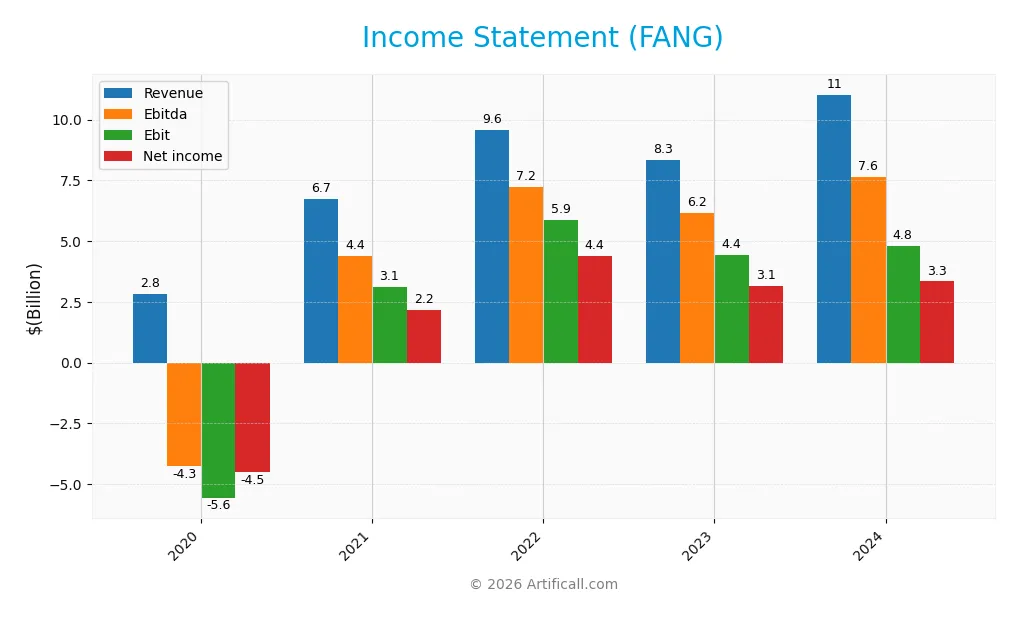
The table below presents Diamondback Energy, Inc. (FANG) income statement figures in USD for fiscal years 2020 through 2024, reflecting key profitability metrics and earnings per share.
| 2020 | 2021 | 2022 | 2023 | 2024 | |
|---|---|---|---|---|---|
| Revenue | 2.81B | 6.75B | 9.57B | 8.34B | 11.02B |
| Cost of Revenue | 2.18B | 2.48B | 2.87B | 3.54B | 6.05B |
| Operating Expenses | 6.11B | 269M | 193M | 228M | 576M |
| Gross Profit | 637M | 4.27B | 6.70B | 4.80B | 4.97B |
| EBITDA | -4.27B | 4.37B | 7.23B | 6.17B | 7.64B |
| EBIT | -5.58B | 3.10B | 5.88B | 4.42B | 4.79B |
| Interest Expense | 201M | 200M | 160M | 175M | 291M |
| Net Income | -4.52B | 2.18B | 4.39B | 3.14B | 3.34B |
| EPS | -28.59 | 12.35 | 24.61 | 17.34 | 15.53 |
| Filing Date | 2021-02-25 | 2022-02-24 | 2023-02-23 | 2024-02-22 | 2025-02-26 |
Income Statement Evolution
From 2020 to 2024, Diamondback Energy, Inc. (FANG) exhibited strong revenue growth of 292%, reaching $11B in 2024. Net income also increased substantially by 174% over the period, although it declined by 6% from 2023 to 2024. Gross and EBIT margins remained stable and favorable, around 45% and 43% respectively, indicating consistent operational efficiency despite some margin pressure in the latest year.
Is the Income Statement Favorable?
In 2024, FANG reported a net income of $3.34B with a net margin of 30.3%, reflecting a slight margin contraction year-over-year. Revenue growth of 32% was favorable, but net margin and EPS declined by roughly 20% and 10%, respectively, signaling some cost or expense challenges. Interest expense remained low relative to revenue at 2.6%. Overall, the income statement fundamentals are generally favorable, supported by strong profitability and growth, with a few cautionary signals in margin trends.
Financial Ratios
The table below presents key financial ratios for Diamondback Energy, Inc. (FANG) over the fiscal years 2020 to 2024, reflecting profitability, valuation, liquidity, leverage, and efficiency:
| Ratios | 2020 | 2021 | 2022 | 2023 | 2024 |
|---|---|---|---|---|---|
| Net Margin | -160% | 32% | 46% | 38% | 30% |
| ROE | -51% | 18% | 29% | 19% | 9% |
| ROIC | -27% | 15% | 21% | 13% | 6% |
| P/E | -1.7 | 8.7 | 5.5 | 8.9 | 10.5 |
| P/B | 0.87 | 1.58 | 1.61 | 1.68 | 0.93 |
| Current Ratio | 0.49 | 1.01 | 0.81 | 0.77 | 0.44 |
| Quick Ratio | 0.46 | 0.96 | 0.77 | 0.74 | 0.41 |
| D/E | 0.67 | 0.56 | 0.43 | 0.41 | 0.33 |
| Debt-to-Assets | 34% | 30% | 24% | 23% | 18% |
| Interest Coverage | -27 | 20 | 41 | 26 | 15 |
| Asset Turnover | 0.16 | 0.29 | 0.36 | 0.29 | 0.16 |
| Fixed Asset Turnover | 0.17 | 0.33 | 0.40 | 0.31 | 0.17 |
| Dividend Yield | 3.1% | 1.6% | 6.5% | 5.2% | 4.5% |
Evolution of Financial Ratios
From 2020 to 2024, Diamondback Energy, Inc. (FANG) experienced a decline in Return on Equity (ROE), dropping from a negative -51.36% in 2020 to 8.85% in 2024, indicating some recovery but remaining relatively low. The Current Ratio decreased steadily from above 1.0 in 2021 to 0.44 in 2024, showing reduced short-term liquidity. The Debt-to-Equity Ratio improved from 0.67 in 2020 to 0.33 in 2024, reflecting lower leverage. Profitability margins notably contracted over this period.
Are the Financial Ratios Favorable?
In 2024, FANG’s profitability is marked by a favorable net margin of 30.28%, though ROE at 8.85% is considered unfavorable. Liquidity ratios, including a current ratio of 0.44 and quick ratio of 0.41, are unfavorable, suggesting potential short-term financial stress. Leverage ratios, such as debt-to-equity at 0.33 and debt-to-assets at 18.47%, are favorable, indicating controlled debt levels. Efficiency ratios like asset turnover at 0.16 and fixed asset turnover at 0.17 are unfavorable, while market valuation metrics like P/E of 10.48 and dividend yield of 4.51% are favorable. Overall, 57.14% of key ratios are positive, supporting a generally favorable financial profile.
Shareholder Return Policy
Diamondback Energy, Inc. maintains a dividend payout ratio near 47%, with a dividend yield around 4.5% in 2024, supported by a stable dividend per share trend. However, free cash flow coverage is negative, indicating potential risk in sustaining distributions without relying on external funding or asset sales.
The company does not report active share buybacks despite consistent dividend payments. While dividends provide income, the negative free cash flow coverage suggests caution, as this may limit long-term value creation if cash generation does not improve or capital expenditures remain high.
Score analysis
The following radar chart illustrates the company’s key financial scores, offering a snapshot of its valuation and profitability metrics:
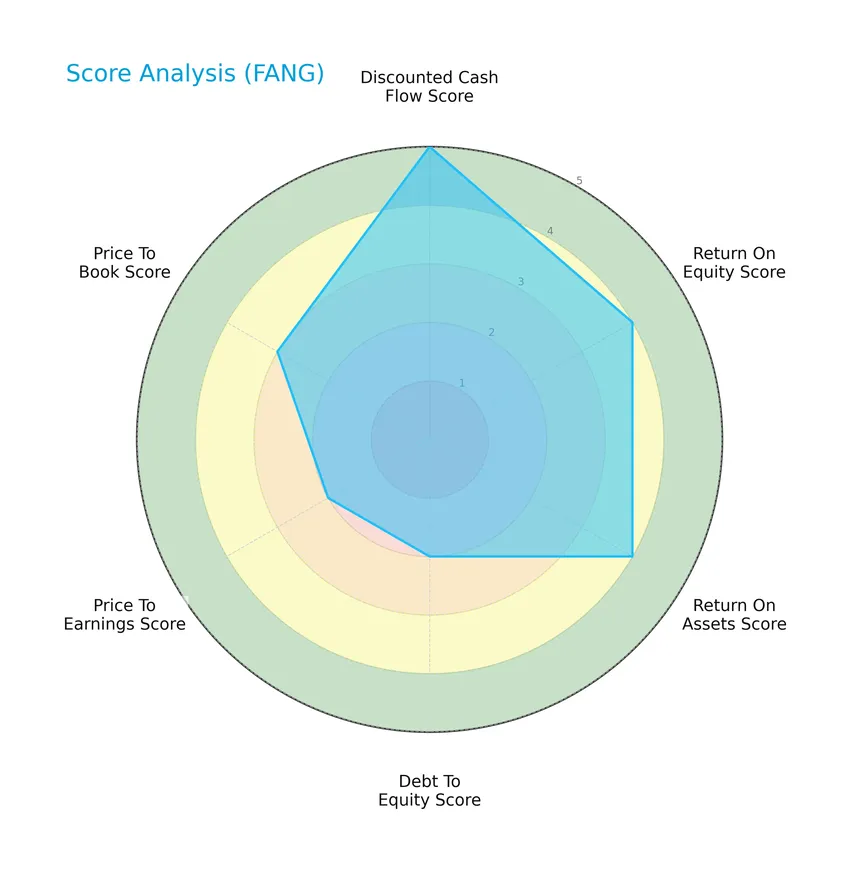
Diamondback Energy, Inc. shows a very favorable discounted cash flow score of 5 and favorable returns on equity and assets at 4 each. However, moderate scores on debt to equity (2), price to earnings (2), and price to book (3) suggest caution in leverage and valuation metrics.
Analysis of the company’s bankruptcy risk
The Altman Z-Score places the company in the distress zone, indicating a higher risk of bankruptcy and financial distress based on key financial ratios:

Is the company in good financial health?
The Piotroski Score diagram highlights the company’s financial strength assessment based on nine criteria:

With a Piotroski Score of 5, Diamondback Energy, Inc. is considered to have average financial health, reflecting moderate profitability, leverage, and efficiency indicators.
Competitive Landscape & Sector Positioning
This sector analysis will examine Diamondback Energy, Inc.’s strategic positioning, revenue segments, key products, competitors, and competitive advantages. I will assess whether the company holds a distinct competitive advantage within the oil and gas exploration and production industry.
Strategic Positioning
Diamondback Energy, Inc. concentrates its operations in the Permian Basin across West Texas and New Mexico, primarily focusing on upstream oil and gas exploration and production. It maintains a significant midstream presence with pipeline infrastructure, reflecting a focused but vertically integrated strategy within a specific geographic area.
Revenue by Segment
This pie chart illustrates Diamondback Energy, Inc.’s revenue distribution by segment for the fiscal year 2023, highlighting the contributions of upstream and midstream services.
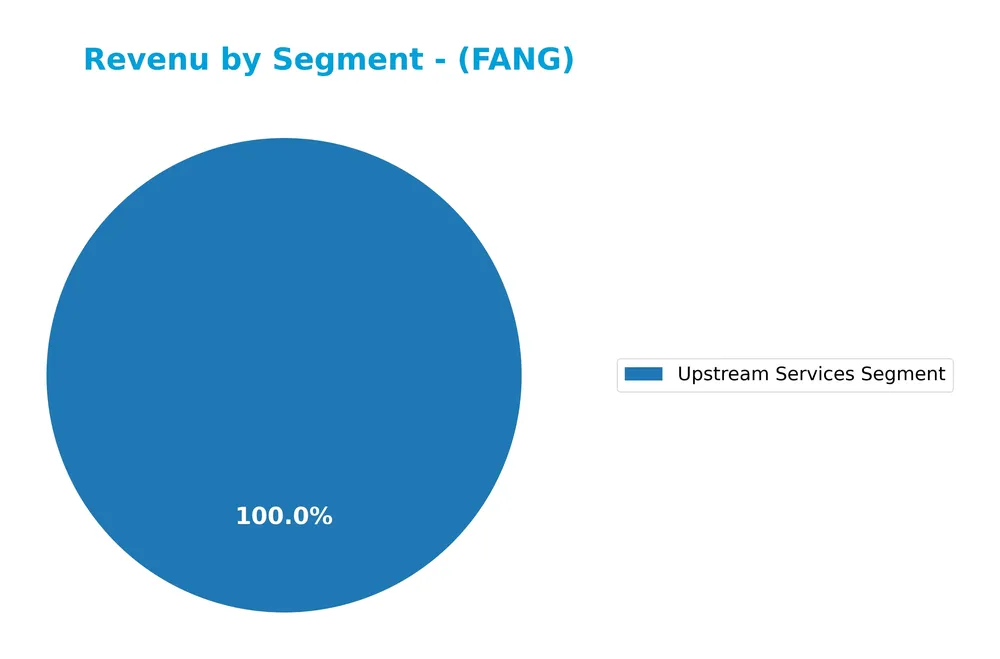
The upstream services segment dominates Diamondback Energy’s revenue, with 8.3B in 2023, despite a decline from 9.6B in 2022. Midstream services contributed 440M in 2022 but were not reported in 2023, indicating a possible shift or reclassification. Over the years, upstream services have shown significant growth from 2.8B in 2020 to a peak in 2022, followed by a moderate slowdown, signaling concentration risk in this core segment.
Key Products & Brands
The table below presents Diamondback Energy, Inc.’s main products and services across its business segments:
| Product | Description |
|---|---|
| Upstream Services Segment | Focuses on acquisition, development, exploration, and production of unconventional oil and natural gas reserves in the Permian Basin. |
| Midstream Services Segment | Owns and operates midstream infrastructure including crude oil and natural gas gathering pipelines and an integrated water system in the Midland and Delaware Basins. |
| Natural Gas Liquids Production | Production of natural gas liquids as part of the company’s hydrocarbon output (reported in 2018). |
| Natural Gas Production | Extraction and production of natural gas reserves (reported in 2018). |
| Oil Exploration and Production | Exploration and production of oil reserves, notably from Spraberry, Wolfcamp, and Bone Spring formations. |
| Royalty Interests | Holds mineral and royalty interests across extensive acreage in the Permian Basin and Eagle Ford Shale. |
Diamondback Energy’s product mix centers on upstream oil and gas activities supported by midstream infrastructure, with significant natural gas liquids and royalty interests complementing its core operations.
Main Competitors
There are 10 main competitors in the Oil & Gas Exploration & Production industry; the table below lists the top 10 leaders by market capitalization:
| Competitor | Market Cap. |
|---|---|
| ConocoPhillips | 120.5B |
| EOG Resources, Inc. | 58.8B |
| Diamondback Energy, Inc. | 44.3B |
| Occidental Petroleum Corporation | 41.8B |
| EQT Corporation | 33.4B |
| Expand Energy Corporation | 26.1B |
| Devon Energy Corporation | 24.2B |
| Texas Pacific Land Corporation | 20.5B |
| Coterra Energy Inc. | 20.3B |
| APA Corporation | 9.0B |
Diamondback Energy, Inc. ranks 3rd among its competitors with a market cap approximately 37% that of the sector leader, ConocoPhillips. The company is positioned above both the average market cap of the top 10 competitors (39.9B) and the sector median (29.8B). It maintains a solid 31.8% market cap lead over its closest competitor below, Occidental Petroleum Corporation.
Comparisons with competitors
Check out how we compare the company to its competitors:
Does FANG have a competitive advantage?
Diamondback Energy, Inc. currently does not demonstrate a clear competitive advantage, as its return on invested capital (ROIC) is below the weighted average cost of capital (WACC), indicating the company is shedding value despite a slightly favorable moat status. However, the company maintains favorable profitability metrics with a gross margin of 45.11% and net margin of 30.28%, supported by growing revenue and net income over recent years.
Looking ahead, Diamondback Energy’s focus on developing unconventional oil and natural gas reserves in the Permian Basin, alongside ownership of extensive midstream infrastructure, positions it for potential growth opportunities. The company’s expanding acreage and integrated operations in key formations such as Spraberry, Wolfcamp, and Bone Spring may offer future avenues to enhance operational efficiency and profitability.
SWOT Analysis
This SWOT analysis highlights the key internal and external factors affecting Diamondback Energy, Inc. to support informed investment decisions.
Strengths
- strong revenue growth of 291.86% over 5 years
- favorable net margin at 30.28%
- significant acreage and reserves in Permian Basin
Weaknesses
- low current and quick ratios indicating liquidity concerns
- below average ROE at 8.85%
- Altman Z-score in distress zone signaling financial risk
Opportunities
- expanding midstream infrastructure assets
- rising oil demand supporting price recovery
- potential operational efficiencies in Spraberry and Wolfcamp formations
Threats
- volatile commodity prices impacting revenues
- regulatory and environmental risks in energy sector
- competition in unconventional oil production
Overall, Diamondback Energy shows strong profitability and growth potential but faces liquidity challenges and financial distress risks. A cautious strategy focusing on operational efficiency and risk mitigation is advisable for investors.
Stock Price Action Analysis
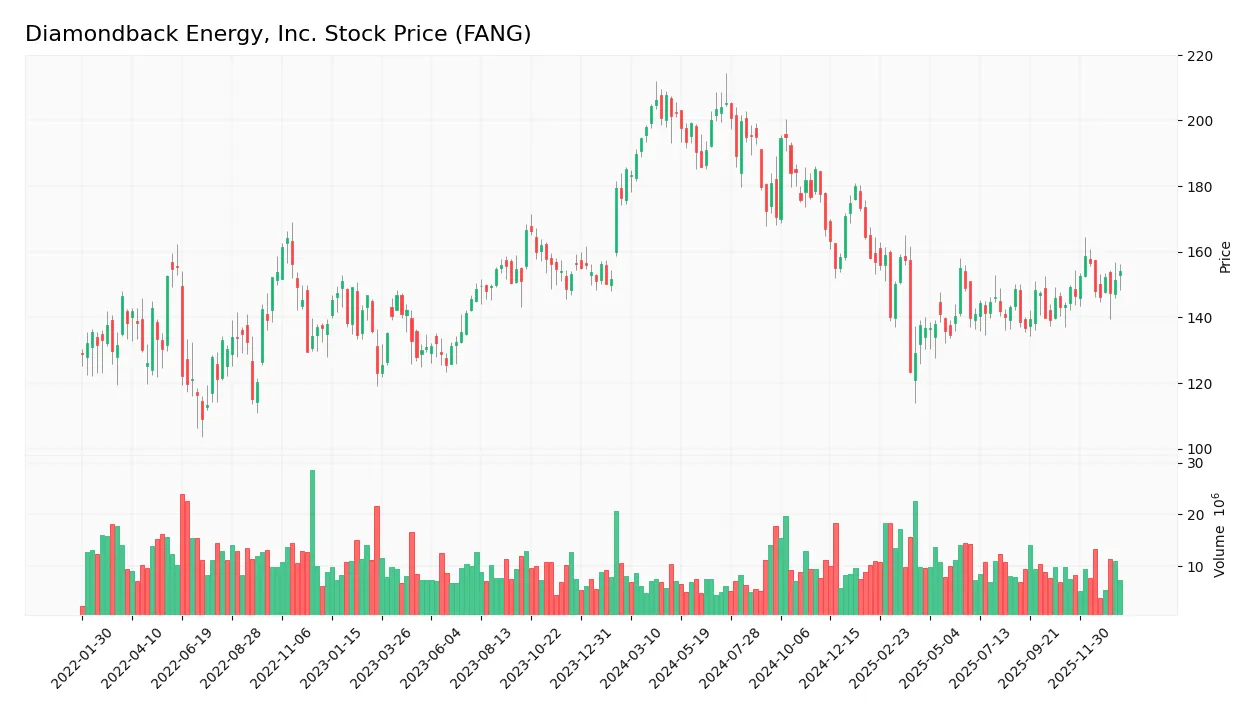
The following weekly chart illustrates Diamondback Energy, Inc. (FANG) stock price movements over the last 100 weeks and highlights recent recovery trends:
Trend Analysis
Over the past 12 months, FANG’s stock price declined by 16.82%, indicating a bearish trend with accelerating downward momentum. The price ranged between a high of 207.76 and a low of 123.37, displaying significant volatility with a standard deviation of 23.78. However, since November 2025, a recent 7.22% gain suggests a short-term upward correction.
Volume Analysis
Trading volume for FANG has been increasing overall, with a nearly balanced buyer-to-seller ratio historically (buyer volume 49.77%). In the recent period ending January 2026, buyer volume slightly dominates at 55.63%, indicating a modest buyer-driven activity and growing investor participation.
Target Prices
Analysts present a clear target price consensus for Diamondback Energy, Inc. (FANG).
| Target High | Target Low | Consensus |
|---|---|---|
| 215 | 162 | 182.42 |
The target prices indicate moderate upside potential, with analysts expecting the stock to trade between 162 and 215, averaging around 182.42. This reflects cautious optimism in the current market environment.
Don’t Let Luck Decide Your Entry Point
Optimize your entry points with our advanced ProRealTime indicators. You’ll get efficient buy signals with precise price targets for maximum performance. Start outperforming now!
Analyst & Consumer Opinions
This section reviews the latest analyst ratings and consumer feedback concerning Diamondback Energy, Inc. (FANG).
Stock Grades
Here is the latest overview of Diamondback Energy, Inc. stock grades from leading financial institutions:
| Grading Company | Action | New Grade | Date |
|---|---|---|---|
| Wells Fargo | Maintain | Overweight | 2024-10-18 |
| Susquehanna | Maintain | Positive | 2024-10-18 |
| Keybanc | Maintain | Overweight | 2024-10-16 |
| Truist Securities | Maintain | Buy | 2024-10-16 |
| Piper Sandler | Maintain | Overweight | 2024-10-15 |
| Scotiabank | Maintain | Sector Outperform | 2024-10-10 |
| BMO Capital | Upgrade | Outperform | 2024-10-04 |
| Benchmark | Maintain | Buy | 2024-10-03 |
| Barclays | Upgrade | Overweight | 2024-10-02 |
| Wells Fargo | Maintain | Overweight | 2024-10-01 |
The majority of grades for Diamondback Energy remain positive, with frequent maintenance of overweight or buy ratings and a few recent upgrades to outperform and overweight. This reflects a consistent favorable outlook among analysts.
Consumer Opinions
Diamondback Energy, Inc. has garnered a mix of praise and criticism from its consumer base, reflecting diverse experiences with the company.
| Positive Reviews | Negative Reviews |
|---|---|
| Strong operational efficiency and output | Concerns about environmental impact |
| Reliable dividend payments | Customer service response times lag |
| Consistent growth in shareholder value | Volatility in stock price unsettling |
Overall, consumer feedback on Diamondback Energy highlights its robust operational performance and attractive dividends, while concerns primarily focus on environmental issues and occasional customer service delays.
Risk Analysis
The table below summarizes key risks associated with Diamondback Energy, Inc., their likelihood, and potential impact on investors:
| Category | Description | Probability | Impact |
|---|---|---|---|
| Financial Stability | Altman Z-Score indicates distress zone, signaling elevated bankruptcy risk | High | High |
| Liquidity | Unfavorable current and quick ratios suggest potential short-term liquidity challenges | Medium | Medium |
| Market Volatility | Beta of 0.577 implies lower volatility but exposure to oil price fluctuations | Medium | High |
| Operational Risks | Concentration in Permian Basin may pose geographic and regulatory risks | Medium | Medium |
| Debt Management | Moderate debt-to-equity ratio and favorable interest coverage reduce default risk | Low | Medium |
| Valuation Metrics | Favorable P/E and P/B ratios but moderate scores warn of valuation uncertainties | Medium | Medium |
The most significant risks lie in financial stability, with an Altman Z-Score below 1.8 signaling distress, and exposure to oil price volatility impacting revenue. Liquidity constraints also pose a cautionary note despite solid debt management. Careful monitoring and risk mitigation are advisable.
Should You Buy Diamondback Energy, Inc.?
Diamondback Energy, Inc. appears to be a company with improving profitability and a slightly favorable competitive moat, suggesting growing operational efficiency despite shedding value relative to WACC. Its leverage profile is moderate, while an A- rating indicates a very favorable overall standing, though caution is advised given its distress-zone Altman Z-Score.
Strength & Efficiency Pillars
Diamondback Energy, Inc. demonstrates solid profitability with a net margin of 30.28% and a favorable gross margin of 45.11%, underscoring efficient cost management. The company’s weighted average cost of capital (WACC) stands at 5.56%, slightly below its return on invested capital (ROIC) of 5.75%, indicating marginal value creation, though this gap is modest. Financial health signals are mixed: an Altman Z-Score of 1.40 places the firm in the distress zone, suggesting bankruptcy risk, while a Piotroski Score of 5 reflects average financial strength. Debt levels remain conservative with a debt-to-equity ratio of 0.33, supporting balance sheet stability.
Weaknesses and Drawbacks
Certain risks temper the investment case for Diamondback Energy. The company’s return on equity (ROE) is low at 8.85%, flagged as unfavorable, which may raise questions about shareholder value generation. Liquidity concerns are apparent with a current ratio of 0.44 and quick ratio of 0.41, both below 1, indicating potential short-term solvency pressures. Asset turnover ratios (0.16) are weak, suggesting inefficient use of assets. Additionally, despite a reasonable price-to-earnings ratio of 10.48, the stock has experienced a notable overall bearish trend with a 16.82% price decline over the last 100 weeks, reflecting market pressures.
Our Verdict about Diamondback Energy, Inc.
The company’s long-term fundamental profile appears cautiously favorable, supported by solid margins and manageable leverage but tempered by liquidity risks and moderate value creation. Recent market behavior shows a slightly buyer-dominant trend with a 7.22% price increase since November 2025, suggesting some recovery momentum. Despite this, the prior bearish trend and distressed Altman Z-Score might warrant a wait-and-see approach for investors considering new positions. Overall, Diamondback Energy may appear a viable candidate for exposure, albeit with attention to its underlying financial risks.
Disclaimer: This content is for informational purposes only and does not constitute financial, investment, or other professional advice. Investing in financial markets involves a significant risk of loss, and past performance is not indicative of future results.
Additional Resources
- Vantage Investment Partners LLC Purchases 8,165 Shares of Diamondback Energy, Inc. $FANG – MarketBeat (Jan 23, 2026)
- Will Lower Q4 Pricing And A 33.8% Profit Drop Change Diamondback Energy’s (FANG) Narrative – Sahm (Jan 23, 2026)
- Bernstein Reduces Firm’s PT Diamondback Energy (FANG) Stock – MSN (Jan 19, 2026)
- Diamondback Energy Earnings Preview: What to Expect – Yahoo Finance (Jan 20, 2026)
- Diamondback Energy Inc (FANG) Stock Price Up 3.43% on Jan 21 – GuruFocus (Jan 21, 2026)
For more information about Diamondback Energy, Inc., please visit the official website: diamondbackenergy.com


