Home > Analyses > Healthcare > DexCom, Inc.
DexCom transforms diabetes management by delivering continuous glucose monitoring systems that redefine patient care and daily health decisions. Its flagship products, including the DexCom G6 and the forthcoming G7, lead the medical device sector with cutting-edge innovation and seamless data integration. Renowned for quality and market influence, DexCom challenges traditional glucose testing. As the healthcare landscape evolves, I question whether DexCom’s robust fundamentals justify its current valuation and growth outlook.
Table of contents
Business Model & Company Overview
DexCom, Inc., founded in 1999 and headquartered in San Diego, California, leads the medical device sector with its advanced continuous glucose monitoring (CGM) systems. Its product suite, including DexCom G6 and the upcoming G7, forms a cohesive ecosystem dedicated to improving diabetes management. DexCom integrates hardware and digital health through innovative tools like the Real-Time API and remote monitoring systems, positioning itself as a vital partner for patients and healthcare providers worldwide.
The company’s revenue engine balances cutting-edge hardware sales with software-driven recurring services, driving sustained growth across the Americas, Europe, and Asia. By directly marketing to endocrinologists and diabetes educators, DexCom solidifies its competitive advantage in a complex global healthcare market. Its collaboration with Verily Life Sciences underscores a strong innovation pipeline, reinforcing DexCom’s economic moat and shaping the future of diabetes care.
Financial Performance & Fundamental Metrics
I will analyze DexCom, Inc.’s income statement, key financial ratios, and dividend payout policy to assess its core financial health and shareholder value.
Income Statement
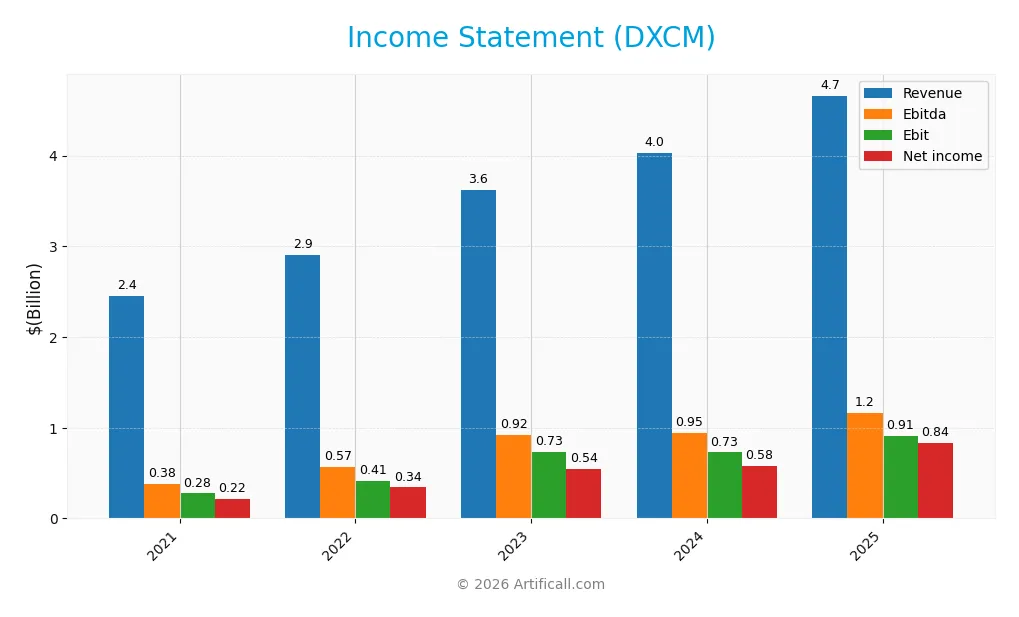
The table below summarizes DexCom, Inc.’s key income statement figures for fiscal years 2021 through 2025, presented in USD.
| 2021 | 2022 | 2023 | 2024 | 2025 | |
|---|---|---|---|---|---|
| Revenue | 2.45B | 2.91B | 3.62B | 4.03B | 4.66B |
| Cost of Revenue | 768M | 1.03B | 1.33B | 1.59B | 1.86B |
| Operating Expenses | 1.41B | 1.49B | 1.69B | 1.84B | 1.89B |
| Gross Profit | 1.68B | 1.88B | 2.29B | 2.44B | 2.80B |
| EBITDA | 378M | 565M | 917M | 946M | 1.16B |
| EBIT | 276M | 409M | 731M | 728M | 912M |
| Interest Expense | 19M | 19M | 20M | 19M | 0 |
| Net Income | 217M | 341M | 541M | 576M | 836M |
| EPS | 0.56 | 0.88 | 1.44 | 1.46 | 2.14 |
| Filing Date | 2022-02-14 | 2023-02-09 | 2024-02-08 | 2024-12-31 | 2026-02-12 |
Income Statement Evolution
DexCom’s revenue rose sharply, growing 90.4% from 2021 to 2025, with a 15.6% increase in the last year alone. Net income expanded even faster, up 285.6% over the period. Margins improved consistently, with gross margin around 60% and net margin nearing 18%, reflecting better cost control and operational efficiency.
Is the Income Statement Favorable?
In 2025, DexCom reported $4.66B revenue and $836M net income, with an EPS of $2.14. EBIT margin reached 19.6%, signaling strong profitability. Interest expenses were negligible. All key metrics, including revenue and net margin growth, were favorable, indicating robust fundamentals and efficient capital allocation.
Financial Ratios
The following table summarizes key financial ratios for DexCom, Inc. over the last five fiscal years, highlighting profitability, valuation, liquidity, leverage, efficiency, and dividend metrics:
| Ratios | 2021 | 2022 | 2023 | 2024 | 2025 |
|---|---|---|---|---|---|
| Net Margin | 8.9% | 11.7% | 14.9% | 14.3% | 17.9% |
| ROE | 10.6% | 16.0% | 26.2% | 27.4% | 30.5% |
| ROIC | 5.3% | 7.9% | 9.6% | 10.2% | 16.6% |
| P/E | 239.5 | 129.2 | 88.5 | 54.6 | 31.0 |
| P/B | 25.4 | 20.7 | 23.2 | 15.0 | 9.4 |
| Current Ratio | 5.11 | 1.99 | 2.84 | 1.47 | 1.88 |
| Quick Ratio | 4.62 | 1.83 | 2.48 | 1.28 | 1.59 |
| D/E | 1.06 | 1.01 | 1.25 | 1.23 | 0.51 |
| Debt-to-Assets | 43.7% | 39.8% | 41.4% | 39.9% | 22.2% |
| Interest Coverage | 14.1 | 21.0 | 29.4 | 31.6 | 0 |
| Asset Turnover | 0.50 | 0.54 | 0.58 | 0.62 | 0.74 |
| Fixed Asset Turnover | 2.75 | 2.56 | 3.06 | 2.88 | 2.85 |
| Dividend Yield | 0% | 0% | 0% | 0% | 0% |
Evolution of Financial Ratios
DexCom’s Return on Equity (ROE) steadily improved, reaching 30.46% in 2025, signaling enhanced profitability. The Current Ratio remained healthy above 1.8, reflecting consistent liquidity. Debt-to-Equity fluctuated but settled near 0.51 in 2025, indicating moderate leverage. Profit margins increased, confirming improved operational efficiency and bottom-line stability over the period.
Are the Financial Ratios Fovorable?
In 2025, profitability metrics like net margin (17.94%) and ROE (30.46%) are favorable, supported by a strong return on invested capital (16.61%). Liquidity ratios, including current (1.88) and quick (1.59), also indicate financial strength. However, valuation multiples such as price-to-earnings (30.97) and price-to-book (9.43) appear elevated, posing concerns. Leverage is moderate with a debt-to-assets ratio of 22.23%, and interest coverage remains robust. Overall, ratios are slightly favorable, balancing strengths and valuation risks.
Shareholder Return Policy
DexCom, Inc. does not pay dividends, reflecting its reinvestment strategy and focus on growth. The company does not report share buyback programs, indicating a priority on funding operations and expansion over returning capital to shareholders.
This approach supports long-term shareholder value by emphasizing innovation and market development. However, absence of direct returns increases reliance on capital appreciation, which may not suit income-focused investors.
Score analysis
The following radar chart illustrates DexCom, Inc.’s key financial scores across valuation, profitability, and leverage metrics:
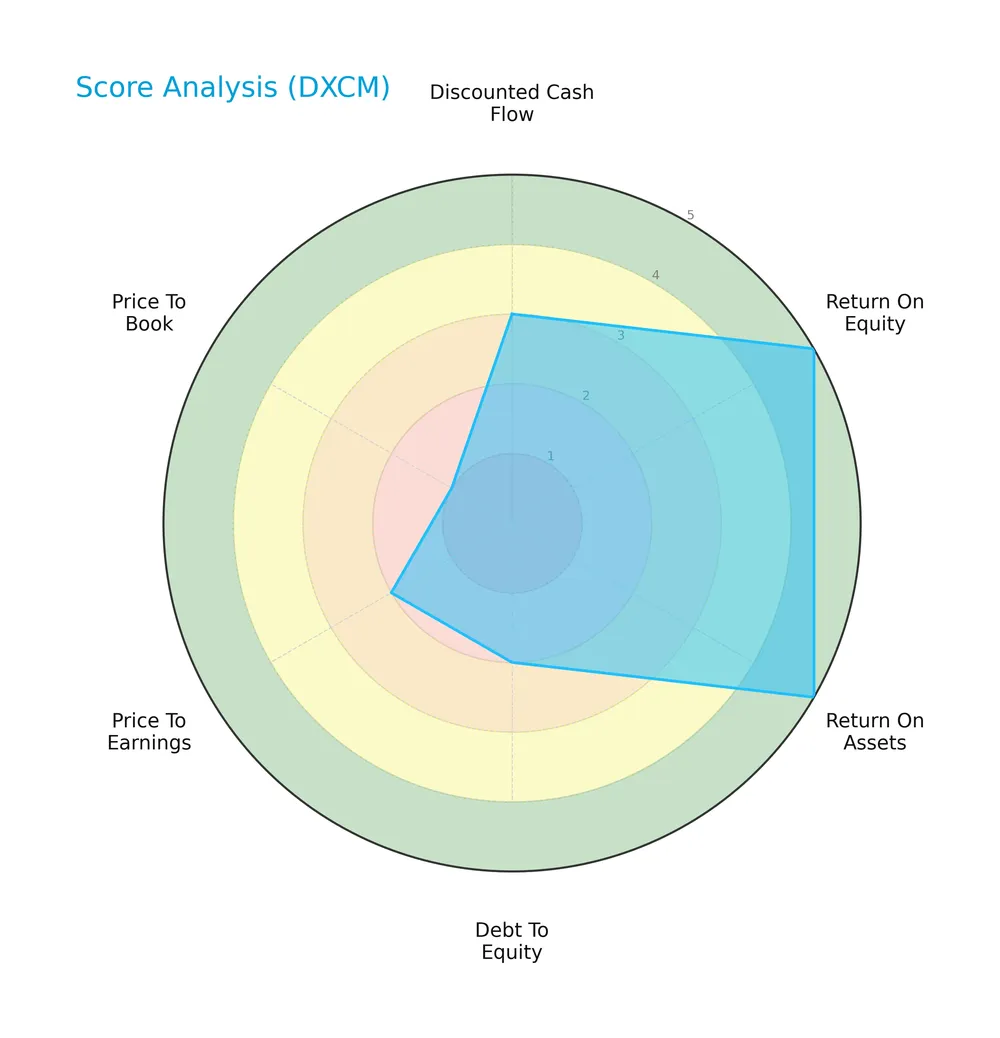
DexCom shows strong profitability with top scores of 5 in return on equity and assets. However, valuation and leverage metrics lag, with price-to-book at 1 and debt-to-equity at 2, signaling caution.
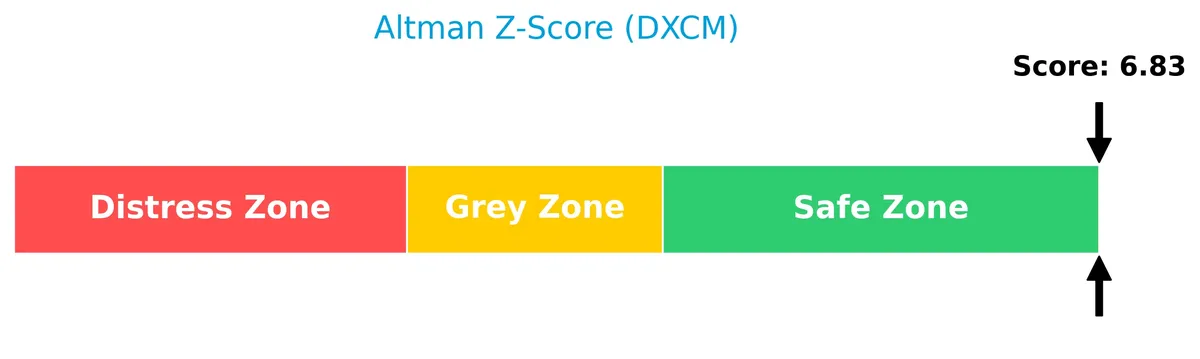
Analysis of the company’s bankruptcy risk
DexCom’s Altman Z-Score places it well within the safe zone, indicating a very low risk of bankruptcy:
Is the company in good financial health?
The Piotroski Score diagram highlights DexCom’s robust financial health and operational strength:
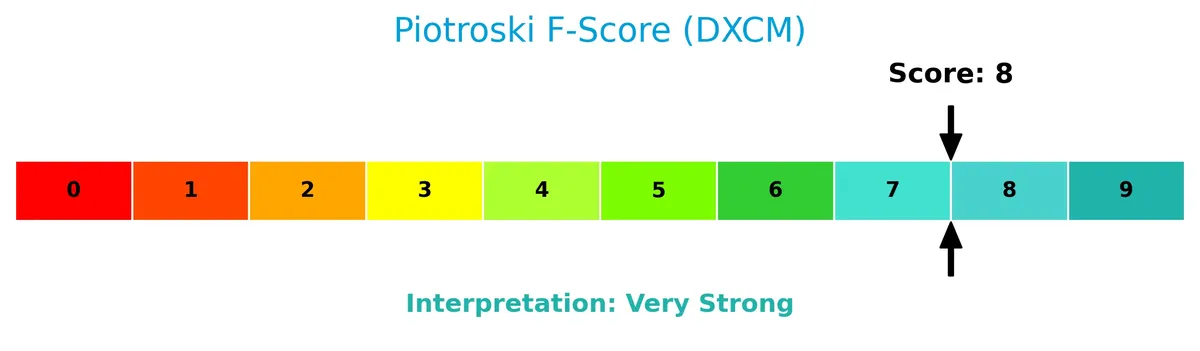
With a high Piotroski Score of 8, DexCom demonstrates very strong fundamentals, reflecting solid profitability, liquidity, and efficiency metrics.
Competitive Landscape & Sector Positioning
This analysis reviews DexCom, Inc.’s strategic positioning, revenue segments, key products, and main competitors in the medical devices sector. I will assess whether DexCom holds a competitive advantage over its industry peers.
Strategic Positioning
DexCom, Inc. concentrates on continuous glucose monitoring devices, primarily in the U.S., but has steadily expanded non-U.S. revenue from $213M in 2018 to $1.33B in 2025. Its focused portfolio targets diabetes management with integrated CGM systems and digital health integrations.
Revenue by Segment
This pie chart presents DexCom, Inc.’s revenue distribution by segment for the most recent fiscal year, highlighting the company’s key business drivers.

DexCom’s revenue heavily concentrates in its primary segment, reflecting a strong market position. The dominant segment drives the bulk of sales, underscoring focused execution. No secondary segments show significant revenue, indicating limited diversification. The latest year shows stable or growing revenue exclusively from this main segment, suggesting a reliance risk but also a clear moat built on specialized expertise.
Key Products & Brands
The following table outlines DexCom’s primary products and brands central to its diabetes management offering:
| Product | Description |
|---|---|
| DexCom G6 | Integrated continuous glucose monitoring system for diabetes management. |
| Dexcom Real-Time API | Platform enabling third-party developers to integrate real-time CGM data into digital health applications. |
| Dexcom ONE | Device designed to replace finger stick blood glucose testing for diabetes treatment decisions. |
| Dexcom Share | Remote monitoring system allowing data sharing with caregivers and healthcare providers. |
| Dexcom G7 | Next-generation continuous glucose monitoring system under development. |
DexCom’s product lineup focuses on continuous glucose monitoring systems, emphasizing real-time data integration and remote monitoring. These innovations target both patients and healthcare professionals managing diabetes.
Main Competitors
DexCom, Inc. faces competition from 10 major players; below is a list of the top 10 leaders by market capitalization:
| Competitor | Market Cap. |
|---|---|
| Abbott Laboratories | 216B |
| Boston Scientific Corporation | 140B |
| Stryker Corporation | 133B |
| Medtronic plc | 123B |
| Edwards Lifesciences Corporation | 50B |
| DexCom, Inc. | 26B |
| STERIS plc | 25B |
| Insulet Corporation | 20B |
| Zimmer Biomet Holdings, Inc. | 18B |
| Align Technology, Inc. | 11B |
DexCom ranks 6th among its competitors, with a market cap just 13% that of the sector leader, Abbott Laboratories. It sits below both the average market cap of the top 10 ($76B) and the sector median ($38B). The company maintains a significant 82% gap to the next competitor above, Edwards Lifesciences, underscoring a clear tiered market structure.
Comparisons with competitors
Check out how we compare the company to its competitors:
Does DexCom have a competitive advantage?
DexCom presents a clear competitive advantage, shown by a very favorable moat with ROIC exceeding WACC by 6.3%, and a strong upward ROIC trend of 213% over 2021-2025. The company creates value through efficient capital use and increasing profitability, supported by favorable margins and robust income growth.
Looking ahead, DexCom’s competitive edge is reinforced by its next-generation G7 CGM system and strategic collaborations with Verily Life Sciences. Expanding international sales, which reached $1.3B in 2025, also signal growth opportunities in new markets and product integrations with digital health platforms.
SWOT Analysis
This SWOT analysis highlights DexCom’s core competitive position and strategic challenges in the evolving medical device sector.
Strengths
- strong revenue growth (90% over 5 years)
- high ROE of 30.5%
- sustainable competitive advantage with growing ROIC
Weaknesses
- high valuation multiples (PE 31, PB 9.4)
- moderate debt-to-equity ratio (0.51)
- no dividend yield
Opportunities
- expanding international sales
- innovation in CGM technology (G7 system)
- partnerships with Verily for new glucose monitoring
Threats
- intense competition in diabetes devices
- regulatory risks in healthcare
- pricing pressure from insurers and payers
DexCom’s robust profitability and innovation pipeline support long-term value creation. However, high valuation and competitive threats require cautious monitoring. The company should leverage growth opportunities abroad and continue R&D investments while managing regulatory and pricing pressures.
Stock Price Action Analysis
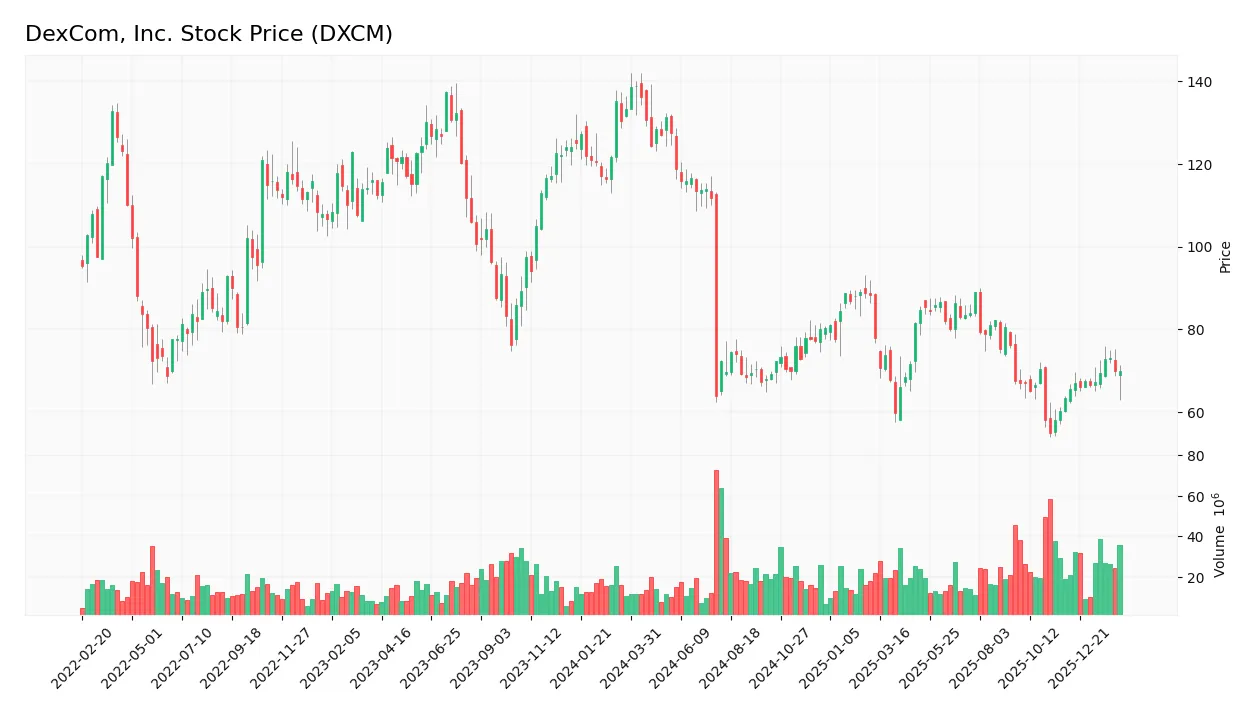
The following weekly stock chart illustrates DexCom, Inc.’s price movements over the past 12 months, highlighting key fluctuations and trend shifts:
Trend Analysis
DexCom’s stock declined by 47.42% over the past year, marking a clear bearish trend with accelerating downside momentum. The price ranged from a high of 138.93 to a low of 55.0, reflecting elevated volatility with a 20.95 standard deviation. Recent weeks show a 10.32% recovery, indicating a mild bullish correction.
Volume Analysis
Trading volume has increased, totaling approximately 2.47B shares, with buyers accounting for 52.24%. In the recent three-month period, buyer dominance strengthened to 78%, signaling increased investor confidence and active market participation favoring accumulation over distribution.
Target Prices
Analysts project a moderately bullish outlook for DexCom, Inc. with a clear range of expectations.
| Target Low | Target High | Consensus |
|---|---|---|
| 72 | 95 | 85.82 |
The target prices suggest confidence in DexCom’s growth potential, with the consensus indicating a solid upside from current levels.

Don’t Let Luck Decide Your Entry Point
Optimize your entry points with our advanced ProRealTime indicators. You’ll get efficient buy signals with precise price targets for maximum performance. Start outperforming now!
Analyst & Consumer Opinions
This section reviews recent analyst grades and consumer feedback to gauge market sentiment on DexCom, Inc. (DXCM).
Stock Grades
The latest analyst ratings for DexCom, Inc. show a mix of maintained and adjusted positions from leading firms as follows:
| Grading Company | Action | New Grade | Date |
|---|---|---|---|
| Canaccord Genuity | Maintain | Buy | 2026-02-13 |
| BTIG | Maintain | Buy | 2026-02-13 |
| Mizuho | Maintain | Outperform | 2026-02-13 |
| Wells Fargo | Maintain | Overweight | 2026-02-13 |
| Barclays | Maintain | Underweight | 2026-02-13 |
| Barclays | Downgrade | Underweight | 2026-01-12 |
| Bernstein | Maintain | Outperform | 2026-01-09 |
| Mizuho | Maintain | Outperform | 2025-12-17 |
| Citigroup | Maintain | Buy | 2025-12-11 |
| Morgan Stanley | Upgrade | Overweight | 2025-12-02 |
Most analysts maintain positive stances, predominantly Buy or Outperform grades, with Barclays as a notable outlier downgrading to Underweight. The consensus remains a Buy, reflecting cautious optimism amid some divergence.
Consumer Opinions
Consumer sentiment around DexCom, Inc. (DXCM) reveals a mix of strong product appreciation and concerns over service aspects.
| Positive Reviews | Negative Reviews |
|---|---|
| Accurate and reliable glucose monitoring | Customer service response times are slow |
| Device improves daily diabetes management | High cost of sensors and supplies |
| Easy-to-use app interface with real-time data | Occasional connectivity issues reported |
Overall, users praise DexCom’s accuracy and usability, key strengths in diabetes care technology. However, recurring complaints about pricing and customer support suggest areas needing strategic attention.
Risk Analysis
Below is a summary of key risks facing DexCom, Inc., highlighting potential challenges investors should monitor closely:
| Category | Description | Probability | Impact |
|---|---|---|---|
| Valuation Risk | High P/E (31x) and P/B (9.43x) ratios signal elevated valuation. | High | High |
| Competitive Risk | Intense innovation and competition in CGM tech may pressure sales. | Medium | High |
| Regulatory Risk | Healthcare device approvals and compliance remain complex. | Medium | Medium |
| Market Volatility | Beta of 1.49 indicates above-average stock price swings. | High | Medium |
| Debt Risk | Moderate debt-to-equity ratio (0.51) with good interest coverage | Low | Low |
DexCom’s valuation multiples stand out as the most significant risk. Despite strong profitability (ROE 30%), the market prices in high growth expectations, raising correction risk. Regulatory hurdles and competition in the continuous glucose monitoring sector also pose material threats, especially given rapid tech evolution.
Should You Buy DexCom, Inc.?
DexCom appears to be a profitable company with strong value creation and a durable competitive moat supported by growing ROIC. Despite a manageable leverage profile, certain valuation metrics suggest caution. Overall, the firm holds a B+ rating reflecting a very favorable financial profile.
Strength & Efficiency Pillars
DexCom, Inc. exhibits robust profitability with a net margin of 17.94% and a return on equity (ROE) of 30.46%, signaling efficient capital use. Its return on invested capital (ROIC) stands at 16.61%, comfortably above the weighted average cost of capital (WACC) at 10.27%, confirming DexCom as a clear value creator. The company’s gross and EBIT margins, at 60.1% and 19.56% respectively, further underscore operational strength. A very strong Piotroski score of 8 supports its solid financial health and improving profitability trends.
Weaknesses and Drawbacks
Despite sound fundamentals, DexCom faces valuation headwinds. The price-to-earnings ratio (P/E) of 30.97 and price-to-book (P/B) of 9.43 reflect a premium market valuation, which may limit near-term upside. While debt levels are moderate with a debt-to-equity ratio of 0.51, the current ratio at 1.88 is favorable but warrants monitoring for liquidity in volatile markets. The stock’s overall bearish trend with a -47.42% price change since 2021 signals investor caution, despite recent buyer dominance at 78%, which might mitigate short-term risks.
Our Final Verdict about DexCom, Inc.
DexCom presents a fundamentally strong profile with clear value creation and improving operational metrics. Despite the premium valuation and a bearish long-term price trend, recent strong buyer dominance suggests growing market interest. The profile may appear attractive for investors seeking growth exposure but calls for prudence given historical volatility and valuation concerns. A measured, wait-and-see approach could be prudent to capture a better entry point amid ongoing market fluctuations.
Disclaimer: This content is for informational purposes only and does not constitute financial, investment, or other professional advice. Investing in financial markets involves a significant risk of loss, and past performance is not indicative of future results.
Additional Resources
- DexCom Stock Falls Despite Q4 Earnings Beat, G7 Rollout Drives Growth – TradingView (Feb 13, 2026)
- Why Is DexCom (DXCM) Stock Rocketing Higher Today – Finviz (Feb 13, 2026)
- DexCom (DXCM) Maintains Buy Rating Despite Lowered Price Target – GuruFocus (Feb 13, 2026)
- DexCom (NASDAQ:DXCM) Stock Price Up 8.4% on Earnings Beat – MarketBeat (Feb 13, 2026)
- DexCom, Inc. (NASDAQ:DXCM) Q4 2025 Earnings Call Transcript – Insider Monkey (Feb 13, 2026)
For more information about DexCom, Inc., please visit the official website: dexcom.com