Home > Analyses > Energy > Devon Energy Corporation
Devon Energy powers millions by extracting vital oil and natural gas resources that fuel everyday life. As a top independent player in U.S. energy, it operates over 5,100 wells with a reputation for efficiency and disciplined capital allocation. Devon’s commitment to innovation and operational excellence sets it apart in a volatile sector. Yet, in today’s shifting energy landscape, I ask: do Devon’s fundamentals still justify its current market valuation and growth outlook?

Table of contents
Business Model & Company Overview
Devon Energy Corporation, founded in 1971 and headquartered in Oklahoma City, commands a leading position in the U.S. oil and gas sector. It operates a vast ecosystem of 5,134 gross wells, integrating exploration, development, and production of oil, natural gas, and natural gas liquids. This holistic approach solidifies its role as a key independent energy player.
The company’s revenue engine balances upstream production with strategic asset management across the Americas. Devon’s focus on efficient operations and resource optimization underpins stable cash flow from its core energy assets. Its entrenched presence in the U.S. market provides a durable economic moat, shaping the future landscape of domestic energy supply.
Financial Performance & Fundamental Metrics
I analyze Devon Energy Corporation’s income statement, key financial ratios, and dividend payout policy to assess its profitability, efficiency, and shareholder returns.
Income Statement
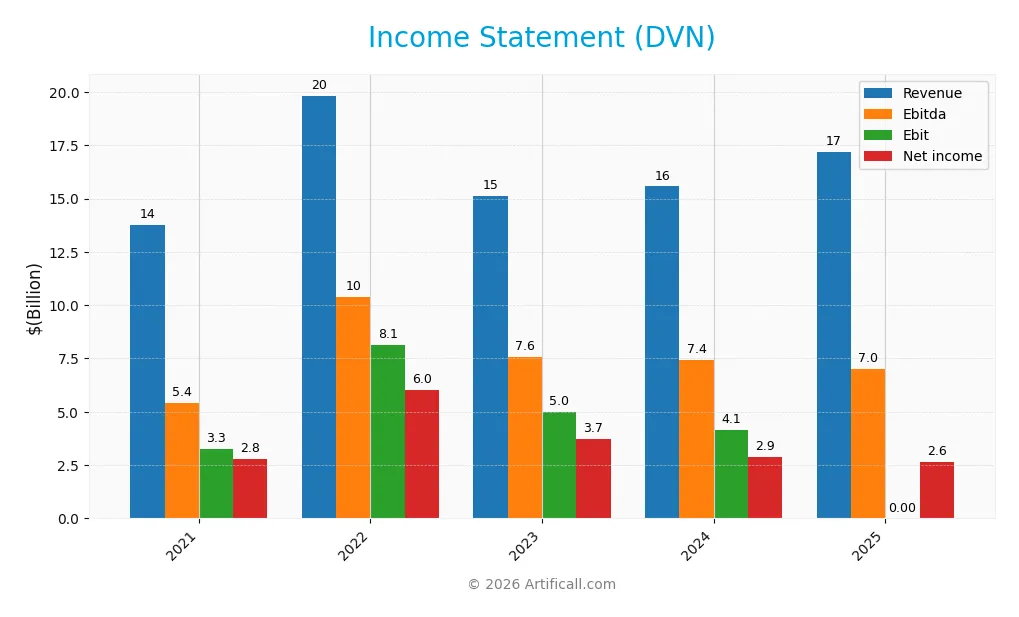
The table below summarizes Devon Energy Corporation’s key income statement figures for fiscal years 2021 through 2025, reflecting revenue, expenses, profits, and earnings per share.
| 2021 | 2022 | 2023 | 2024 | 2025 | |
|---|---|---|---|---|---|
| Revenue | 13.75B | 19.83B | 15.14B | 15.57B | 17.19B |
| Cost of Revenue | 8.54B | 10.85B | 9.94B | 11.30B* | 0 |
| Operating Expenses | 391M | 395M | 408M | 500M | 6.06B |
| Gross Profit | 5.21B | 8.97B | 5.20B | 4.27B | 0 |
| EBITDA | 5.42B | 10.38B | 7.57B | 7.43B | 7.02B |
| EBIT | 3.26B | 8.12B | 4.99B | 4.14B | 0 |
| Interest Expense | 361M | 347M | 363M | 401M | 0 |
| Net Income | 2.78B | 6.02B | 3.75B | 2.89B | 2.64B |
| EPS | 4.20 | 9.15 | 5.86 | 4.57 | 4.21 |
| Filing Date | 2022-02-16 | 2023-02-15 | 2024-02-28 | 2025-02-19 | 2026-02-18 |
*Cost of Revenue 2024 is calculated as Revenue minus Gross Profit (15.57B – 4.27B = 11.30B). Some line items are zero or not reported for certain years.
Income Statement Evolution
From 2021 to 2025, Devon Energy’s revenue grew 25% overall, with a favorable 10.4% increase in 2025 alone. However, net income declined by 5% across the period, with a 17% net margin contraction in the last year. Gross profit and EBIT margins deteriorated sharply in 2025, signaling margin pressure despite top-line growth.
Is the Income Statement Favorable?
The 2025 income statement shows a mixed picture. Revenue rose 10.4%, but gross profit and EBIT margins fell to zero, an unfavorable sign. Net margin remains positive at 15.4%, indicating some profitability. Interest expenses are well-controlled, benefiting the bottom line. Overall, the fundamentals reflect margin compression and uneven earnings quality, resulting in an unfavorable income statement.
Financial Ratios
The table below summarizes key financial ratios for Devon Energy Corporation (DVN) across the last five fiscal years, providing insight into profitability, liquidity, leverage, and valuation metrics:
| Ratios | 2021 | 2022 | 2023 | 2024 | 2025 |
|---|---|---|---|---|---|
| Net Margin | 20% | 30% | 25% | 19% | 15% |
| ROE | 30% | 54% | 31% | 20% | 17% |
| ROIC | 26% | 32% | 18% | 11% | 0% |
| P/E | 10.5 | 6.7 | 7.7 | 7.1 | 0 |
| P/B | 3.15 | 3.59 | 2.40 | 1.41 | 0 |
| Current Ratio | 1.38 | 1.25 | 1.07 | 1.04 | 0.98 |
| Quick Ratio | 1.34 | 1.19 | 0.99 | 0.95 | 0.90 |
| D/E | 0.73 | 0.60 | 0.53 | 0.63 | 0.57 |
| Debt-to-Assets | 32% | 28% | 26% | 30% | 28% |
| Interest Coverage | 13.3 | 24.7 | 13.2 | 9.4 | 0 |
| Asset Turnover | 0.65 | 0.84 | 0.62 | 0.51 | 0.54 |
| Fixed Asset Turnover | 0.90 | 1.08 | 0.77 | 0.61 | 0.72 |
| Dividend Yield | 4.5% | 8.4% | 6.4% | 4.6% | 0% |
All ratios are rounded to two decimals or nearest whole percentage for clarity. The zero values for 2025 P/E, P/B, and interest coverage ratios indicate unavailable or non-applicable data.
Evolution of Financial Ratios
Over the period, Devon Energy’s Return on Equity (ROE) showed fluctuations, peaking at 53.86% in 2022 before declining to 17.01% in 2025. The Current Ratio steadily decreased from 1.38 in 2021 to below 1.0 in 2025, signaling tighter liquidity. The Debt-to-Equity Ratio softened modestly, reflecting a gradual reduction in leverage but remaining near 0.57 in 2025. Profitability margins declined noticeably after 2022.
Are the Financial Ratios Favorable?
In 2025, Devon Energy’s profitability metrics like net margin (15.37%) and ROE (17.01%) remain favorable compared to industry benchmarks. Liquidity ratios present mixed signals: the current ratio is unfavorable at 0.98, while the quick ratio holds neutral at 0.9. Leverage is moderate with a debt-to-equity ratio rated neutral at 0.57. Efficiency measures show neutral to unfavorable trends, and dividend yield stands at zero, marking an unfavorable aspect. Overall, the ratios are slightly favorable but warrant cautious monitoring.
Shareholder Return Policy
Devon Energy Corporation maintains a consistent dividend payout, with ratios ranging from 23% to 56% over recent years. The company also supports share buybacks, balancing distributions with capital expenditures, though free cash flow coverage fluctuates, indicating some variability in payout sustainability.
This policy reflects a measured approach to returning capital while funding growth. Dividend yields have ranged broadly, with recent years showing moderate returns. The combination of dividends and buybacks appears aligned with maintaining long-term shareholder value, despite some free cash flow pressures that warrant monitoring.
Score analysis
Here is a radar chart illustrating Devon Energy Corporation’s key financial scores across multiple valuation and performance metrics:
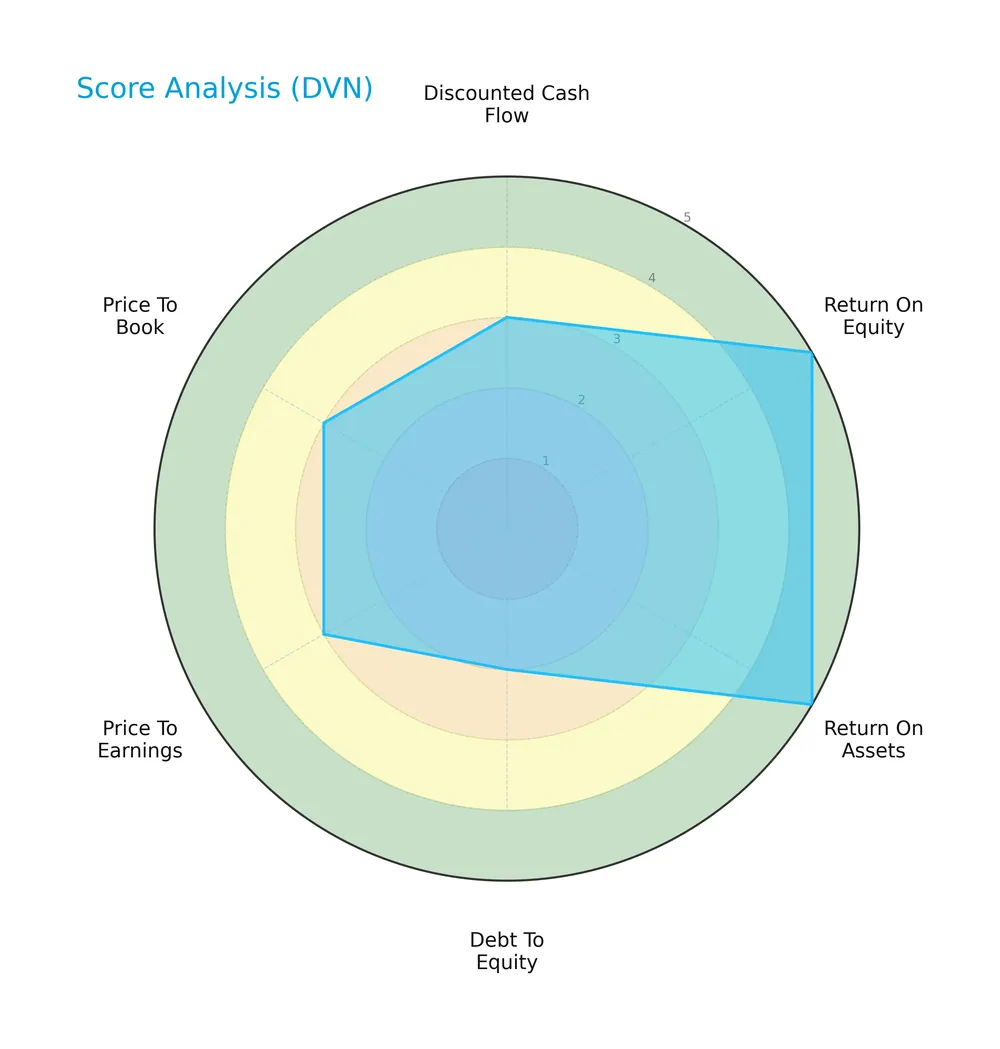
The company shows very favorable returns on equity and assets, reflecting strong profitability. However, its debt-to-equity score is unfavorable, signaling leveraged risk. Valuation metrics and discounted cash flow scores remain moderate, indicating balanced investor sentiment.
Analysis of the company’s bankruptcy risk
Devon Energy’s Altman Z-Score places it in the grey zone, suggesting a moderate risk of bankruptcy and financial uncertainty:

Is the company in good financial health?
This Piotroski diagram highlights the company’s financial strength based on nine fundamental criteria:

With a Piotroski Score of 6, Devon Energy demonstrates average financial health. It shows sound operational efficiency but leaves room for improvement in leverage and liquidity management.
Competitive Landscape & Sector Positioning
This analysis explores Devon Energy Corporation’s strategic positioning, revenue segments, and key products within the oil and gas sector. I will assess whether Devon Energy holds a competitive advantage over its main industry rivals.
Strategic Positioning
Devon Energy concentrates its operations in the U.S. oil and gas sector, with over 5,100 wells and roughly 11B USD in NGL product sales by 2025. Its geographic exposure remains predominantly domestic, showing limited diversification outside the U.S. over recent years.
Revenue by Segment
This pie chart illustrates Devon Energy Corporation’s revenue distribution for N G L Product Sales in fiscal year 2025, highlighting the segment’s contribution to overall sales.
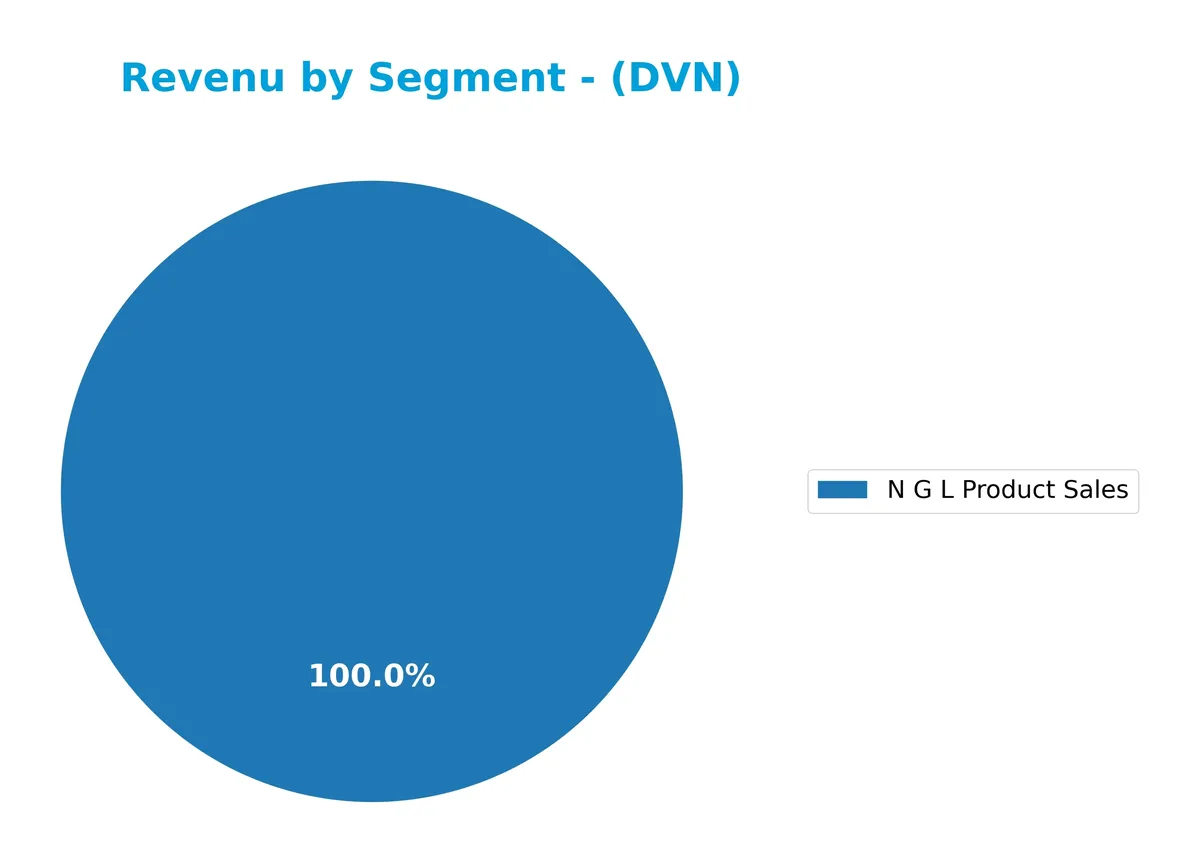
Devon’s revenue in N G L Product Sales steadily increased from $10.8B in 2023 to $11.2B in 2025, signaling stable growth in this segment. Earlier years show a more diversified business with Canada and U.S. segments, but the recent focus clearly centers on N G L products. This concentration reduces diversification but reflects Devon’s strategic pivot toward higher-margin hydrocarbons, which may enhance returns if commodity prices remain favorable.
Key Products & Brands
The table below details Devon Energy Corporation’s primary products and business segments:
| Product | Description |
|---|---|
| NGL Product Sales | Sales from natural gas liquids, generating over $11B annually as of 2025. |
| United States Business Segment | Exploration, development, and production of oil and natural gas within the U.S., the core business. |
| Canada Business Segment | Operations related to oil and natural gas production in Canada, contributing hundreds of millions in revenue. |
| General Partner And En Link | A business segment involved with partnerships and energy infrastructure, generating $3.5B-$5B in prior years. |
Devon Energy primarily earns revenue from natural gas liquids and U.S. oil and gas production. The Canada segment and partnership interests add diversification but represent smaller revenue portions. The firm’s product mix reflects a focus on hydrocarbons with significant scale in U.S. exploration and production.
Main Competitors
The Energy sector includes 10 main competitors, with the table below listing the top 10 leaders by market capitalization:
| Competitor | Market Cap. |
|---|---|
| ConocoPhillips | 120B |
| EOG Resources, Inc. | 59B |
| Diamondback Energy, Inc. | 44B |
| Occidental Petroleum Corporation | 42B |
| EQT Corporation | 33B |
| Expand Energy Corporation | 26B |
| Devon Energy Corporation | 24B |
| Texas Pacific Land Corporation | 21B |
| Coterra Energy Inc. | 20B |
| APA Corporation | 9B |
Devon Energy ranks 7th among its peers, with a market cap about 23% of the leader, ConocoPhillips. The company sits below both the average top 10 market cap of 39.9B and the sector median of 29.8B. It trails its nearest competitor, Expand Energy, by roughly 6.2%, highlighting a close contest for the 6th position.
Comparisons with competitors
Check out how we compare the company to its competitors:
Does DVN have a competitive advantage?
Devon Energy Corporation currently lacks a competitive advantage, as it shows a very unfavorable moat status with declining ROIC and no excess capital to reinvest. The company’s profitability deteriorates, indicating value destruction over 2021-2025.
Looking ahead, Devon’s exploration and production in the U.S. oil and gas sector may offer growth opportunities but faces challenges from margin declines and negative income statement trends. Its future depends on navigating these operational headwinds and capital efficiency.
SWOT Analysis
This analysis highlights Devon Energy Corporation’s core internal and external factors impacting its strategic position.
Strengths
- Strong net margin at 15.37%
- Solid return on equity at 17.01%
- Favorable debt-to-assets ratio at 27.8%
Weaknesses
- Declining ROIC indicating value destruction
- Current ratio below 1 signals liquidity risk
- Negative growth in gross profit and EBIT
Opportunities
- Increasing revenue growth trend at 25% over period
- Rising energy demand in US markets
- Potential to optimize capital allocation for ROIC improvement
Threats
- Volatile oil and gas prices impacting earnings
- Regulatory risks in energy sector
- Competition from renewable energy sources
Devon Energy’s strengths in profitability and capital structure contrast with operational inefficiencies and liquidity concerns. The company must focus on reversing deteriorating ROIC and controlling costs to capitalize on rising energy demand while navigating sector volatility.
Stock Price Action Analysis
The weekly stock chart for Devon Energy Corporation (DVN) illustrates price movements over the past 100 weeks, highlighting key highs and lows:

Trend Analysis
Over the past 12 months, DVN’s stock price declined by 11.44%, indicating a bearish trend with accelerating downward momentum. The price ranged between a high of 53.42 and a low of 28.23, showing significant volatility with a standard deviation of 6.23.
Volume Analysis
Trading volume has been increasing, with buyers accounting for 52.62% of total volume historically. In the recent period (Dec 2025–Feb 2026), buyer dominance rose sharply to 71.9%, suggesting strong buyer-driven activity and heightened investor interest.
Target Prices
Analysts set a clear target consensus for Devon Energy Corporation, showing moderate upside potential.
| Target Low | Target High | Consensus |
|---|---|---|
| 42 | 51 | 45.89 |
The target range suggests analysts expect Devon Energy to trade between $42 and $51, with a consensus price near $46, reflecting cautious optimism.

Don’t Let Luck Decide Your Entry Point
Optimize your entry points with our advanced ProRealTime indicators. You’ll get efficient buy signals with precise price targets for maximum performance. Start outperforming now!
Analyst & Consumer Opinions
This section examines analyst ratings and consumer feedback to provide a balanced view of Devon Energy Corporation’s market perception.
Stock Grades
Here are the latest verified analyst grades for Devon Energy Corporation, highlighting recent rating changes and consensus:
| Grading Company | Action | New Grade | Date |
|---|---|---|---|
| Barclays | Upgrade | Overweight | 2026-02-04 |
| Susquehanna | Maintain | Positive | 2026-02-03 |
| Scotiabank | Maintain | Sector Perform | 2026-02-03 |
| Wells Fargo | Maintain | Overweight | 2026-01-27 |
| Susquehanna | Maintain | Positive | 2026-01-26 |
| Morgan Stanley | Maintain | Overweight | 2026-01-23 |
| Barclays | Maintain | Equal Weight | 2026-01-21 |
| Scotiabank | Downgrade | Sector Perform | 2026-01-16 |
| Bernstein | Maintain | Outperform | 2026-01-05 |
| Roth Capital | Maintain | Buy | 2025-12-31 |
The overall trend shows a strong buy-side sentiment, with multiple firms maintaining Overweight or Positive ratings. Scotiabank’s recent downgrade to Sector Perform is a notable exception amid broad optimism.
Consumer Opinions
Investor and consumer sentiment around Devon Energy Corporation reveals a mix of appreciation and concern that reflects the energy sector’s volatility.
| Positive Reviews | Negative Reviews |
|---|---|
| Efficient operations leading to strong energy output. | Concerns about environmental impact persist. |
| Competitive pricing compared to peers. | Customer service response times can lag. |
| Transparent communication on quarterly results. | Volatility in stock price worries some investors. |
Overall, Devon Energy earns praise for operational efficiency and transparency. However, environmental concerns and service responsiveness remain recurring issues, reflecting broader industry challenges.
Risk Analysis
The table below summarizes key risks Devon Energy faces, highlighting their likelihood and potential impact:
| Category | Description | Probability | Impact |
|---|---|---|---|
| Liquidity Risk | Current ratio below 1 signals tight short-term liquidity. | Medium | High |
| Profitability Risk | ROIC at 0% failing to cover WACC may undermine long-term value creation. | Medium | High |
| Leverage Risk | Debt-to-equity ratio is moderate but interest coverage is unfavorable. | Medium | Medium |
| Market Volatility | Beta of 0.625 reflects moderate sensitivity to energy sector swings. | Medium | Medium |
| Dividend Risk | Dividend yield at 0% may deter income-focused investors. | Low | Medium |
| Bankruptcy Risk | Altman Z-Score in grey zone indicates moderate financial distress risk. | Medium | High |
Devon Energy’s most pressing risks stem from liquidity constraints and a failure to generate returns above its cost of capital. The Altman Z-Score near 2.4 signals caution, especially amid volatile oil prices and capital-intensive operations. Investors must watch liquidity and profitability metrics closely.
Should You Buy Devon Energy Corporation?
Devon Energy appears to have robust profitability with strong value creation, yet its competitive moat seems very unfavorable due to declining ROIC. Despite a substantial leverage profile, the overall rating of A- suggests a cautiously favorable investment profile.
Strength & Efficiency Pillars
Devon Energy Corporation posts a favorable net margin of 15.37% and a return on equity of 17.01%, signaling solid profitability. Its weighted average cost of capital (WACC) stands at 5.74%, but troublingly, the return on invested capital (ROIC) is at 0%, indicating no value creation. Historically in the energy sector, companies with ROIC below WACC struggle to generate sustainable shareholder returns. Devon’s operational efficiency is mixed, with some profitable elements but lacking excess capital returns.
Weaknesses and Drawbacks
The company sits in the Altman Z-Score grey zone at 2.41, signaling moderate bankruptcy risk warranting caution. Its current ratio of 0.98 is below the safe threshold of 1.0, pointing to potential liquidity pressure. While debt-to-equity is neutral at 0.57, interest coverage is unfavorable, raising concerns about its ability to service debt comfortably. The stock faces bearish overall momentum with an 11.44% decline, despite recent strong buyer dominance at 71.9%, which introduces short-term volatility risk.
Our Final Verdict about Devon Energy Corporation
Devon Energy presents a mixed fundamental profile with operational profitability but no clear value creation, alongside moderate financial risk. The Altman Z-Score’s grey zone status suggests caution. Despite recent strong buyer activity, the bearish longer-term trend and liquidity concerns imply this stock might appear too risky for conservative capital. Investors might consider waiting for stabilization before committing to long-term exposure.
Disclaimer: This content is for informational purposes only and does not constitute financial, investment, or other professional advice. Investing in financial markets involves a significant risk of loss, and past performance is not indicative of future results.
Additional Resources
- Decoding Devon Energy Corp (DVN): A Strategic SWOT Insight – GuruFocus (Feb 19, 2026)
- Key facts: Devon Energy Q4 2025 Earnings Hit $562M; Dividend Increase Planned – TradingView (Feb 18, 2026)
- DVN Stock Quote Price and Forecast – CNN (Feb 15, 2026)
- Devon Energy Q4 Earnings Call Highlights – Yahoo Finance (Feb 18, 2026)
- Devon Energy Posts 2025 Results, Sets 2026 Outlook and Dividend – The Globe and Mail (Feb 19, 2026)
For more information about Devon Energy Corporation, please visit the official website: devonenergy.com