Home > Analyses > Industrials > Delta Air Lines, Inc.
Delta Air Lines moves millions of people and tons of cargo across the globe daily, shaping how we connect and conduct business. As a powerhouse in the airline industry, Delta boasts a vast domestic and international network anchored by key hubs from Atlanta to London. Its reputation for operational excellence and innovation sets it apart in a fiercely competitive market. The critical question now: does Delta’s financial health and strategic positioning still justify its premium valuation and growth ambitions?

Table of contents
Business Model & Company Overview
Delta Air Lines, Inc., founded in 1924 and headquartered in Atlanta, GA, stands as a titan in the Airlines, Airports & Air Services sector. With a fleet of roughly 1,200 aircraft and a workforce of 100K, it operates a vast network spanning key domestic hubs like Atlanta and New York, alongside international gateways such as London-Heathrow and Seoul-Incheon. Delta’s ecosystem integrates passenger travel, cargo transport, and engineering services, forming a unified mission to connect global markets efficiently.
Delta’s revenue engine balances ticket sales across multiple channels—including delta.com and travel agencies—with ancillary streams like aircraft maintenance, vacation packages, and charters. This diversified model drives consistent cash flow across the Americas, Europe, and Asia. I see its competitive advantage in the robust hub system and integrated service offerings, which create high barriers to entry and position Delta as a shaping force in global aviation’s future.
Financial Performance & Fundamental Metrics
I will analyze Delta Air Lines, Inc.’s income statement, key financial ratios, and dividend payout policy to assess its operational efficiency and shareholder returns.
Income Statement
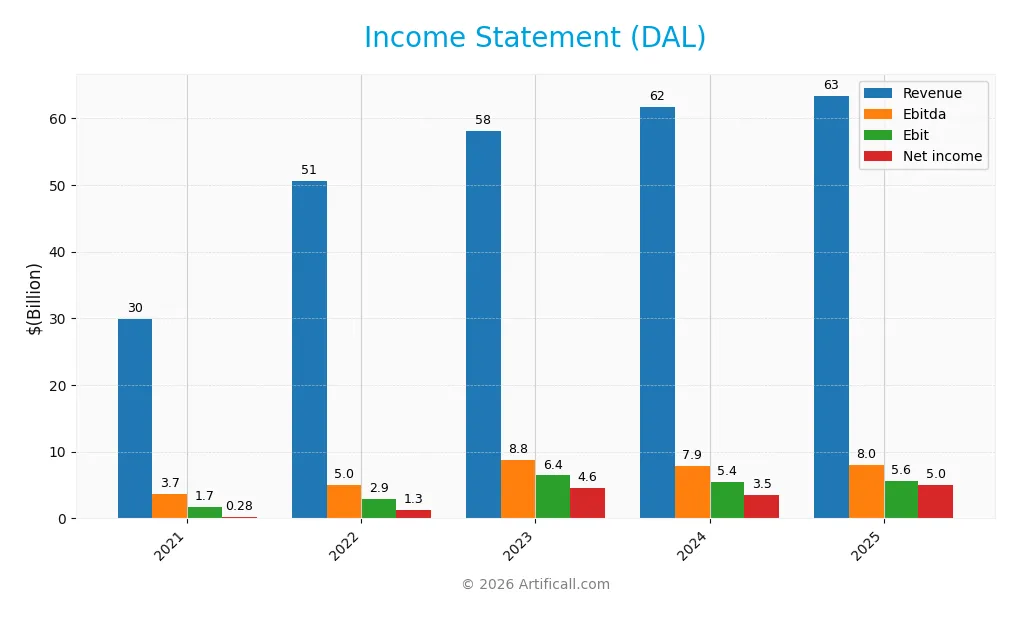
The table below presents Delta Air Lines, Inc.’s key income statement figures for fiscal years 2021 through 2025, reflecting revenue, expenses, profits, and earnings per share.
| 2021 | 2022 | 2023 | 2024 | 2025 | |
|---|---|---|---|---|---|
| Revenue | 29.9B | 50.6B | 58.0B | 61.6B | 63.4B |
| Cost of Revenue | 27.8B | 39.4B | 42.5B | 45.1B | 48.9B |
| Operating Expenses | 247M | 7.5B | 10.0B | 10.6B | 8.7B |
| Gross Profit | 2.1B | 11.2B | 15.5B | 16.6B | 14.5B |
| EBITDA | 3.7B | 5.1B | 8.8B | 7.9B | 8.0B |
| EBIT | 1.7B | 2.9B | 6.4B | 5.4B | 5.6B |
| Interest Expense | 1.3B | 1.0B | 834M | 747M | 679M |
| Net Income | 280M | 1.3B | 4.6B | 3.5B | 5.0B |
| EPS | 0.44 | 2.07 | 7.21 | 5.39 | 7.72 |
| Filing Date | 2022-02-11 | 2023-02-10 | 2024-02-12 | 2025-02-11 | 2026-02-11 |
Income Statement Evolution
Delta Air Lines’ revenue rose 112% from 2021 to 2025, yet growth slowed to 2.8% in 2025. Gross profit declined 12.6% in 2025, compressing margins despite a strong overall margin improvement. Net income surged 1688% over the period, with net margin expanding sharply, signaling enhanced profitability amid stable operating expense control.
Is the Income Statement Favorable?
In 2025, Delta posted $63.4B revenue and $5.0B net income, with a 7.9% net margin deemed favorable. EBIT margin remained neutral at 8.8%, restrained by a 12.6% gross profit decline. Interest expense was low at 1.1% of revenue, supporting profitability. Overall, fundamentals appear favorable, driven by improved net margin and disciplined expenses despite revenue growth deceleration.
Financial Ratios
The table below summarizes key financial ratios for Delta Air Lines, Inc. over the last five fiscal years, highlighting profitability, liquidity, leverage, and valuation metrics:
| Ratios | 2021 | 2022 | 2023 | 2024 | 2025 |
|---|---|---|---|---|---|
| Net Margin | 0.94% | 2.61% | 7.94% | 5.61% | 7.90% |
| ROE | 7.20% | 20.02% | 41.50% | 22.61% | 24.12% |
| ROIC | 2.46% | 5.10% | 8.90% | 8.62% | 8.30% |
| P/E | 88.77 | 15.91 | 5.58 | 11.34 | 8.99 |
| P/B | 6.39 | 3.19 | 2.31 | 2.56 | 2.17 |
| Current Ratio | 0.76 | 0.50 | 0.39 | 0.37 | 0.40 |
| Quick Ratio | 0.71 | 0.45 | 0.34 | 0.32 | 0.34 |
| D/E | 8.92 | 4.65 | 2.46 | 1.49 | 1.02 |
| Debt-to-Assets | 47.85% | 42.35% | 37.04% | 30.21% | 25.97% |
| Interest Coverage | 1.47 | 3.56 | 6.62 | 8.03 | 8.57 |
| Asset Turnover | 0.41 | 0.70 | 0.79 | 0.82 | 0.78 |
| Fixed Asset Turnover | 0.83 | 1.26 | 1.37 | 1.39 | 1.38 |
| Dividend Yield | 0% | 0% | 0.50% | 0.82% | 0.98% |
Evolution of Financial Ratios
Return on Equity (ROE) improved steadily from 7.2% in 2021 to 24.1% in 2025, signaling enhanced profitability. The Current Ratio declined consistently, falling below 0.5, indicating weakening short-term liquidity. Meanwhile, the Debt-to-Equity Ratio decreased from 8.9 in 2021 to about 1.0 in 2025, reflecting a significant reduction in leverage and improved capital structure stability.
Are the Financial Ratios Fovorable?
In 2025, profitability ratios such as ROE (24.1%) and interest coverage (8.23x) are favorable, suggesting efficient earnings and manageable debt costs. Liquidity ratios, including Current (0.4) and Quick (0.34), remain unfavorable, posing short-term risk. Leverage is mixed: Debt-to-Assets (26%) is favorable, but Debt-to-Equity (1.02) is unfavorable. Market multiples like P/E (8.99) are attractive, leading to a slightly favorable overall ratio profile.
Shareholder Return Policy
Delta Air Lines pays dividends with a low payout ratio near 9%, supporting a modest dividend yield around 0.98%. Dividend payments are comfortably covered by free cash flow, and the company also engages in share buybacks, enhancing shareholder returns.
This balanced approach—combining dividends and buybacks—reflects prudent capital allocation. It supports sustainable long-term value creation while retaining flexibility amid industry cyclicality and capital intensity.
Score analysis
Here is a radar chart presenting Delta Air Lines’ key financial scores for a comprehensive performance snapshot:
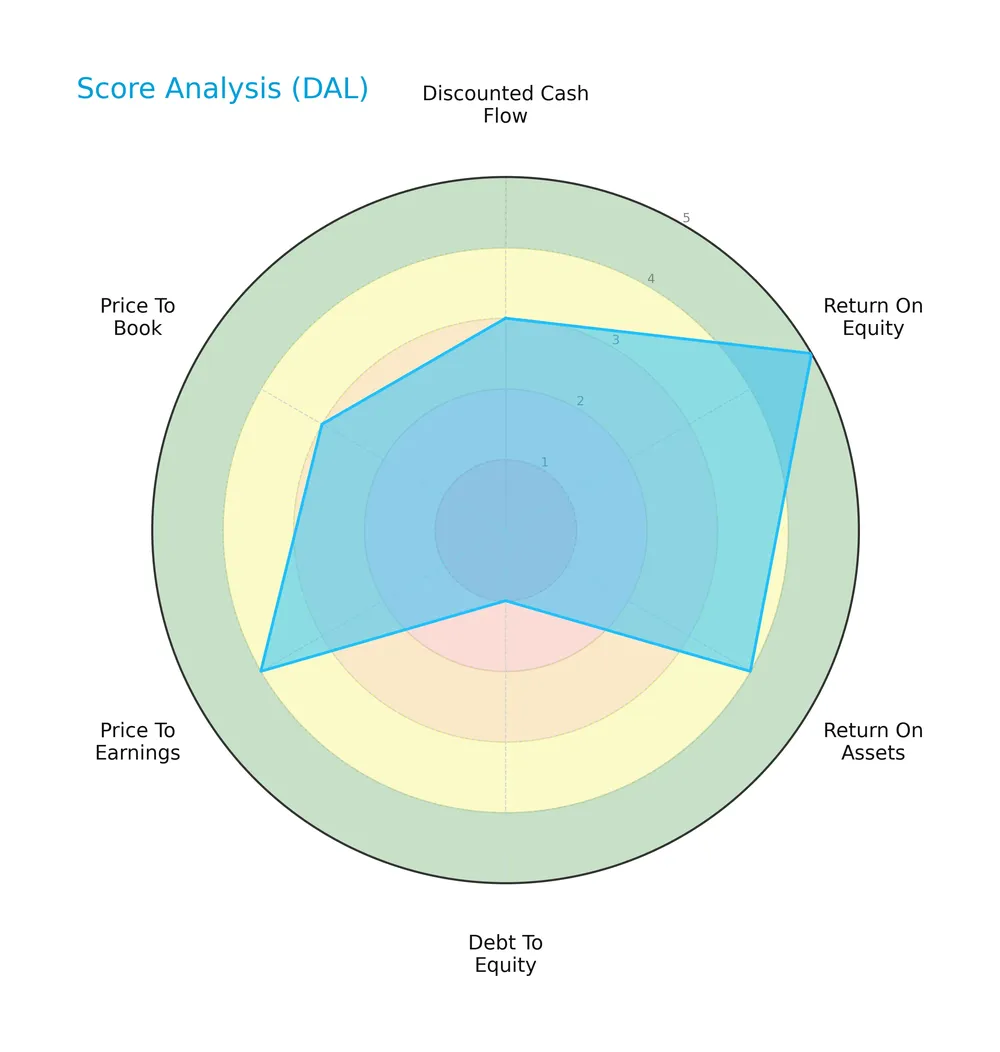
Delta Air Lines shows a very favorable return on equity (5) and favorable return on assets (4). The discounted cash flow (3) and price-to-book (3) scores are moderate. Debt-to-equity is very unfavorable (1), indicating leverage concerns. Price-to-earnings is favorable (4).
Analysis of the company’s bankruptcy risk
Delta Air Lines currently sits in the distress zone with an Altman Z-Score of 1.28, signaling a high probability of financial distress:

Is the company in good financial health?
The Piotroski Score diagram illustrates Delta Air Lines’ financial strength based on nine criteria:

With a Piotroski Score of 7, Delta Air Lines demonstrates strong financial health, suggesting solid profitability, liquidity, and operational efficiency despite some leverage risks.
Competitive Landscape & Sector Positioning
This analysis explores Delta Air Lines, Inc.’s strategic position within the Airlines, Airports & Air Services sector. I will examine its revenue streams, key products, and main competitors to assess market dynamics. The goal is to determine whether Delta holds a competitive advantage over its industry peers.
Strategic Positioning
Delta Air Lines concentrates its revenue in two main segments: Airline (58B in 2025) and Refinery (7B). Geographically, it maintains a strong domestic focus with 43.5B in U.S. revenue, while also serving key international markets across Atlantic, Latin America, and Pacific regions.
Revenue by Segment
This pie chart displays Delta Air Lines, Inc.’s revenue distribution by business segment for the fiscal year 2025, highlighting the relative size of each segment’s contribution.
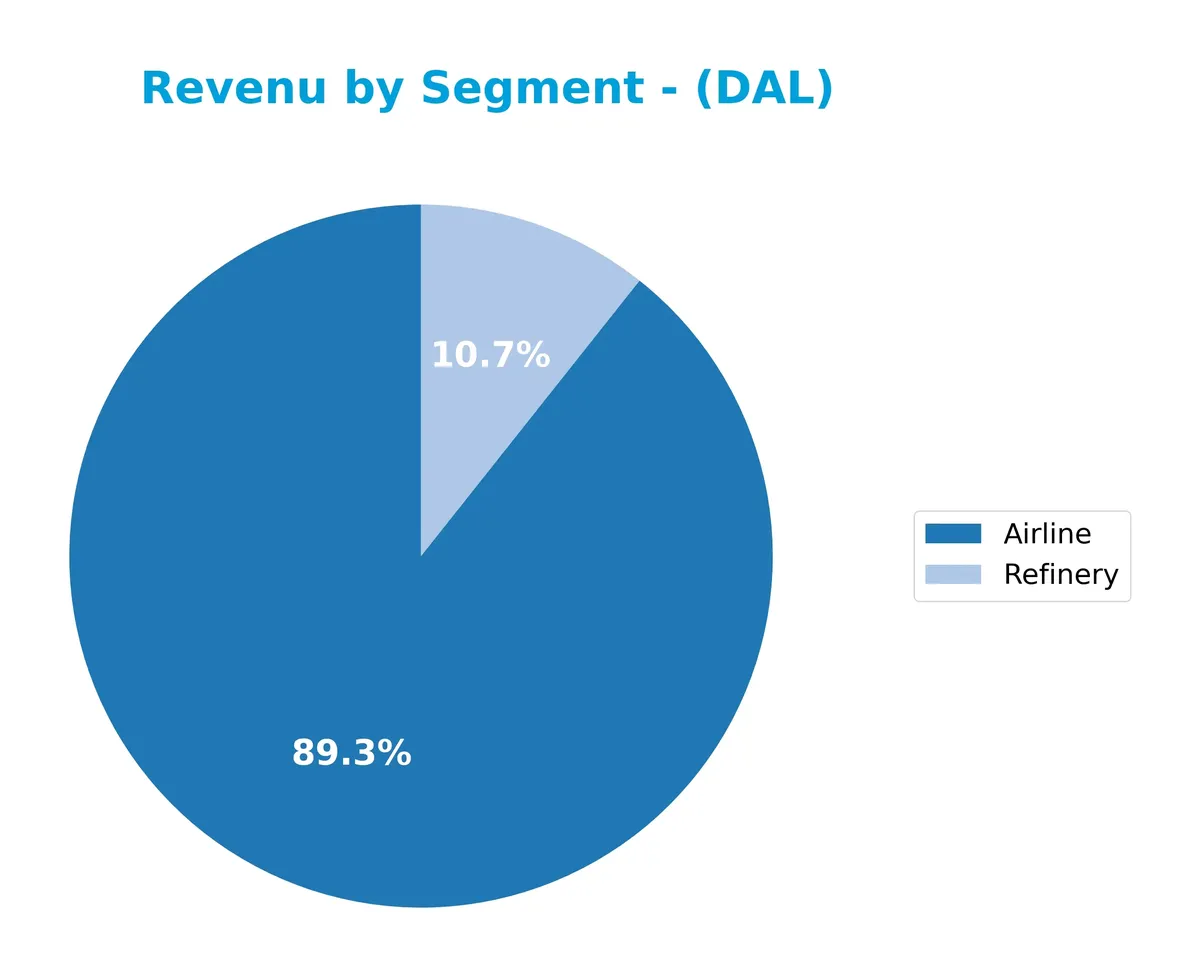
The Airline segment dominates with $58.3B, underscoring its core role in Delta’s business. The Refinery segment remains significant at $6.9B but shows a slight decline from previous years, reflecting volatility. Negative intersegment eliminations at -$1.9B indicate internal adjustments. Overall, the business has consolidated around its primary airline operations, with recent revenue growth signaling resilience despite refinery segment fluctuations.
Key Products & Brands
The table below summarizes Delta Air Lines’ main product segments and their core descriptions:
| Product | Description |
|---|---|
| Airline | Scheduled passenger and cargo air transportation across domestic and international networks. |
| Refinery | Operations involving fuel refining supporting airline and external sales. |
Delta Air Lines relies primarily on its airline segment, generating the bulk of its revenue through domestic and international passenger and cargo services. The refinery segment complements this by supplying fuel, enhancing operational integration.
Main Competitors
There are 3 main competitors in the Airlines, Airports & Air Services industry, with the table listing the top 3 leaders by market capitalization:
| Competitor | Market Cap. |
|---|---|
| Delta Air Lines, Inc. | 45B |
| United Airlines Holdings, Inc. | 37B |
| Southwest Airlines Co. | 21B |
Delta Air Lines, Inc. ranks 1st among its peers with a market cap 3.4% above the top player benchmark. It stands above both the average market cap of the top 10 competitors (34.3B) and the median market cap in the sector (36.6B). Delta enjoys a significant 27.5% lead over its closest competitor below.
Comparisons with competitors
Check out how we compare the company to its competitors:
Does Delta have a competitive advantage?
Delta Air Lines does not yet demonstrate a clear competitive advantage, as its ROIC remains below the WACC, indicating value shedding despite a growing profitability trend. Its income statement shows favorable margins and strong net margin growth over the overall period, but revenue growth slowed recently.
Looking ahead, Delta’s extensive domestic and international hubs provide a solid platform for expansion. Opportunities lie in leveraging its large fleet and diverse market presence, particularly in Atlantic and Latin American routes, to capture growing air travel demand.
SWOT Analysis
This analysis highlights Delta Air Lines’ core competitive position and challenges to guide strategic decisions.
Strengths
- extensive global hub network
- strong brand recognition
- improving profitability metrics
Weaknesses
- low liquidity ratios
- high debt to equity ratio
- moderate ROIC below WACC
Opportunities
- expanding international routes
- growing cargo demand
- leveraging technology for customer experience
Threats
- volatile fuel prices
- intense industry competition
- economic downturn risks
Delta’s strengths in network and brand underpin its growth. However, liquidity and leverage issues require cautious capital management. Seizing international expansion and cargo growth will be critical while managing external risks.
Stock Price Action Analysis
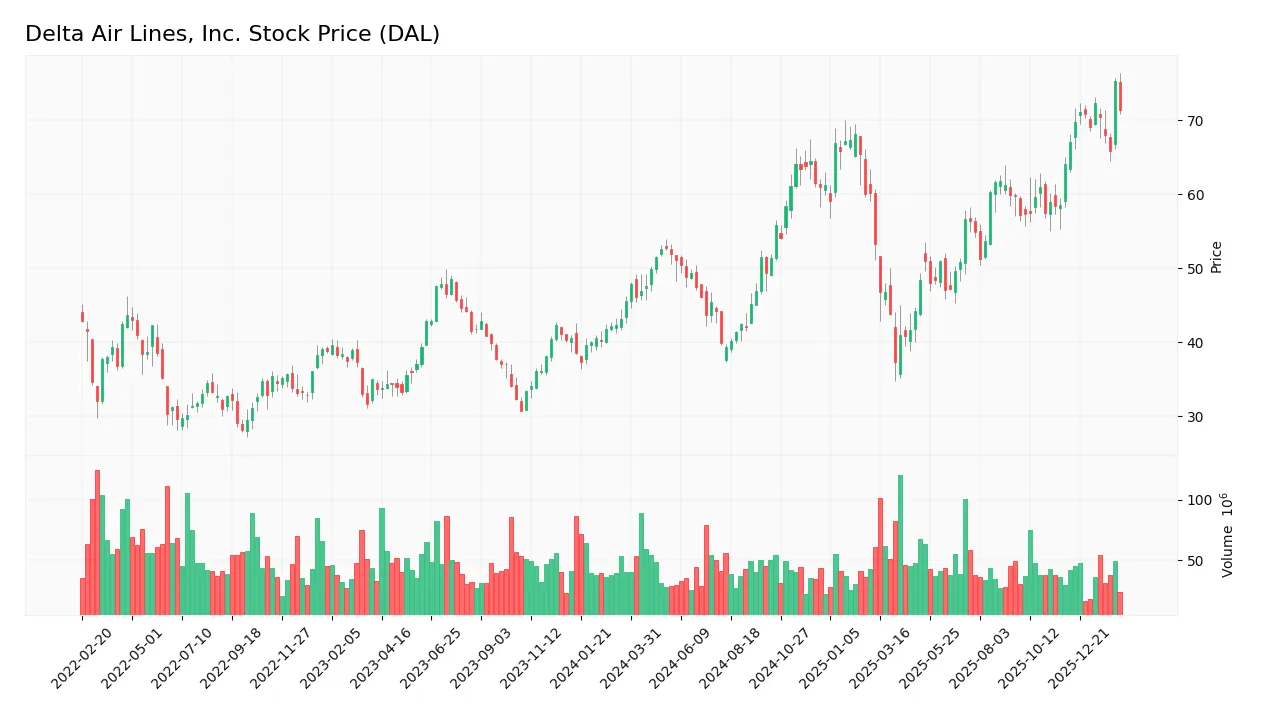
The following weekly chart illustrates Delta Air Lines, Inc.’s stock price movement over the last 100 weeks:
Trend Analysis
Over the past two years, DAL’s stock price rose 56.66%, reflecting a strong bullish trend with accelerating momentum. The price ranged between 37.25 and 75.35, exhibiting a 9.18 standard deviation, indicating notable volatility. Recent three-month gains of 11.42% continued this bullish momentum with moderate volatility at 2.91.
Volume Analysis
Trading volume has been decreasing overall, with buyers accounting for 60.08% of activity historically. In the recent three months, buyer dominance slightly declined to 58.2%, suggesting continued but modest buyer control. This volume pattern indicates steady investor interest amid reduced market participation.
Target Prices
Analysts set a clear target consensus for Delta Air Lines, Inc. based on current market conditions.
| Target Low | Target High | Consensus |
|---|---|---|
| 70 | 88 | 80.54 |
The target prices suggest moderate upside potential, with a consensus around $80.54, reflecting cautious optimism in airline recovery trends.

Don’t Let Luck Decide Your Entry Point
Optimize your entry points with our advanced ProRealTime indicators. You’ll get efficient buy signals with precise price targets for maximum performance. Start outperforming now!
Analyst & Consumer Opinions
This section examines Delta Air Lines, Inc.’s analyst grades and consumer feedback to gauge market and customer sentiment.
Stock Grades
Here are the latest verified stock grades for Delta Air Lines, Inc. from leading financial institutions:
| Grading Company | Action | New Grade | Date |
|---|---|---|---|
| UBS | Maintain | Buy | 2026-01-14 |
| Barclays | Maintain | Overweight | 2026-01-12 |
| Susquehanna | Maintain | Positive | 2026-01-09 |
| TD Cowen | Maintain | Buy | 2026-01-07 |
| B of A Securities | Maintain | Buy | 2026-01-06 |
| Goldman Sachs | Maintain | Buy | 2026-01-06 |
| B of A Securities | Maintain | Buy | 2025-10-15 |
| Deutsche Bank | Maintain | Buy | 2025-10-10 |
| Bernstein | Maintain | Outperform | 2025-10-10 |
| UBS | Maintain | Buy | 2025-10-10 |
The consensus reflects a strong positive bias with the majority rating Delta as “Buy” or better. No downgrades or sell ratings are present, indicating stable analyst confidence.
Consumer Opinions
Delta Air Lines commands strong loyalty from travelers who praise its reliability and customer service. However, some challenges persist in pricing and flight delays.
| Positive Reviews | Negative Reviews |
|---|---|
| Friendly and helpful flight attendants | Frequent delays during peak travel times |
| Consistently clean and comfortable cabins | Higher ticket prices compared to competitors |
| Efficient boarding process | Inconsistent Wi-Fi connectivity onboard |
| Great loyalty program benefits | Limited food options on longer flights |
Overall, consumers admire Delta’s service quality and comfort but express frustration over pricing and punctuality. These factors remain critical for maintaining its competitive edge.
Risk Analysis
Below is a summary of key risks facing Delta Air Lines, Inc., categorized by probability and impact:
| Category | Description | Probability | Impact |
|---|---|---|---|
| Liquidity Risk | Current ratio at 0.4 signals tight short-term liquidity. | High | High |
| Leverage Risk | Debt-to-equity ratio of 1.02 indicates elevated financial leverage. | Medium | Medium |
| Bankruptcy Risk | Altman Z-Score of 1.28 places Delta in the distress zone. | Medium | High |
| Dividend Risk | Dividend yield under 1% may limit income appeal. | Low | Low |
| Market Volatility | Beta of 1.34 exposes stock to above-market swings. | High | Medium |
Liquidity stands out as the most pressing vulnerability. The current ratio well below 1 raises red flags about covering near-term obligations. Coupled with a distress-zone Altman Z-Score, these factors signal elevated financial stress. Elevated leverage amplifies risks during economic downturns. Investors should weigh these risks carefully despite Delta’s strong ROE and favorable valuation metrics.
Should You Buy Delta Air Lines, Inc.?
Delta Air Lines, Inc. appears to show improving operational efficiency with growing profitability, yet it faces a challenging leverage profile indicated by substantial debt. While its competitive moat seems slightly favorable, the overall rating of A- suggests a cautiously optimistic investment case.
Strength & Efficiency Pillars
Delta Air Lines, Inc. delivers solid operational efficiency with a net margin of 7.9% and return on equity at a favorable 24.12%. Its return on invested capital (ROIC) stands at 8.3%, just above its weighted average cost of capital (WACC) at 7.81%, indicating slight value creation. The company’s interest coverage ratio of 8.23 underscores manageable debt service costs. Despite a neutral EBIT margin of 8.82%, Delta’s improving profitability trends and strong Piotroski score of 7 reflect operational resilience.
Weaknesses and Drawbacks
Delta Air Lines is in financial distress, as evidenced by an Altman Z-Score of 1.28, placing it firmly in the Distress Zone with heightened bankruptcy risk. This red flag overshadows other metrics. The company’s leverage is concerning, with a debt-to-equity ratio of 1.02 and critically low liquidity ratios—current ratio at 0.4 and quick ratio at 0.34—indicating potential short-term solvency issues. Additionally, a low dividend yield of 0.98% and moderate price-to-book ratio (2.17) suggest limited market confidence and valuation challenges.
Our Final Verdict about Delta Air Lines, Inc.
Despite operational strengths and a bullish long-term price trend, Delta’s solvency risk, highlighted by its Altman Z-Score of 1.28 in the Distress Zone, makes the investment profile highly speculative. The company might appear operationally sound, but financial distress risks make it too risky for conservative capital. Investors should weigh these risks carefully and consider a cautious stance until solvency improves.
Disclaimer: This content is for informational purposes only and does not constitute financial, investment, or other professional advice. Investing in financial markets involves a significant risk of loss, and past performance is not indicative of future results.
Additional Resources
- Is It Time To Consider Buying Delta Air Lines, Inc. (NYSE:DAL)? – Yahoo Finance (Feb 10, 2026)
- DELTA AIR LINES, INC. SEC 10-K Report – TradingView (Feb 11, 2026)
- Signature Estate & Investment Advisors LLC Cuts Stake in Delta Air Lines, Inc. $DAL – MarketBeat (Feb 10, 2026)
- Insider Selling: Steven Sear Sells 38,600 Shares of Delta Air Li – GuruFocus (Feb 11, 2026)
- Delta Air Lines (DAL) Is Up 14.4% After Big Widebody Orders And Dividend Payout – What’s Changed – Sahm (Feb 08, 2026)
For more information about Delta Air Lines, Inc., please visit the official website: delta.com