Home > Analyses > Technology > Dell Technologies Inc.
Dell Technologies Inc. powers the digital backbone of businesses and individuals worldwide, shaping how people connect, compute, and innovate. Its leadership in computer hardware blends with cutting-edge solutions in cloud infrastructure and hybrid IT, spanning servers, storage, and client devices. Dell’s reputation for quality and innovation cements its influence across technology sectors. As market dynamics shift, I question whether Dell’s fundamentals still support its premium valuation and growth ambitions in 2026.

Table of contents
Business Model & Company Overview
Dell Technologies Inc., founded in 1984 and headquartered in Round Rock, Texas, stands as a dominant force in the computer hardware industry. Its ecosystem spans three core segments: Infrastructure Solutions, Client Solutions, and VMware. Together, they provide a comprehensive portfolio of IT products and services, from next-gen storage and servers to hybrid cloud and digital workspace solutions, forming a cohesive platform that drives digital transformation for enterprises worldwide.
The company’s revenue engine balances hardware sales—desktops, servers, and peripherals—with high-margin, recurring software and cloud services. Dell’s strategic presence spans the Americas, Europe, and Asia, enabling it to capture growth in diverse markets. Its competitive advantage lies in integrating hardware with software and services, creating a durable economic moat that shapes the future of IT infrastructure globally.
Financial Performance & Fundamental Metrics
I analyze Dell Technologies Inc.’s income statement, key financial ratios, and dividend payout policy to assess its operational efficiency and shareholder returns.
Income Statement
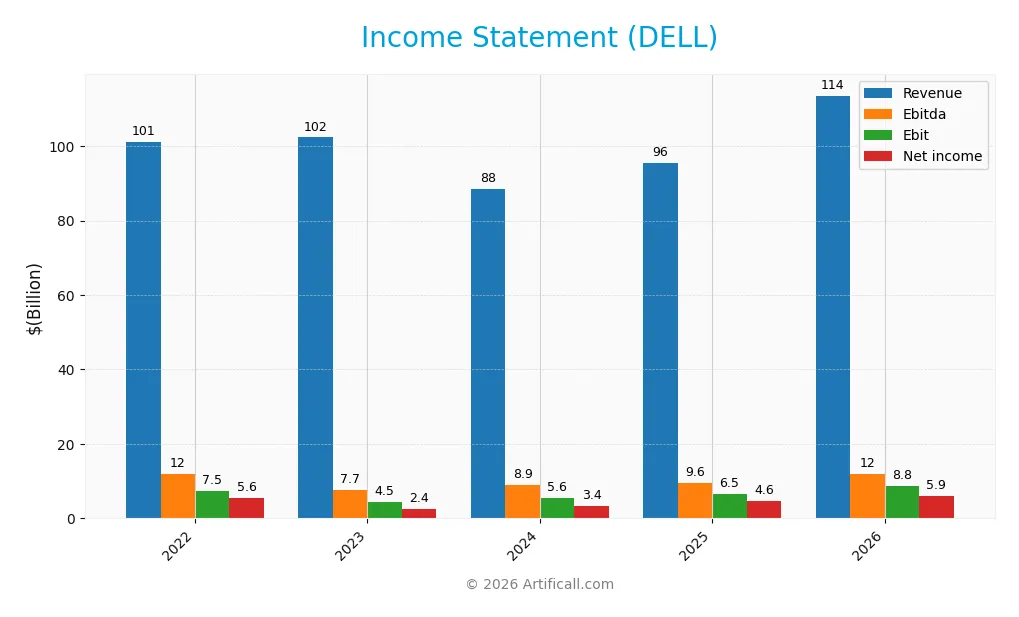
This table summarizes Dell Technologies Inc.’s key income statement figures for the fiscal years 2022 through 2026.
| 2022 | 2023 | 2024 | 2025 | 2026 | |
|---|---|---|---|---|---|
| Revenue | 101.2B | 102.3B | 88.4B | 95.6B | 113.5B |
| Cost of Revenue | 79.3B | 79.6B | 67.4B | 74.3B | 90.8B |
| Operating Expenses | 17.2B | 16.9B | 15.7B | 15.0B | 14.3B |
| Gross Profit | 21.9B | 22.7B | 21.1B | 21.3B | 22.7B |
| EBITDA | 12.0B | 7.7B | 8.9B | 9.6B | 11.9B |
| EBIT | 7.5B | 4.5B | 5.6B | 6.5B | 8.8B |
| Interest Expense | 1.5B | 1.3B | 1.5B | 1.4B | 1.6B |
| Net Income | 5.6B | 2.4B | 3.4B | 4.6B | 5.9B |
| EPS | 7.3 | 3.3 | 4.7 | 6.5 | 9.0 |
| Filing Date | 2022-03-24 | 2023-03-30 | 2024-03-25 | 2025-03-25 | 2026-03-16 |
Income Statement Evolution
From 2022 to 2026, Dell Technologies’ revenue grew steadily by 12.2%, with a significant 18.8% jump in the last year. Net income also increased by 6.7% overall, reflecting improved profitability. Gross margin remained stable at 20%, while net margin slightly declined overall but improved in the most recent year, indicating better cost management.
Is the Income Statement Favorable?
In 2026, Dell reported $114B revenue and $5.94B net income, marking strong year-over-year growth. The net margin rose to 5.23%, a favorable sign amid rising revenues and expenses. Interest expense as a percentage of revenue improved, supporting operating leverage. Overall, the fundamentals show solid growth, efficient capital allocation, and prudent expense control, signaling a favorable income statement.
Financial Ratios
The following table presents key financial ratios for Dell Technologies Inc. over the past five fiscal years, highlighting profitability, liquidity, leverage, efficiency, and dividend metrics:
| Ratios | 2022 | 2023 | 2024 | 2025 | 2026 |
|---|---|---|---|---|---|
| Net Margin | 5.5% | 2.4% | 3.8% | 4.8% | 5.2% |
| ROE | -3.3% | -0.8% | -1.5% | -3.1% | -2.4% |
| ROIC | 9.2% | 9.7% | 11.0% | 14.7% | 15.0% |
| P/E | 7.7 | 12.7 | 18.8 | 15.7 | 13.3 |
| P/B | -25.4 | -9.9 | -28.5 | -48.7 | -32.1 |
| Current Ratio | 0.80 | 0.82 | 0.74 | 0.78 | 0.91 |
| Quick Ratio | 0.70 | 0.73 | 0.67 | 0.63 | 0.75 |
| D/E | -16.0 | -9.5 | -11.7 | -16.6 | -12.8 |
| Debt-to-Assets | 29.1% | 33.0% | 31.7% | 30.8% | 31.1% |
| Interest Coverage | 3.0x | 4.5x | 3.6x | 4.4x | 5.4x |
| Asset Turnover | 1.09 | 1.14 | 1.08 | 1.20 | 1.12 |
| Fixed Asset Turnover | 18.7 | 16.5 | 13.7 | 15.1 | 17.0 |
| Dividend Yield | 0.0% | 3.1% | 1.7% | 1.8% | 1.8% |
Evolution of Financial Ratios
Over the 2022-2026 period, Dell’s Return on Equity (ROE) remained negative, worsening to -240.32% in 2026, signaling persistent equity challenges. The Current Ratio improved slightly to 0.91 in 2026, yet stayed below 1, indicating liquidity constraints. Debt-to-Equity Ratio stayed negative, reflecting complex capital structure dynamics with notable leverage.
Are the Financial Ratios Fovorable?
In 2026, Dell’s profitability shows a neutral net margin of 5.23% but an unfavorable ROE. The Return on Invested Capital (ROIC) at 15% surpasses the 7.91% WACC, indicating value generation. Liquidity ratios—Current (0.91) and Quick (0.75)—are unfavorable, suggesting tight short-term financial flexibility. Leverage metrics like Debt-to-Equity (-12.75) and Interest Coverage (5.66) are favorable. Market valuation metrics, including P/E (13.34) and Price-to-Book (-32.06), also rate favorably, supporting a generally positive ratio profile.
Shareholder Return Policy
Dell Technologies maintains a steady dividend payout ratio around 25%, with a dividend yield near 1.8% in 2026. The company supports distributions through free cash flow, offering a dividend per share that has gradually increased from $1.31 in 2023 to $2.11 in 2026. Share buybacks are also part of its capital return strategy.
This balanced approach aligns dividend payments with cash generation, mitigating risks of unsustainable payouts. The combination of dividends and buybacks supports shareholder returns while preserving capital for operations, indicating a sustainable long-term value creation framework.
Score analysis
The following radar chart presents a comprehensive view of Dell Technologies Inc.’s key financial scores:
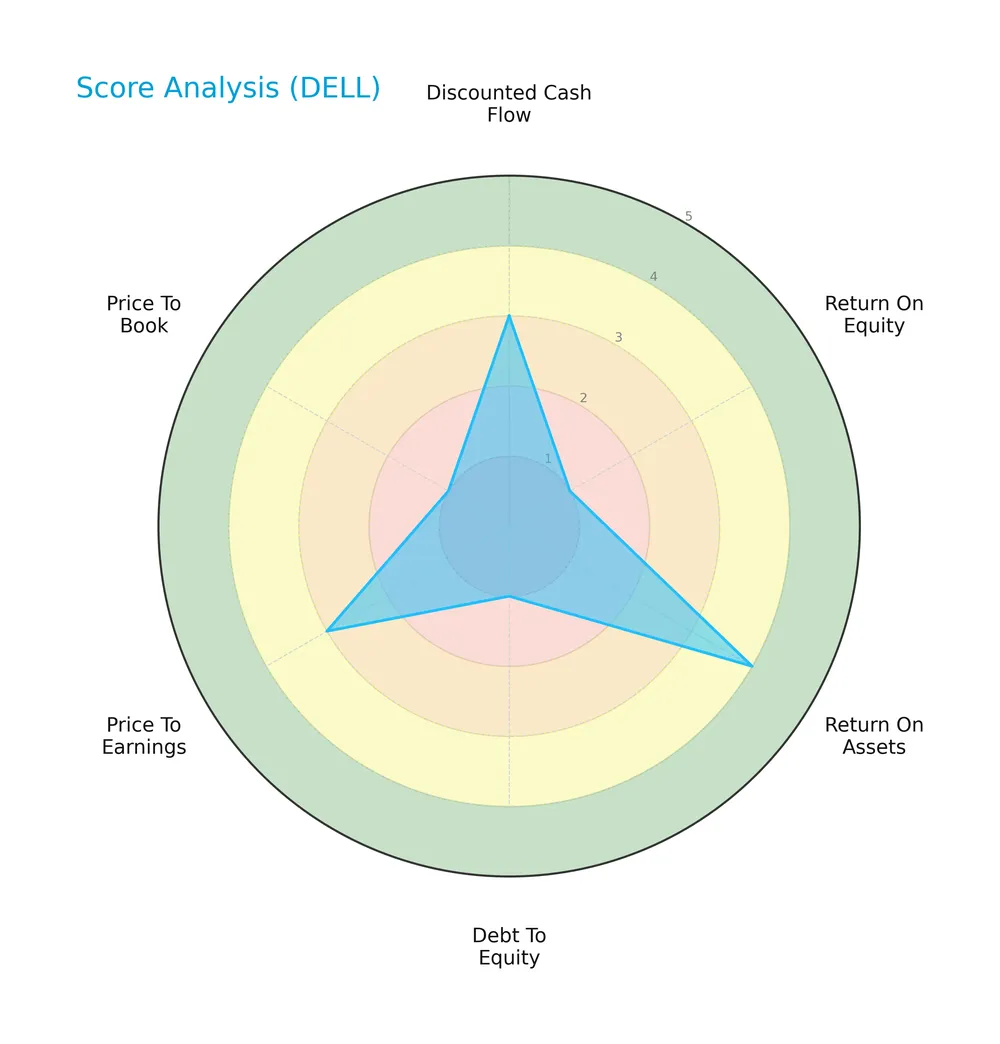
Dell shows a mixed profile with a moderate discounted cash flow and price-to-earnings scores. However, its return on equity, debt-to-equity, and price-to-book scores are very unfavorable, offset by a favorable return on assets score.
Analysis of the company’s bankruptcy risk
Dell’s Altman Z-Score places it in the grey zone, indicating a moderate risk of bankruptcy in the near term:

Is the company in good financial health?
The Piotroski Score diagram illustrates Dell’s financial strength based on nine criteria:

With a strong score of 7, Dell demonstrates solid financial health, reflecting robust profitability, liquidity, and efficiency compared to weaker peers.
Competitive Landscape & Sector Positioning
This section analyzes Dell Technologies Inc.’s strategic positioning, revenue streams, key products, and main competitors. I will assess whether Dell holds a competitive advantage within the technology sector.
Strategic Positioning
Dell Technologies Inc. maintains a diversified product portfolio across IT infrastructure, client solutions, and VMware cloud services. Geographically, it balances revenue between the US (63B in 2026) and international markets (50B). This mix drives resilience amid sector fluctuations.
Revenue by Segment
This pie chart illustrates Dell Technologies Inc.’s revenue breakdown by business segments for fiscal year 2026, highlighting the dominant contributors to its top line.
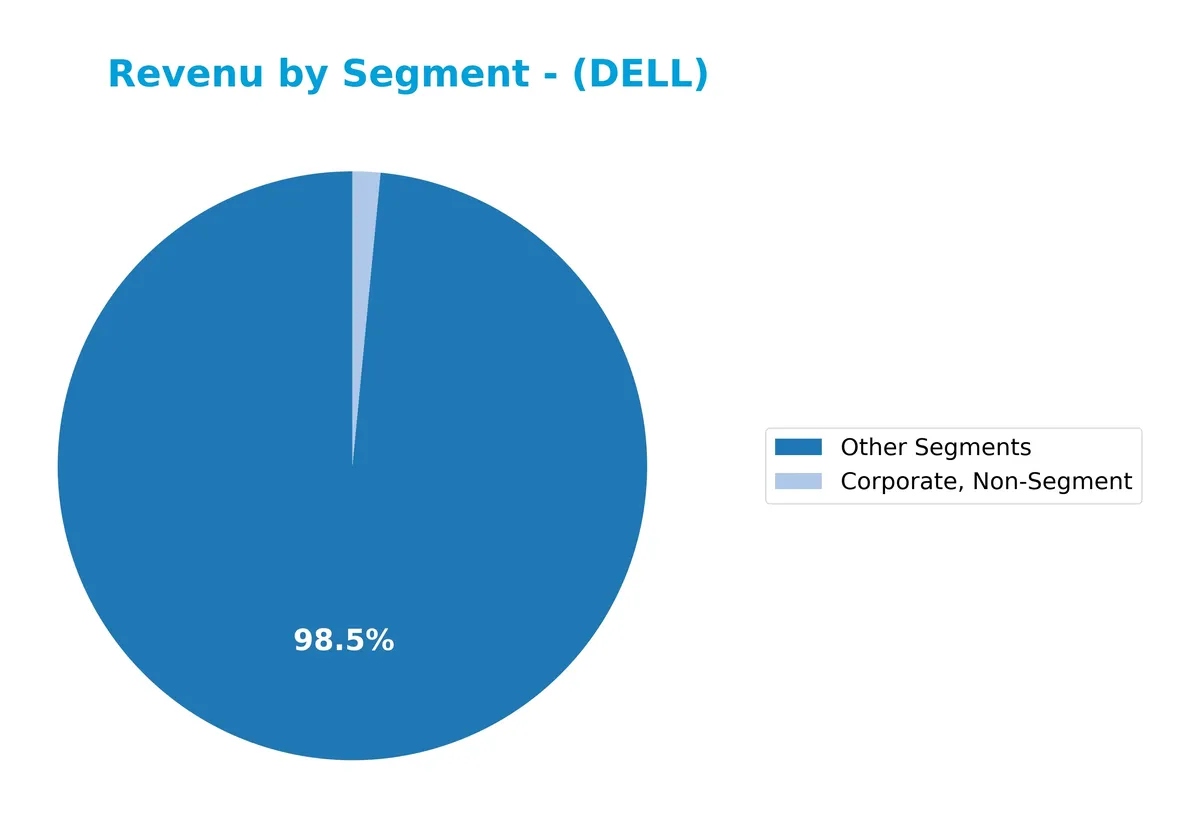
The “Other Segments” category overwhelmingly drives Dell’s revenue at 112B in 2026, showing a sharp increase from 92B in 2025. Meanwhile, “Corporate, Non-Segment” remains minimal at 1.7B, reflecting limited direct revenue impact. This concentration signals a shift away from previously reported segments like Client Solutions and Infrastructure Solutions, which have diminished or disappeared, raising potential concentration risk despite strong top-line growth.
Key Products & Brands
The table below summarizes Dell Technologies Inc.’s core product lines and business segments:
| Product | Description |
|---|---|
| Client Solutions Group (CSG) | Desktops, workstations, notebooks, displays, projectors, attached and third-party software and peripherals, plus support services. |
| Infrastructure Solutions Group (ISG) | Traditional and next-gen storage; rack, blade, tower, hyperscale servers; networking products; software, peripherals, and related services. |
| VMware Segment | Hybrid and multi-cloud solutions, modern applications, networking, security, and digital workspaces management software. |
| Other Segments | Various IT solutions and services not allocated to main segments, including information security, cloud software, and IaaS. |
| Corporate, Non-Segment | Corporate expenses and non-segment specific costs. |
Dell’s revenue heavily relies on its Client Solutions and Infrastructure Solutions segments. VMware adds strategic value through cloud and hybrid IT solutions. Other segments and corporate costs represent smaller portions of overall business.
Main Competitors
Dell Technologies Inc. faces competition from 12 companies, with the table below listing the top 10 leaders by market capitalization:
| Competitor | Market Cap. |
|---|---|
| Arista Networks, Inc. | 168B |
| Dell Technologies Inc. | 86B |
| Western Digital Corporation | 65B |
| Seagate Technology Holdings plc | 61B |
| Pure Storage, Inc. | 22B |
| NetApp, Inc. | 21B |
| HP Inc. | 21B |
| Super Micro Computer, Inc. | 18B |
| IonQ, Inc. | 16B |
| D-Wave Quantum Inc. | 9B |
Dell Technologies ranks second among its competitors. Its market cap stands at 69% of the leader, Arista Networks. Dell is above both the average market cap of the top 10 (48.7B) and the sector median (21B). The company maintains a strong lead, with a 45% premium over the next competitor above in the ranking.
Comparisons with competitors
Check out how we compare the company to its competitors:
Does DELL have a competitive advantage?
Dell Technologies Inc. demonstrates a clear competitive advantage, supported by its very favorable ROIC exceeding WACC by 7.1%, indicating efficient capital use and value creation. The company’s growing ROIC trend confirms sustained profitability and effective management in a competitive technology sector.
Looking ahead, Dell’s diverse segments—Infrastructure Solutions, Client Solutions, and VMware—position it to capitalize on hybrid cloud growth and IT modernization. Expansion in multi-cloud services and next-generation storage offers promising opportunities to strengthen its market presence globally.
SWOT Analysis
This analysis highlights Dell Technologies Inc.’s key internal and external factors shaping its competitive position and growth prospects.
Strengths
- strong revenue growth at 18.8% YoY
- favorable ROIC at 15% exceeding WACC
- diversified segments including VMware
- large market cap of 116B USD
- solid interest coverage ratio at 5.66
Weaknesses
- low current ratio at 0.91 signals liquidity risk
- negative ROE at -240% is concerning
- net margin growth declining over 5 years
- dependence on hardware segment with lower margins
Opportunities
- expanding hybrid and multi-cloud demand
- growth in US and Non-US markets, US revenue at 63B USD
- potential to leverage increasing digital transformation
- room to improve operational efficiencies
Threats
- intense competition in computer hardware space
- supply chain disruptions impacting manufacturing
- rapid technology shifts requiring continuous innovation
- macroeconomic uncertainties affecting IT budgets
Dell’s strong capital allocation and growing ROIC confirm a sustainable moat, despite liquidity and profitability headwinds. Its strategic focus on cloud and infrastructure solutions aligns well with market trends, but investors must monitor operational risks carefully.
Stock Price Action Analysis
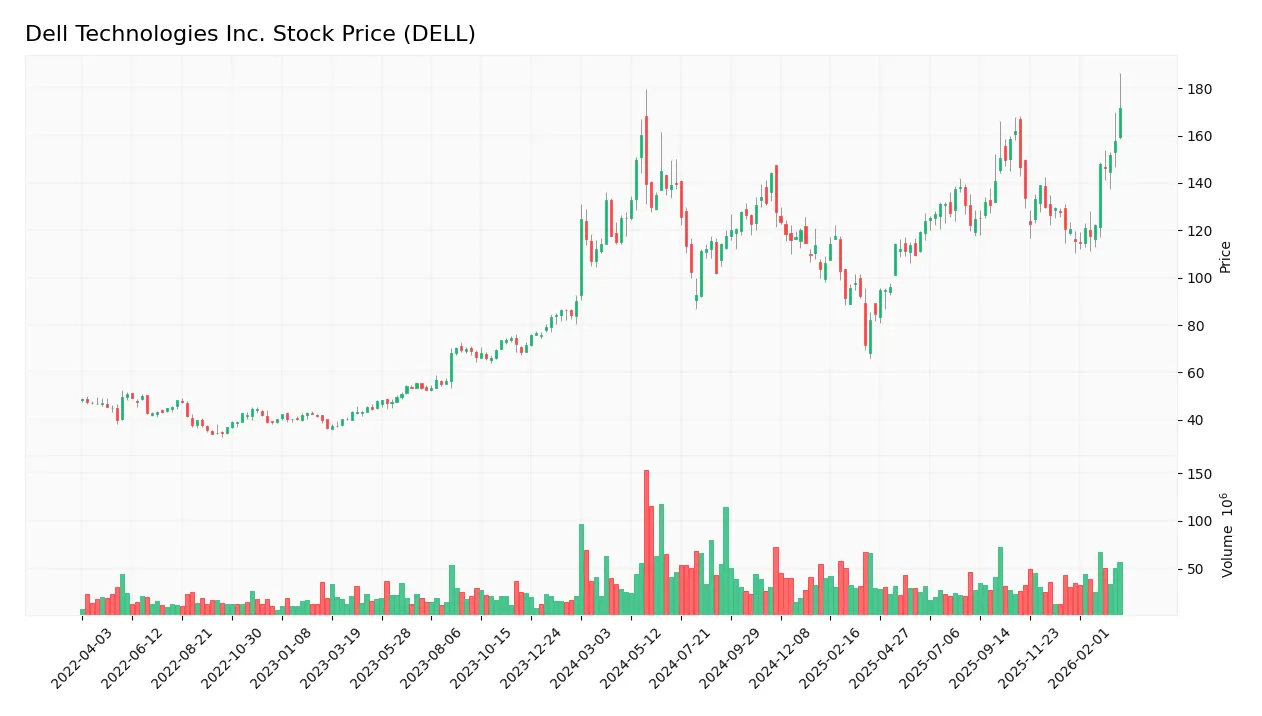
The weekly stock chart displays Dell Technologies Inc.’s price movement over the past 12 months, highlighting key highs and lows:
Trend Analysis
Over the past 12 months, Dell’s stock price increased 37.34%, indicating a bullish trend. The trend shows acceleration with a high of 171.81 and a low of 71.63. Volatility is notable, with an 18.16 standard deviation, confirming strong price fluctuations.
Volume Analysis
Trading volume totals 4.8B shares, with buyers accounting for 54.76%. Volume is decreasing, reflecting waning market participation. Recent three-month data shows slight buyer dominance at 54.56%, suggesting cautious optimism amid reduced activity.
Target Prices
The consensus target price for Dell Technologies Inc. reflects cautiously optimistic analyst expectations.
| Target Low | Target High | Consensus |
|---|---|---|
| 101 | 200 | 164.45 |
Analysts project a wide range, with a strong midpoint near 164, indicating confidence in Dell’s growth potential amid market volatility.

Don’t Let Luck Decide Your Entry Point
Optimize your entry points with our advanced ProRealTime indicators. You’ll get efficient buy signals with precise price targets for maximum performance. Start outperforming now!
Analyst & Consumer Opinions
This section examines Dell Technologies Inc.’s analyst ratings and consumer feedback to provide insight into market sentiment.
Stock Grades
Here are the latest verified analyst grades for Dell Technologies Inc., reflecting diverse institutional perspectives:
| Grading Company | Action | New Grade | Date |
|---|---|---|---|
| B of A Securities | Maintain | Buy | 2026-03-23 |
| Barclays | Maintain | Overweight | 2026-02-27 |
| Piper Sandler | Maintain | Overweight | 2026-02-27 |
| Mizuho | Maintain | Outperform | 2026-02-27 |
| Morgan Stanley | Maintain | Underweight | 2026-02-18 |
| Citigroup | Maintain | Buy | 2026-02-17 |
| Citigroup | Maintain | Buy | 2026-01-20 |
| Morgan Stanley | Maintain | Underweight | 2026-01-20 |
| Barclays | Upgrade | Overweight | 2026-01-15 |
| Goldman Sachs | Maintain | Buy | 2026-01-14 |
The consensus shows a strong bias toward buying or overweight ratings, with few underweight views mostly from Morgan Stanley. This mix indicates cautious optimism among major brokers.
Consumer Opinions
Consumer sentiment around Dell Technologies Inc. reflects a mix of appreciation for product reliability and frustration with customer service.
| Positive Reviews | Negative Reviews |
|---|---|
| “Dell laptops deliver strong performance and durability.” | “Customer support response times are often slow and unhelpful.” |
| “The build quality and design feel premium for the price.” | “Software updates sometimes cause unexpected glitches.” |
| “Wide product range meets both personal and business needs.” | “Occasional issues with warranty claim processes.” |
Overall, users praise Dell’s solid hardware and product variety. However, recurring complaints about customer service and software stability suggest room for improvement.
Risk Analysis
Below is a summary table highlighting Dell Technologies Inc.’s key risk factors with their likelihood and potential impact:
| Category | Description | Probability | Impact |
|---|---|---|---|
| Liquidity Risk | Current ratio of 0.91 signals tight short-term liquidity, potentially straining working capital. | High | Medium |
| Profitability | Negative ROE (-240.32%) indicates poor shareholder returns despite favorable ROIC and WACC. | Medium | High |
| Financial Health | Altman Z-Score of 2.04 places Dell in the “grey zone,” suggesting moderate bankruptcy risk. | Medium | High |
| Debt Management | Debt-to-equity and price-to-book scores are very unfavorable, reflecting weak capital structure. | Medium | Medium |
| Market Volatility | Beta near 1.04 implies stock price moves closely with the market, adding systematic risk. | High | Medium |
The most pressing risks are Dell’s weak ROE and borderline Altman Z-Score, signaling caution despite favorable operational metrics. Recent market volatility and tight liquidity conditions could pressure the firm’s financial flexibility. Investors must weigh these factors carefully against Dell’s solid infrastructure and cloud positioning.
Should You Buy Dell Technologies Inc.?
Dell appears to be generating robust value creation with a durable competitive moat supported by growing ROIC above WACC. Despite a challenging leverage profile and mixed rating signals, the overall C+ rating suggests a cautiously favorable financial position.
Strength & Efficiency Pillars
Dell Technologies Inc. demonstrates operational resilience with a net margin of 5.23% and an EBIT margin of 7.77%. The company’s return on invested capital (ROIC) stands at 15.0%, well above its weighted average cost of capital (WACC) of 7.91%, marking it as a value creator. Despite a negative return on equity of -240.32%, Dell’s robust asset turnover of 1.12 and fixed asset turnover of 17.01 underscore efficient asset utilization fueling profitability.
Weaknesses and Drawbacks
Dell resides in the Altman Z-Score grey zone at 2.04, signaling moderate bankruptcy risk that demands caution. Its current ratio of 0.91 and quick ratio of 0.75 reveal liquidity constraints, increasing short-term solvency concerns. Additionally, the company shows a very unfavorable price-to-book score of -32.06 and a weak return on equity, reflecting market skepticism and potential capital structure inefficiencies. These factors may pressure valuation and investor confidence.
Our Final Verdict about Dell Technologies Inc.
Dell’s profile suggests a fundamentally strong business with favorable ROIC and operational margins. However, its grey zone Altman Z-Score implies moderate financial risk. Despite a bullish overall stock trend and slight buyer dominance recently, investors might consider a cautious wait-and-see approach until liquidity and solvency metrics improve to reduce risk exposure.
Disclaimer: This content is for informational purposes only and does not constitute financial, investment, or other professional advice. Investing in financial markets involves a significant risk of loss, and past performance is not indicative of future results.
Additional Resources
- DELL Stock Quote Price and Forecast – CNN (Mar 26, 2026)
- Dell Technologies Inc. $DELL Shares Acquired by Romano Brothers AND Company – MarketBeat (Mar 28, 2026)
- Dell Technologies Inc. (DELL) Is a Trending Stock: Facts to Know Before Betting on It – Yahoo! Finance Canada (Mar 27, 2026)
- Dell Technologies Inc. sees $74.6 million in class C stock sold – Investing.com (Mar 24, 2026)
- Dell Technologies Inc. Cl C stock rises Tuesday, outperforms market – MarketWatch (Mar 24, 2026)
For more information about Dell Technologies Inc., please visit the official website: dell.com