Home > Analyses > Consumer Cyclical > Deckers Outdoor Corporation
Deckers Outdoor shapes how millions experience comfort and performance in everyday footwear. It commands the premium casual and high-performance footwear market with iconic brands like UGG and Hoka. Known for blending innovation with quality, Deckers influences fashion and athletic gear worldwide. As competitors intensify, I ask: does Deckers’ strong brand portfolio and market presence still justify its valuation and growth outlook in 2026?
Table of contents
Business Model & Company Overview
Deckers Outdoor Corporation, founded in 1973 and headquartered in Goleta, California, commands a dominant position in the footwear and apparel industry. It unites premium brands such as UGG, Teva, Sanuk, Hoka, and Koolaburra into a cohesive ecosystem that serves both casual lifestyle consumers and high-performance athletes. This diverse portfolio reinforces its mission to blend comfort with innovation across multiple market segments.
The company’s revenue engine balances direct-to-consumer retail—149 stores worldwide—and robust e-commerce channels with wholesale distribution across the Americas, Europe, Asia-Pacific, and Latin America. Deckers monetizes through a mix of high-margin branded footwear and apparel, leveraging global reach and brand loyalty. Its strong economic moat stems from a reputation for quality and brand differentiation that shapes the future of lifestyle and performance footwear.
Financial Performance & Fundamental Metrics
I analyze Deckers Outdoor Corporation’s income statement, key financial ratios, and dividend payout policy to assess its financial health and shareholder value.
Income Statement
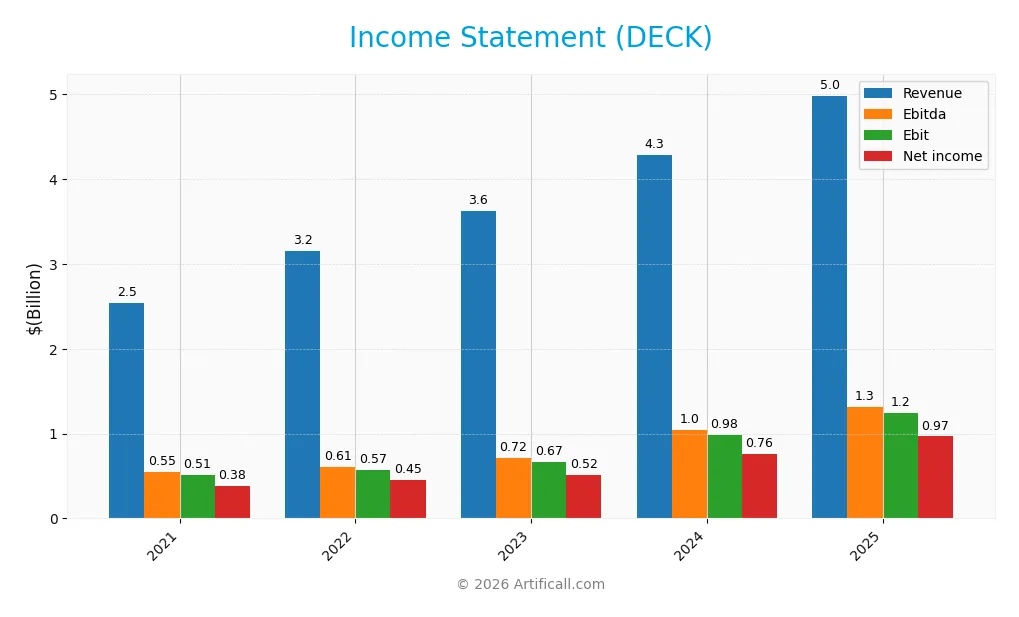
The table below summarizes Deckers Outdoor Corporation’s key income statement metrics for fiscal years 2021 through 2025, measured in USD.
| 2021 | 2022 | 2023 | 2024 | 2025 | |
|---|---|---|---|---|---|
| Revenue | 2.55B | 3.15B | 3.63B | 4.29B | 4.99B |
| Cost of Revenue | 1.17B | 1.54B | 1.80B | 1.90B | 2.10B |
| Operating Expenses | 870M | 1.04B | 1.17B | 1.46B | 1.71B |
| Gross Profit | 1.37B | 1.61B | 1.83B | 2.39B | 2.89B |
| EBITDA | 548M | 610M | 717M | 1.04B | 1.32B |
| EBIT | 508M | 567M | 670M | 982M | 1.25B |
| Interest Expense | 6.03M | 2.08M | 3.44M | 2.56M | 3.52M |
| Net Income | 383M | 452M | 517M | 760M | 966M |
| EPS | 2.27 | 2.74 | 3.25 | 4.89 | 6.36 |
| Filing Date | 2021-05-28 | 2022-05-27 | 2023-05-26 | 2024-05-24 | 2025-05-23 |
Income Statement Evolution
Deckers Outdoor Corporation’s revenue nearly doubled from 2.55B in 2021 to 4.99B in 2025, reflecting robust growth. Net income surged 153% to 966M over the period, with gross margin steady near 58%. EBIT margin improved to 25%, illustrating efficient cost management despite rising operating expenses, which grew in line with revenue.
Is the Income Statement Favorable?
The 2025 income statement shows strong fundamentals. Revenue grew 16.3% year-over-year, while net margin expanded to 19.4%, signaling improved profitability. EBIT growth of 27% outpaced revenue gains, highlighting operational leverage. Interest expenses remain minimal at 0.07% of revenue. Operating expenses rose proportionally, a slight caution amid strong overall performance.
Financial Ratios
The following table presents key financial ratios for Deckers Outdoor Corporation over the past five fiscal years, highlighting profitability, liquidity, leverage, and market valuation metrics:
| Ratios | 2021 | 2022 | 2023 | 2024 | 2025 |
|---|---|---|---|---|---|
| Net Margin | 15% | 14% | 14% | 18% | 19% |
| ROE | 26% | 29% | 29% | 36% | 38% |
| ROIC | 22% | 25% | 24% | 29% | 31% |
| P/E | 24.2 | 16.7 | 23.1 | 31.7 | 17.6 |
| P/B | 6.4 | 4.9 | 6.7 | 11.4 | 6.8 |
| Current Ratio | 3.5 | 3.2 | 3.8 | 3.4 | 3.7 |
| Quick Ratio | 2.9 | 2.3 | 2.8 | 2.7 | 3.1 |
| D/E | 0.15 | 0.14 | 0.14 | 0.13 | 0.11 |
| Debt-to-Assets | 10% | 10% | 10% | 9% | 8% |
| Interest Coverage | 84x | 271x | 190x | 362x | 335x |
| Asset Turnover | 1.17 | 1.35 | 1.42 | 1.37 | 1.37 |
| Fixed Asset Turnover | 6.5 | 7.8 | 7.6 | 8.1 | 8.9 |
| Dividend Yield | 0% | 0% | 0% | 0% | 0% |
All figures are rounded for clarity.
Evolution of Financial Ratios
Return on Equity (ROE) steadily improved from 26.5% in 2021 to 38.4% in 2025, reflecting enhanced profitability. The Current Ratio fluctuated but remained strong above 3.2, indicating solid liquidity. Debt-to-Equity Ratio consistently declined from 0.15 in 2021 to 0.11 in 2025, showing reduced leverage and greater financial stability.
Are the Financial Ratios Fovorable?
In 2025, profitability ratios such as ROE (38.4%) and net margin (19.4%) are favorable, outpacing many sector peers. Liquidity is mixed: the quick ratio (3.07) is favorable, but the current ratio (3.72) is flagged unfavorable, possibly signaling excessive current assets. Leverage ratios remain conservative with debt-to-equity at 0.11. Market multiples show neutrality in P/E (17.6) but unfavorable price-to-book (6.76). Overall, 64% of ratios are favorable.
Shareholder Return Policy
Deckers Outdoor Corporation does not pay dividends, reflecting a strategic choice to reinvest earnings to support growth. The company maintains strong free cash flow, with no dividend payout, and does not engage in share buybacks.
This approach prioritizes capital allocation toward expansion rather than immediate shareholder returns. Such a policy aligns with sustainable long-term value creation, assuming continued profitability and efficient reinvestment of cash flows.
Score analysis
The radar chart below illustrates Deckers Outdoor Corporation’s performance across key financial metrics:
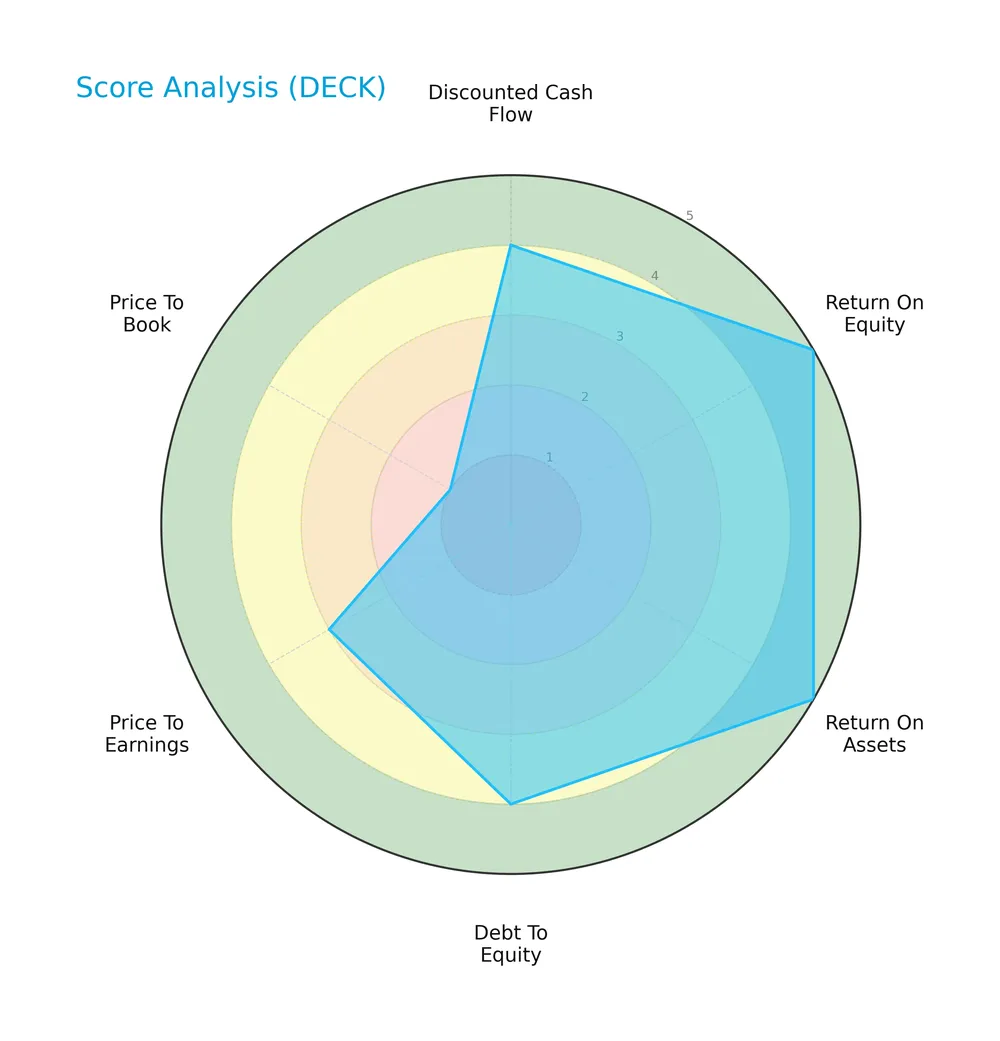
Deckers scores very favorably in return on equity and assets, indicating strong profitability. Its discounted cash flow and debt-to-equity scores are favorable, reflecting efficient capital use and manageable leverage. Price-to-earnings is moderate, while price-to-book remains very unfavorable.
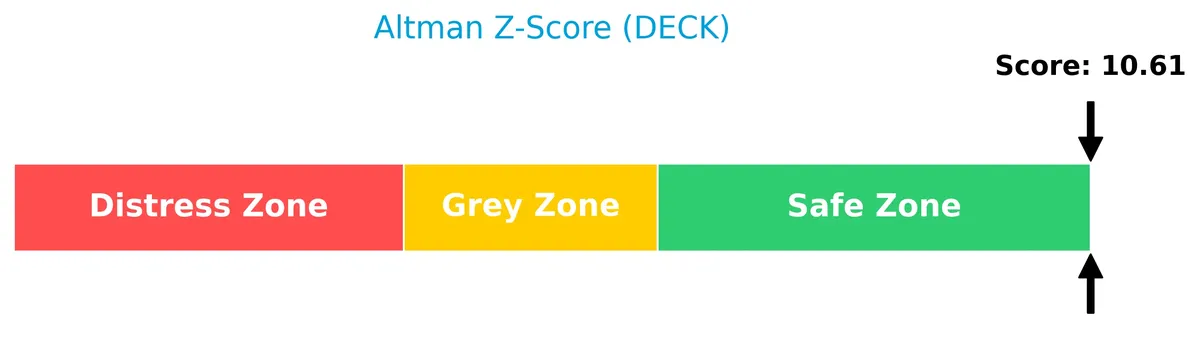
Analysis of the company’s bankruptcy risk
Deckers’ Altman Z-Score places it well within the safe zone, signaling a very low risk of bankruptcy:
Is the company in good financial health?
The Piotroski Score diagram summarizes Deckers’ current financial strength based on profitability, leverage, and efficiency criteria:
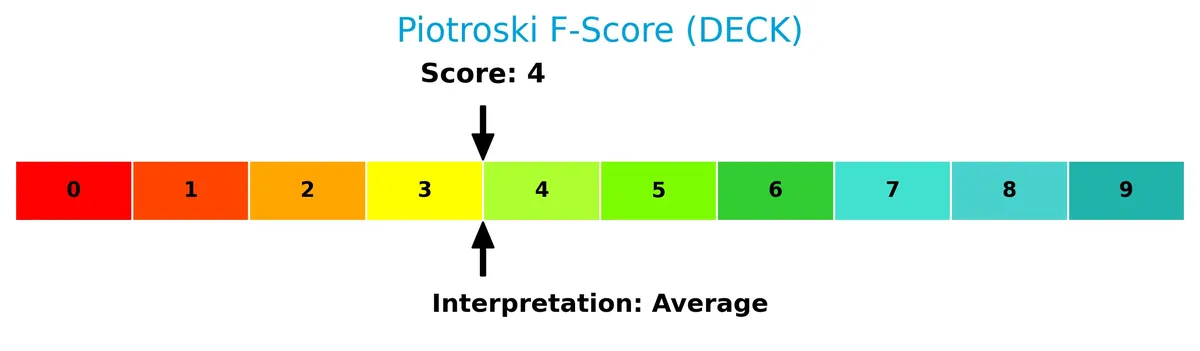
A Piotroski Score of 4 suggests average financial health, indicating moderate strength but room for improvement in financial fundamentals.
Competitive Landscape & Sector Positioning
This analysis reviews Deckers Outdoor Corporation’s strategic positioning, revenue segments, key products, and main competitors. I will assess whether Deckers holds a competitive advantage in the footwear and apparel sector.
Strategic Positioning
Deckers Outdoor maintains a diversified product portfolio across premium and casual footwear brands like UGG, Hoka, Teva, and Sanuk. It balances wholesale and direct-to-consumer channels globally, supported by 149 stores and e-commerce, reflecting broad geographic and distribution exposure.
Revenue by Segment
This pie chart illustrates Deckers Outdoor Corporation’s revenue distribution by segment for the fiscal year ending March 31, 2025.
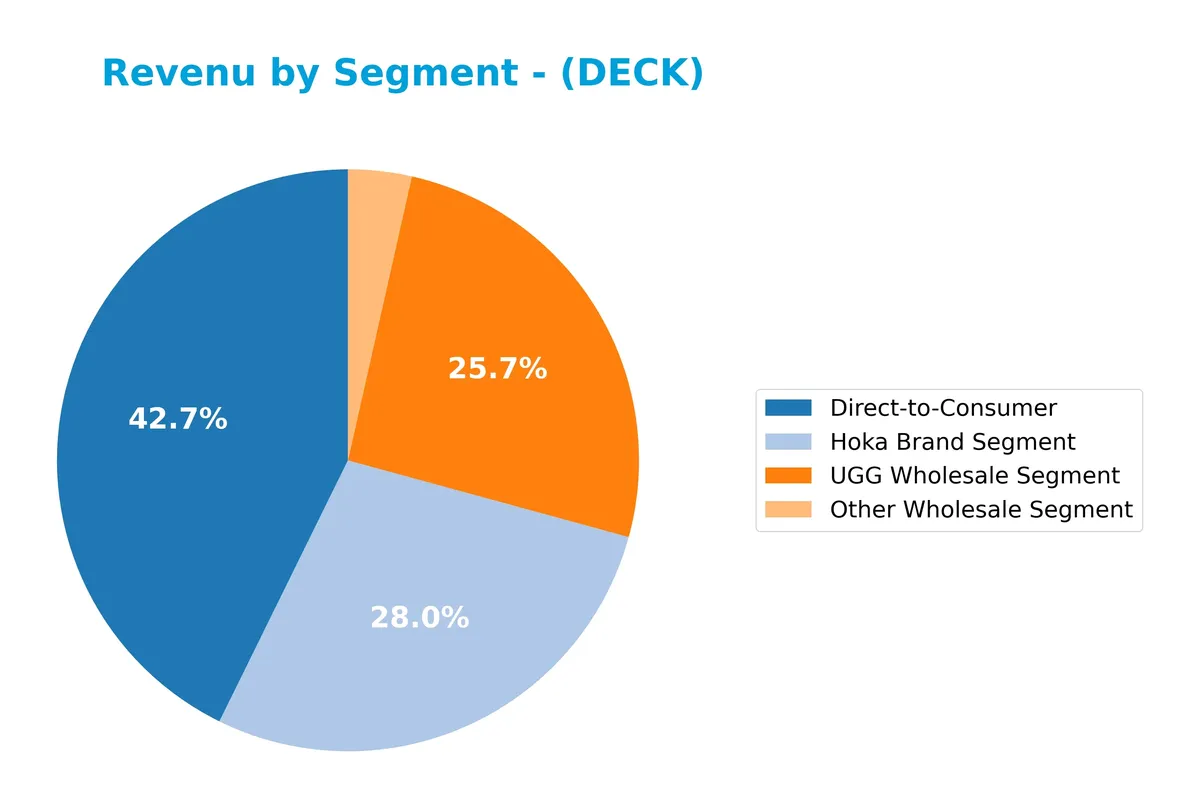
In 2025, Direct-to-Consumer led with $2.13B, showing steady growth and strengthening Deckers’ margin control. The Hoka Brand segment surged to $1.40B, reflecting strong market acceptance and a shift toward performance footwear. UGG Wholesale remained significant at $1.28B but showed slower growth, suggesting potential concentration risk. Other Wholesale contributed $176M, indicating a smaller but stable part of the business mix.
Key Products & Brands
Deckers Outdoor Corporation generates revenue through diverse product lines and brand segments, detailed as follows:
| Product | Description |
|---|---|
| UGG Brand | Premium footwear, apparel, and accessories known for plush materials and casual lifestyle use. |
| Hoka Brand | Footwear and apparel targeting ultra-runners and athletes, focused on high-performance activities. |
| Teva Brand | Sandals, shoes, and boots designed for outdoor and action sports enthusiasts. |
| Sanuk Brand | Relaxed casual shoes and sandals emphasizing comfort and casual style. |
| Koolaburra Brand | Fashion casual footwear using plush materials, positioned as a complement to UGG. |
| Direct-to-Consumer | Sales through owned retail stores and e-commerce platforms, a key distribution channel for all brands. |
| Other Wholesale | Wholesale distribution of various products beyond primary brands, contributing to diversified revenue streams. |
Deckers balances strong brand equity across premium and performance footwear sectors. Direct-to-consumer sales form the largest revenue channel, reflecting effective capital allocation in retail and digital capabilities.
Main Competitors
The sector features 2 competitors; the table lists the top 2 leaders by market capitalization:
| Competitor | Market Cap. |
|---|---|
| NIKE, Inc. | 93.5B |
| Deckers Outdoor Corporation | 16.0B |
Deckers ranks 2nd among its competitors, with a market cap just 17.8% that of NIKE, the clear leader. It sits below both the average market cap of the top 10 and the median for the sector. The gap to NIKE above is substantial, at +463%, highlighting Deckers’ smaller scale in this competitive landscape.
Comparisons with competitors
Check out how we compare the company to its competitors:
Does Deckers have a competitive advantage?
Deckers Outdoor Corporation exhibits a very favorable competitive advantage, evidenced by a ROIC exceeding WACC by over 21.6%, signaling sustained value creation and efficient capital use. The company’s growing ROIC trend of nearly 40% further confirms its strengthening profitability and durable economic moat.
Looking ahead, Deckers’ diverse brand portfolio, including UGG, Teva, and Hoka, positions it well to capture growth in casual lifestyle and performance footwear markets. Expansion through retail stores and e-commerce across global regions offers promising opportunities to extend market reach and revenue streams.
SWOT Analysis
This SWOT analysis highlights Deckers Outdoor Corporation’s critical internal and external factors shaping its strategic outlook.
Strengths
- Strong brand portfolio with UGG, Hoka, Teva
- High ROIC at 31%, well above WACC
- Robust revenue and earnings growth
Weaknesses
- High price-to-book ratio signals overvaluation risk
- Moderate Piotroski score indicates room for financial improvement
- No dividend yield may deter income investors
Opportunities
- Expanding global e-commerce channels
- Growing demand in performance footwear
- Potential to leverage sustainability trends
Threats
- Intense competition in footwear sector
- Economic downturns affecting discretionary spending
- Supply chain disruptions impacting production
Deckers’ strengths in brand power and profitability support a strong moat. However, valuation and moderate financial scores require caution. Growth opportunities in digital and performance markets justify a focused, innovation-driven strategy while managing competitive and macroeconomic risks.
Stock Price Action Analysis
The following weekly stock chart illustrates Deckers Outdoor Corporation’s price fluctuations over the past 100 weeks:
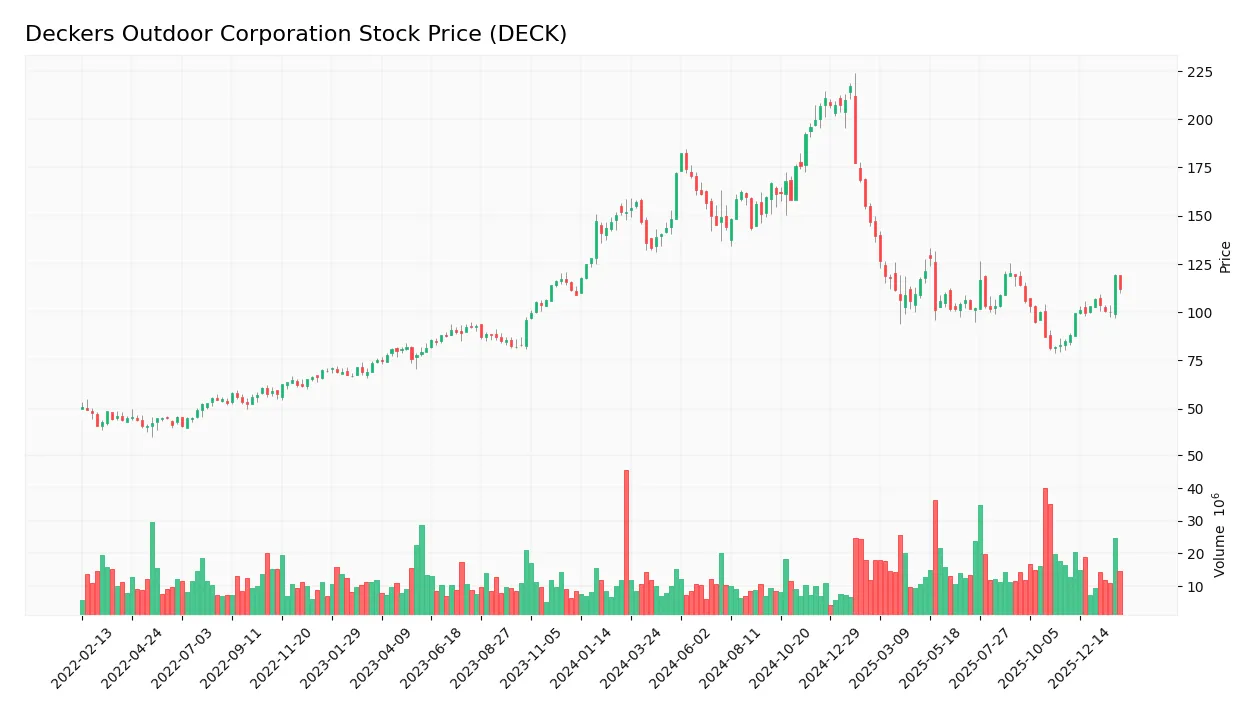
Trend Analysis
Over the past 100 weeks, DECK’s price fell by 26.11%, indicating a bearish trend with accelerating downward momentum. The stock’s highest price reached 217.16, while the lowest hit 81.5. Volatility is high, with a standard deviation of 35.13, reflecting significant price swings during this period.
Volume Analysis
Trading volume has been increasing, with buyers accounting for 51.33% overall. In the recent three-month period, buyer dominance strengthened to 60.01%, suggesting growing investor confidence and stronger market participation favoring demand over supply.
Target Prices
Analysts set a clear target consensus for Deckers Outdoor Corporation, reflecting moderate upside potential.
| Target Low | Target High | Consensus |
|---|---|---|
| 90 | 161 | 119 |
The target range spans from $90 to $161, with a consensus near $119. This indicates cautious optimism in the stock’s future performance.

Don’t Let Luck Decide Your Entry Point
Optimize your entry points with our advanced ProRealTime indicators. You’ll get efficient buy signals with precise price targets for maximum performance. Start outperforming now!
Analyst & Consumer Opinions
This section examines analyst ratings and consumer feedback to provide insight into Deckers Outdoor Corporation’s market perception.
Stock Grades
Here is the latest overview of Deckers Outdoor Corporation’s stock grades from established analysts:
| Grading Company | Action | New Grade | Date |
|---|---|---|---|
| Barclays | Maintain | Overweight | 2026-02-02 |
| Piper Sandler | Maintain | Underweight | 2026-01-30 |
| Needham | Maintain | Buy | 2026-01-30 |
| Telsey Advisory Group | Maintain | Market Perform | 2026-01-30 |
| Wells Fargo | Maintain | Equal Weight | 2026-01-30 |
| UBS | Maintain | Buy | 2026-01-30 |
| Goldman Sachs | Maintain | Sell | 2026-01-30 |
| Stifel | Maintain | Buy | 2026-01-30 |
| Jefferies | Maintain | Hold | 2026-01-30 |
| Jefferies | Maintain | Hold | 2026-01-27 |
The ratings show a broad mix of opinions with a slight tilt towards Buy and Hold grades. Analysts maintain their previous positions, reflecting a stable but cautious consensus on Deckers’ near-term outlook.
Consumer Opinions
Consumer sentiment around Deckers Outdoor Corporation reflects strong brand loyalty mixed with some concerns over pricing.
| Positive Reviews | Negative Reviews |
|---|---|
| Durable, high-quality outdoor footwear. | Premium pricing deters budget-conscious buyers. |
| Excellent customer service and fast shipping. | Some customers report sizing inconsistencies. |
| Stylish designs suitable for both casual and active wear. | Limited availability of certain popular models. |
Overall, customers praise Deckers for durability and style, but pricing and sizing issues emerge as common pain points. The brand’s premium positioning appeals to quality-focused buyers despite these drawbacks.
Risk Analysis
Below is a summary table of key risks facing Deckers Outdoor Corporation, detailing their likelihood and potential impact:
| Category | Description | Probability | Impact |
|---|---|---|---|
| Valuation Risk | Elevated price-to-book ratio at 6.76 signals overvaluation. | Medium | High |
| Market Cyclicality | Apparel sector’s sensitivity to economic downturns. | High | Medium |
| Supply Chain | Disruptions could increase costs and delay inventory. | Medium | Medium |
| Consumer Trends | Shifts away from premium casual footwear reduce demand. | Medium | Medium |
| Dividend Policy | Zero dividend yield may deter income-focused investors. | High | Low |
I observe that market cyclicality and valuation risk stand out. The high P/B ratio flags valuation concerns despite solid returns on equity and capital. The sector’s vulnerability to economic swings demands caution. Deckers’ strong Altman Z-Score (10.6) suggests financial resilience, but evolving consumer preferences and supply chain risks warrant close monitoring.
Should You Buy Deckers Outdoor Corporation?
Deckers appears to be generating robust value creation supported by a durable competitive moat, evidenced by a growing ROIC well above WACC. Its leverage profile seems manageable, while an overall rating of A suggests a very favorable financial standing despite moderate operational scores.
Strength & Efficiency Pillars
Deckers Outdoor Corporation exhibits robust profitability with a net margin of 19.38% and a return on equity of 38.44%. The company’s return on invested capital (ROIC) stands at 30.83%, significantly exceeding its weighted average cost of capital (WACC) of 9.14%, confirming Deckers as a clear value creator. Financial health is solid, supported by a strong Altman Z-Score of 10.61, placing it well within the safe zone from bankruptcy risk. Operational efficiency is further evidenced by a favorable Piotroski score of 4 and low leverage, with a debt-to-equity ratio of 0.11.
Weaknesses and Drawbacks
Valuation presents notable concerns. The price-to-book ratio at 6.76 is very unfavorable, signaling that the stock may be trading at a significant premium to its book value. The current ratio of 3.72, while indicating liquidity, is flagged as unfavorable, possibly reflecting less efficient use of current assets. Despite a moderate price-to-earnings ratio of 17.59, the elevated valuation multiples raise caution against overpaying. Additionally, the absence of dividend yield could deter income-focused investors, limiting appeal in volatile markets.
Our Verdict about Deckers Outdoor Corporation
Deckers presents a fundamentally favorable profile, driven by strong profitability and clear value creation. Coupled with recent buyer dominance (60.01%) and an accelerating positive price trend since late 2025, the technical outlook supports cautious optimism. The stock may appear attractive for long-term exposure, yet the high price-to-book multiple and liquidity signals suggest investors might consider waiting for a more compelling entry point.
Disclaimer: This content is for informational purposes only and does not constitute financial, investment, or other professional advice. Investing in financial markets involves a significant risk of loss, and past performance is not indicative of future results.
Additional Resources
- Deckers Outdoor Corporation (DECK): A Bull Case Theory – Yahoo Finance (Feb 04, 2026)
- A Look At Deckers Outdoor (DECK) Valuation After Record Q3 Results And Higher Full Year Guidance – simplywall.st (Feb 05, 2026)
- Deckers Outdoor (DECK) Price Target Increased by 13.63% to 128.49 – Nasdaq (Feb 04, 2026)
- Deckers’s Q4 Earnings Call: Our Top 5 Analyst Questions – Finviz (Feb 05, 2026)
- Deckers Outdoor: The Reasons Why I Upgrade From Hold To Buy – Seeking Alpha (Feb 03, 2026)
For more information about Deckers Outdoor Corporation, please visit the official website: deckers.com