Home > Analyses > Healthcare > DaVita Inc.
DaVita Inc. transforms lives by delivering critical kidney dialysis services to hundreds of thousands worldwide. As a dominant force in outpatient and hospital-based dialysis, DaVita combines cutting-edge clinical care with broad geographic reach. Its reputation for innovation and comprehensive kidney care cements its leadership in a vital healthcare niche. The key question now: does DaVita’s robust network and service innovation still justify its premium valuation and growth outlook?

Table of contents
Business Model & Company Overview
DaVita Inc., founded in 1994 and headquartered in Denver, Colorado, dominates the kidney dialysis market. It operates a vast network of outpatient centers, hospital services, and clinical labs, forming an integrated kidney care ecosystem. Serving over 240K patients globally, DaVita combines patient care with disease management and clinical research, reinforcing its leadership in the medical care facilities sector.
The company’s revenue engine balances outpatient dialysis, lab testing, and risk-based integrated care across the Americas, Europe, and Asia. With 2,815 U.S. centers and 339 international sites, it delivers recurring revenue streams from high-demand, specialized services. DaVita’s extensive footprint and comprehensive care model create a durable economic moat, securing its pivotal role in advancing renal health treatment worldwide.
Financial Performance & Fundamental Metrics
I will analyze DaVita Inc.’s income statement, key financial ratios, and dividend payout policy to assess its overall financial health and shareholder value.
Income Statement
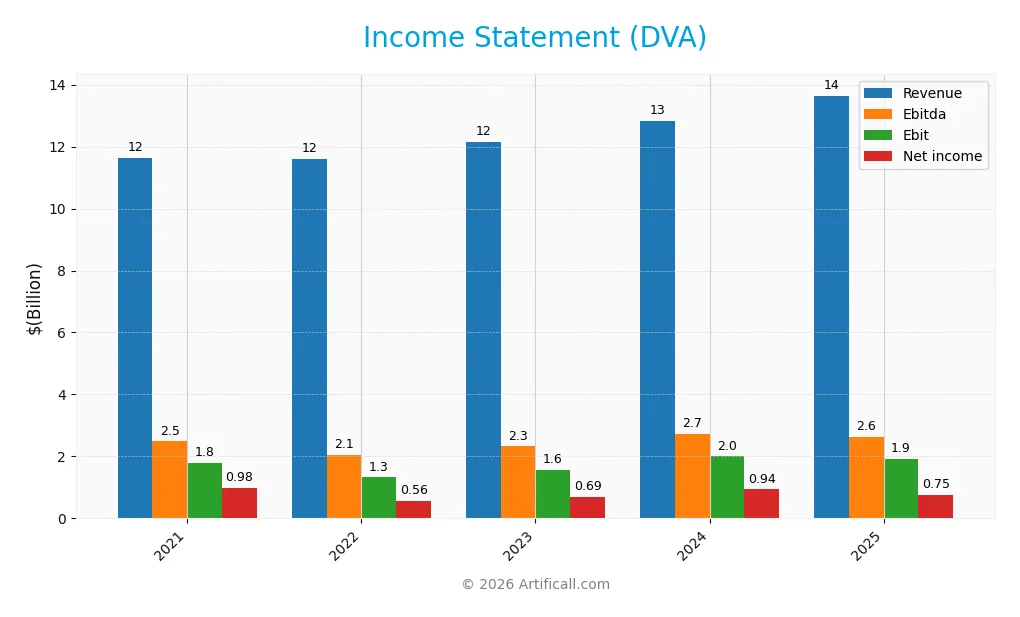
The table below summarizes DaVita Inc.’s key income statement figures for the fiscal years 2021 through 2025, expressed in USD.
| 2021 | 2022 | 2023 | 2024 | 2025 | |
|---|---|---|---|---|---|
| Revenue | 11.62B | 11.61B | 12.14B | 12.82B | 13.64B |
| Cost of Revenue | 7.97B | 8.21B | 8.32B | 8.60B | 9.96B |
| Operating Expenses | 1.85B | 2.06B | 2.22B | 2.13B | 1.67B |
| Gross Profit | 3.65B | 3.40B | 3.82B | 4.22B | 3.68B |
| EBITDA | 2.48B | 2.06B | 2.32B | 2.72B | 2.64B |
| EBIT | 1.80B | 1.32B | 1.58B | 2.00B | 1.93B |
| Interest Expense | 285M | 357M | 399M | 470M | 550M |
| Net Income | 978M | 560M | 692M | 936M | 747M |
| EPS | 9.30 | 5.88 | 7.62 | 11.02 | 10.06 |
| Filing Date | 2022-02-11 | 2023-02-22 | 2024-02-14 | 2025-02-13 | 2026-02-11 |
Income Statement Evolution
DaVita’s revenue grew 17.4% from 2021 to 2025, but net income declined 23.7% over the same period. Gross profit showed volatility, with a 12.6% drop in the latest year despite steady revenue growth. Margins weakened overall; net margin fell 35%, while EBIT margin remained relatively stable near 14%.
Is the Income Statement Favorable?
In 2025, DaVita posted $13.6B revenue, a 6.5% increase from 2024, but gross profit dropped 12.6%. Operating expenses rose proportionally, keeping EBIT near $1.9B but down 3.7% year-over-year. Net income slid 25%, reflecting higher interest costs and tax expenses. Margins remain favorable but show signs of pressure, supporting a neutral fundamental view.
Financial Ratios
The table below summarizes key financial ratios for DaVita Inc. over the last five fiscal years, providing a snapshot of profitability, liquidity, leverage, efficiency, and dividend metrics:
| Ratios | 2021 | 2022 | 2023 | 2024 | 2025 |
|---|---|---|---|---|---|
| Net Margin | 8.4% | 4.8% | 5.7% | 7.3% | 5.5% |
| ROE | 1.3% | 0.8% | 0.7% | 7.7% | -114.7% |
| ROIC | 9.4% | 7.1% | 8.8% | 11.4% | 10.6% |
| P/E | 12.2 | 12.4 | 13.8 | 13.6 | 13.1 |
| P/B | 15.8 | 9.7 | 9.0 | 105.0 | -15.0 |
| Current Ratio | 1.32 | 1.20 | 1.19 | 1.26 | 1.29 |
| Quick Ratio | 1.28 | 1.16 | 1.13 | 1.21 | 1.24 |
| D/E | 15.9 | 16.6 | 10.5 | 99.6 | -23.1 |
| Debt-to-Assets | 69.9% | 69.8% | 65.8% | 69.8% | 86.1% |
| Interest Coverage | 6.3 | 3.8 | 4.0 | 4.4 | 3.7 |
| Asset Turnover | 0.68 | 0.69 | 0.72 | 0.74 | 0.78 |
| Fixed Asset Turnover | 1.84 | 1.96 | 2.18 | 2.40 | 2.62 |
| Dividend Yield | 0% | 0% | 0% | 0% | 0% |
Evolution of Financial Ratios
From 2021 to 2025, DaVita Inc.’s Return on Equity (ROE) shifted dramatically, turning negative in 2025 after fluctuating around low single digits. The Current Ratio remained relatively stable around 1.2 to 1.3, indicating consistent liquidity. The Debt-to-Equity Ratio showed extreme volatility, swinging from highly positive to a negative value, reflecting significant leverage changes and balance sheet restructuring. Profitability margins generally declined in 2025, signaling pressure on earnings.
Are the Financial Ratios Favorable?
In 2025, DaVita’s profitability is mixed: ROE is unfavorable at -115%, while Return on Invested Capital (10.6%) exceeds the WACC (5.1%), showing effective capital deployment. Liquidity ratios like Current Ratio (1.29) and Quick Ratio (1.24) are neutral to favorable. Leverage appears risky with an 86.1% debt-to-assets ratio marked unfavorable, despite a favorable negative Debt-to-Equity ratio. Market valuations remain reasonable with a P/E of 13.1. Overall, ratios are slightly favorable but warrant caution.
Shareholder Return Policy
DaVita Inc. does not pay dividends, reflecting its strategy to reinvest earnings for growth and operational needs. The company’s dividend payout ratio and yield are zero, with no dividend per share reported in recent years.
DaVita does engage in share buybacks, suggesting a focus on capital return through stock repurchases rather than dividends. This approach aligns with sustaining long-term shareholder value, provided buybacks remain disciplined and supported by free cash flow.
Score analysis
The following radar chart illustrates DaVita Inc.’s key financial metric scores for a balanced overview:
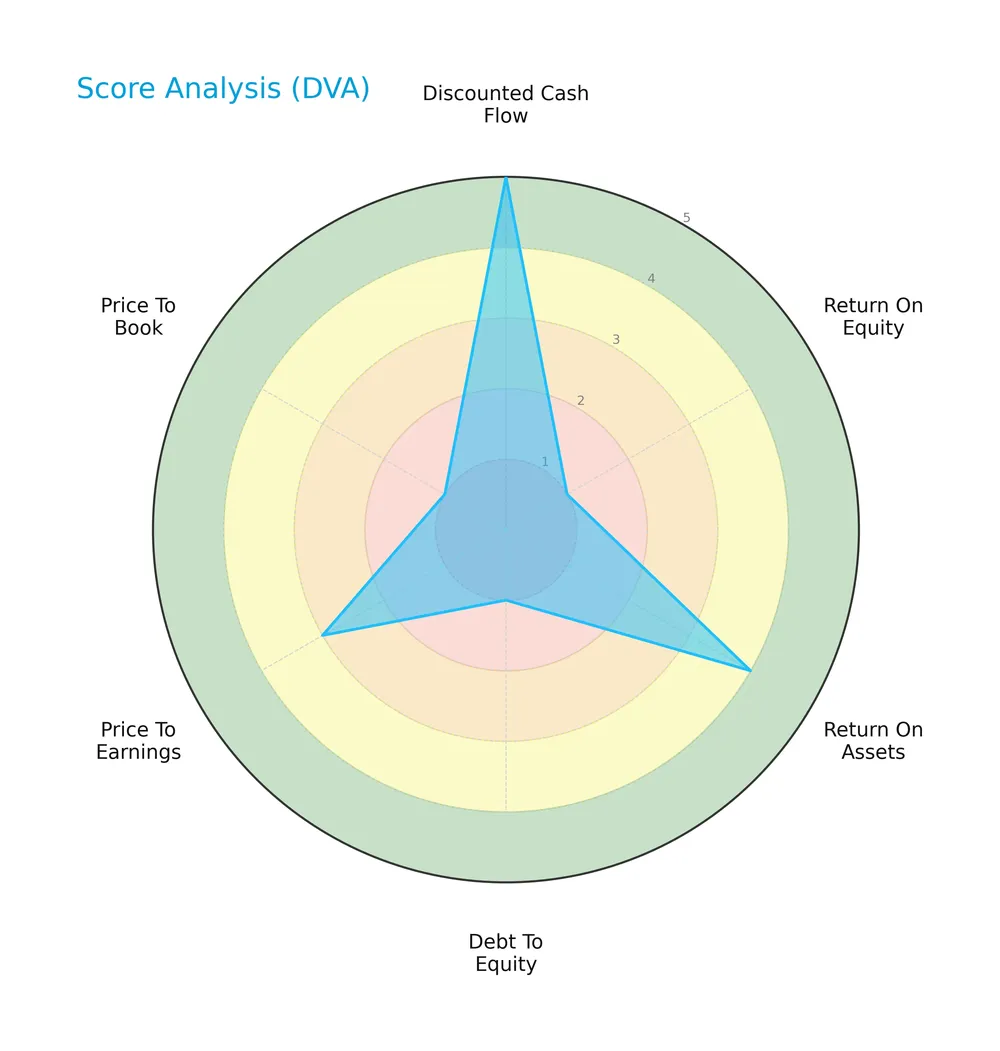
DaVita scores very favorably on discounted cash flow with a 5, indicating strong intrinsic value. However, return on equity and debt-to-equity scores are very unfavorable at 1 each, signaling profitability and leverage concerns. Return on assets is favorable at 4, while price-to-earnings is moderate at 3. Price-to-book also scores very unfavorable at 1.
Analysis of the company’s bankruptcy risk
DaVita Inc. currently resides in the distress zone with an Altman Z-Score of 1.56, highlighting a high probability of financial distress:

Is the company in good financial health?
The Piotroski Score diagram below shows DaVita’s moderate financial health with a score of 6 out of 9:

A score of 6 suggests average financial strength, indicating the company maintains reasonable profitability and efficiency but is not among the strongest performers in its sector.
Competitive Landscape & Sector Positioning
This sector analysis reviews DaVita Inc.’s strategic positioning, revenue streams, key products, and main competitors. I will assess whether DaVita holds a competitive advantage within the healthcare industry.
Strategic Positioning
DaVita Inc. focuses predominantly on U.S. dialysis and related lab services, generating over $11B in 2024. It maintains a modest diversification with “Other Segments” contributing around $1.3B. The company operates primarily in the U.S. with selective international outpatient centers.
Revenue by Segment
This pie chart illustrates DaVita Inc.’s revenue distribution by segment for the fiscal year 2024, highlighting the dominance of its core U.S. dialysis services.
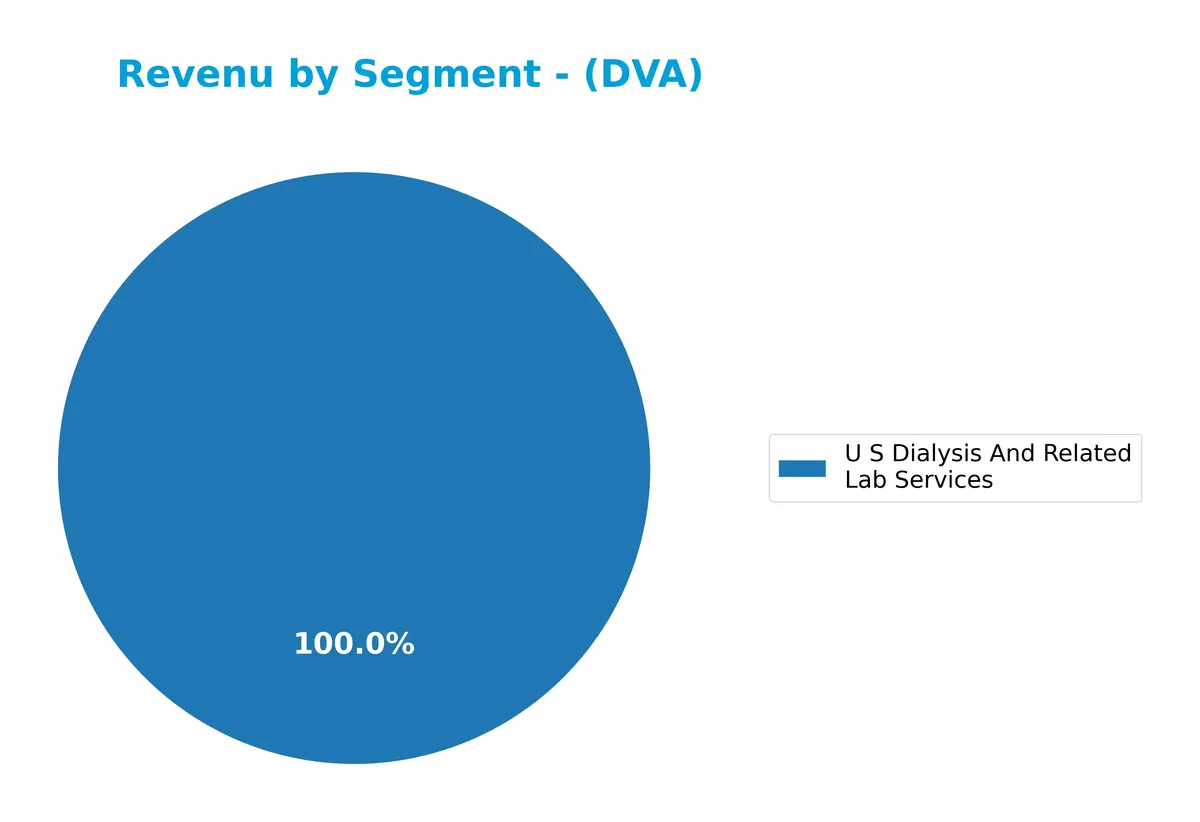
DaVita’s revenue heavily depends on U.S. Dialysis and Related Lab Services, which generated $11.3B in 2024, showing steady growth over the past decade. Other segments remain minor contributors, with no reported revenue in 2024. This concentration underscores significant dependence on the dialysis segment, reflecting both strength in specialization and potential concentration risk if regulatory or market conditions shift.
Key Products & Brands
DaVita Inc. generates revenue primarily through these key products and services:
| Product | Description |
|---|---|
| U S Dialysis And Related Lab Services | Provides kidney dialysis and related laboratory testing services, mainly in outpatient centers across the U.S. |
| Other Segments | Includes disease management, vascular access, clinical research, physician services, and international dialysis operations. |
DaVita’s core business centers on dialysis and lab services in the U.S., which consistently accounts for the vast majority of revenue. Other segments diversify its offerings with integrated care and global presence.
Main Competitors
There are 4 main competitors in the Healthcare Medical – Care Facilities sector. The table lists the top 4 leaders by market capitalization:
| Competitor | Market Cap. |
|---|---|
| HCA Healthcare, Inc. | 114B |
| Universal Health Services, Inc. | 14B |
| Solventum Corporation | 14B |
| DaVita Inc. | 8.1B |
DaVita Inc. ranks 4th among its competitors with a market cap just 8.9% of the sector leader HCA Healthcare. It sits below both the average market cap of 37.5B for the top players and the median of 13.9B. DaVita has a 34.56% market cap gap to the next competitor above, highlighting a notable scale difference.
Comparisons with competitors
Check out how we compare the company to its competitors:
Does DaVita Inc. have a competitive advantage?
DaVita Inc. demonstrates a sustainable competitive advantage, supported by a ROIC exceeding WACC by 5.47% and a growing ROIC trend. This indicates efficient capital use and consistent value creation.
Looking ahead, DaVita’s extensive outpatient dialysis network and integrated care services position it well to capitalize on expanding kidney care demands. Continued innovation in home-based dialysis and international market growth offer further opportunity.
SWOT Analysis
This analysis highlights DaVita Inc.’s key internal and external factors shaping its strategic outlook.
Strengths
- Strong market position in kidney dialysis
- Growing ROIC above WACC indicates value creation
- Broad integrated care services network
Weaknesses
- Negative return on equity signals profitability issues
- High debt-to-assets ratio raises financial risk
- Declining net margin and EPS growth
Opportunities
- Expansion in international dialysis centers
- Increasing demand for home-based dialysis
- Advancements in kidney care technology
Threats
- Regulatory changes impacting reimbursement
- Intensifying competition in outpatient services
- Economic downturn affecting healthcare spending
DaVita’s solid competitive moat and improving profitability contrast with troubling leverage and profitability trends. The company must prioritize debt reduction and margin recovery while leveraging growth in home-based care and international markets.
Stock Price Action Analysis
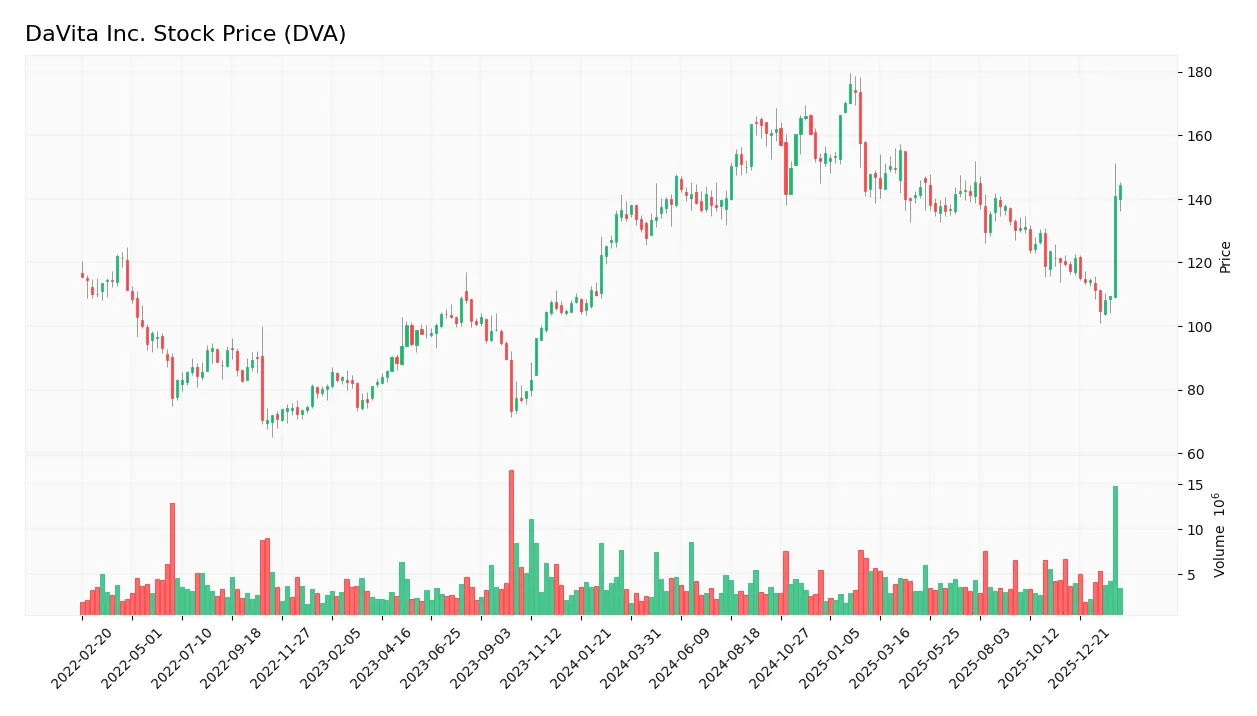
The weekly stock chart below highlights DaVita Inc.’s price movements and volatility over the past 12 months:
Trend Analysis
Over the past 12 months, DaVita Inc.’s stock price rose by 7.58%, indicating a bullish trend with clear acceleration. The price fluctuated between a low of 104.74 and a high of 176.2. Volatility remains elevated, with a standard deviation of 14.88, reflecting active market dynamics.
Volume Analysis
Trading volume over the last three months shows a slightly buyer-dominant pattern at 54.8%. However, the overall volume trend is decreasing, signaling waning market participation. This suggests cautious investor sentiment despite buyers maintaining a modest edge.
Target Prices
Analysts present a confident target consensus for DaVita Inc. based on current valuations.
| Target Low | Target High | Consensus |
|---|---|---|
| 158 | 190 | 168.67 |
The target range reflects moderate upside potential, with a consensus price suggesting steady growth aligned with sector norms.

Don’t Let Luck Decide Your Entry Point
Optimize your entry points with our advanced ProRealTime indicators. You’ll get efficient buy signals with precise price targets for maximum performance. Start outperforming now!
Analyst & Consumer Opinions
This section examines analyst ratings and consumer feedback to provide a balanced view of DaVita Inc.’s market perception.
Stock Grades
Here are the recent verified stock grades for DaVita Inc. from leading analysts and firms:
| Grading Company | Action | New Grade | Date |
|---|---|---|---|
| UBS | Maintain | Buy | 2026-02-04 |
| Barclays | Maintain | Equal Weight | 2026-02-03 |
| TD Cowen | Maintain | Hold | 2025-11-03 |
| Barclays | Maintain | Equal Weight | 2025-10-30 |
| Barclays | Maintain | Equal Weight | 2025-10-09 |
| B of A Securities | Maintain | Underperform | 2025-09-10 |
| Barclays | Maintain | Equal Weight | 2025-08-07 |
| Truist Securities | Maintain | Hold | 2025-05-19 |
| Barclays | Maintain | Equal Weight | 2025-02-18 |
| Barclays | Maintain | Equal Weight | 2024-10-31 |
Most analysts maintain a neutral stance, with Barclays consistently rating DaVita as Equal Weight. UBS stands out with a Buy grade, while B of A Securities remains cautious at Underperform. The consensus across 23 ratings is Hold, reflecting moderate investor confidence.
Consumer Opinions
DaVita Inc. sparks diverse reactions, revealing what truly resonates with its customers.
| Positive Reviews | Negative Reviews |
|---|---|
| Friendly and attentive staff | Long wait times for appointments |
| High-quality dialysis care | Occasional billing issues |
| Clean and comfortable facilities | Limited appointment availability |
| Supportive patient education programs | Communication gaps during treatment |
Overall, consumers praise DaVita’s compassionate care and facility standards. However, wait times and billing inconsistencies emerge as notable pain points, suggesting areas for operational improvement.
Risk Analysis
Below is a summary of key risks DaVita Inc. faces, categorized by likelihood and potential impact:
| Category | Description | Probability | Impact |
|---|---|---|---|
| Financial Health | Altman Z-Score at 1.56 signals distress zone; risk of bankruptcy is elevated. | High | High |
| Leverage | Debt-to-assets ratio at 86.1% is very high, increasing financial risk. | High | High |
| Profitability | Negative ROE (-114.7%) shows poor equity returns, undermining growth prospects. | Medium | Medium |
| Liquidity | Current ratio of 1.29 indicates moderate short-term liquidity buffer. | Medium | Low |
| Dividend Policy | No dividend yield may deter income-focused investors. | Low | Low |
| Market Volatility | Beta near 1 implies stock price moves with the market, exposing investors to swings. | Medium | Medium |
Leverage and bankruptcy risk stand out as the most pressing concerns. The distress-zone Altman Z-Score and heavy debt load expose DaVita to financial instability, especially if reimbursement rates or patient volumes decline. Meanwhile, the negative return on equity signals ineffective capital use. These factors warrant caution despite moderate liquidity and favorable ROIC versus WACC.
Should You Buy DaVita Inc.?
DaVita Inc. appears to have a durable competitive moat, supported by growing ROIC and value creation. Despite a manageable leverage profile, profitability metrics and equity returns suggest mixed operational efficiency. Overall, the company’s rating could be seen as B-.
Strength & Efficiency Pillars
DaVita Inc. posts a net margin of 5.47%, reflecting moderate profitability despite recent challenges. The company delivers a favorable ROIC of 10.58% against a WACC of 5.11%, clearly marking it as a value creator. This positive spread indicates efficient capital allocation and sustainable competitive advantage. Gross margin remains solid at 27.0%, supporting operational resilience. However, a negative return on equity at -114.7% signals underlying equity inefficiencies that merit caution.
Weaknesses and Drawbacks
DaVita is in financial distress, evidenced by an Altman Z-Score of 1.56, placing it in the distress zone with potential bankruptcy risk. This overshadows its operational profitability. The balance sheet shows concerns with a high debt-to-assets ratio of 86.1%, indicating heavy leverage. Although the debt-to-equity ratio appears favorable due to negative equity, this signals complex capital structure issues. Valuation metrics remain moderate, with a price-to-earnings ratio of 13.1. Market demand shows slight buyer dominance at 54.8%, offering limited near-term upside.
Our Final Verdict about DaVita Inc.
Despite operational strengths and evidence of value creation, DaVita’s solvency risk reflected in its distress-zone Altman Z-Score makes its profile highly speculative. Investors should exercise caution, as the bankruptcy risk outweighs profitability metrics. This profile might appear too risky for conservative capital, suggesting that any exposure could require a high risk tolerance and active monitoring.
Disclaimer: This content is for informational purposes only and does not constitute financial, investment, or other professional advice. Investing in financial markets involves a significant risk of loss, and past performance is not indicative of future results.
Additional Resources
- The Dialysis Renaissance: How DaVita (DVA) Conquered the GLP-1 Fear and Defined Healthcare Resilience in 2026 – FinancialContent (Feb 11, 2026)
- DaVita Inc. 4th Quarter 2025 Results – PR Newswire (Feb 02, 2026)
- Even With A 30% Surge, Cautious Investors Are Not Rewarding DaVita Inc.’s (NYSE:DVA) Performance Completely – simplywall.st (Feb 06, 2026)
- Should Value Investors Buy DaVita (DVA) Stock? – Yahoo Finance (Feb 05, 2026)
- DaVita Dipped 6% After Big Run-Up: Why Analysts See a Path to $210 in 2026 – TIKR.com (Feb 08, 2026)
For more information about DaVita Inc., please visit the official website: davita.com