Home > Analyses > Technology > Datadog, Inc.
Datadog powers the digital backbone of thousands of businesses by delivering real-time insights into complex cloud environments. Its SaaS platform seamlessly integrates infrastructure monitoring, application performance, and security, making it indispensable for developers and IT teams. Known for innovation and comprehensive observability, Datadog commands respect in the software application space. The key question now is whether its robust fundamentals can sustain growth amid evolving market pressures and valuation expectations.
Table of contents
Business Model & Company Overview
Datadog, Inc., founded in 2010 and headquartered in New York City, stands as a leader in the Software – Application sector. It delivers a unified platform that integrates monitoring and analytics for developers, IT operations, and business users. This ecosystem spans infrastructure, application performance, logs, and security monitoring, providing real-time visibility into complex technology stacks worldwide.
The company’s revenue engine blends SaaS-based recurring services with advanced analytics tools, driving growth across the Americas, Europe, and Asia. Its comprehensive platform includes user experience monitoring, cloud security, and incident management, enabling customers to optimize performance proactively. Datadog’s robust economic moat lies in its seamless integration and automation capabilities that shape the future of cloud observability.
Financial Performance & Fundamental Metrics
I analyze Datadog, Inc.’s income statement, key financial ratios, and dividend payout policy to assess its profitability, efficiency, and shareholder returns.
Income Statement
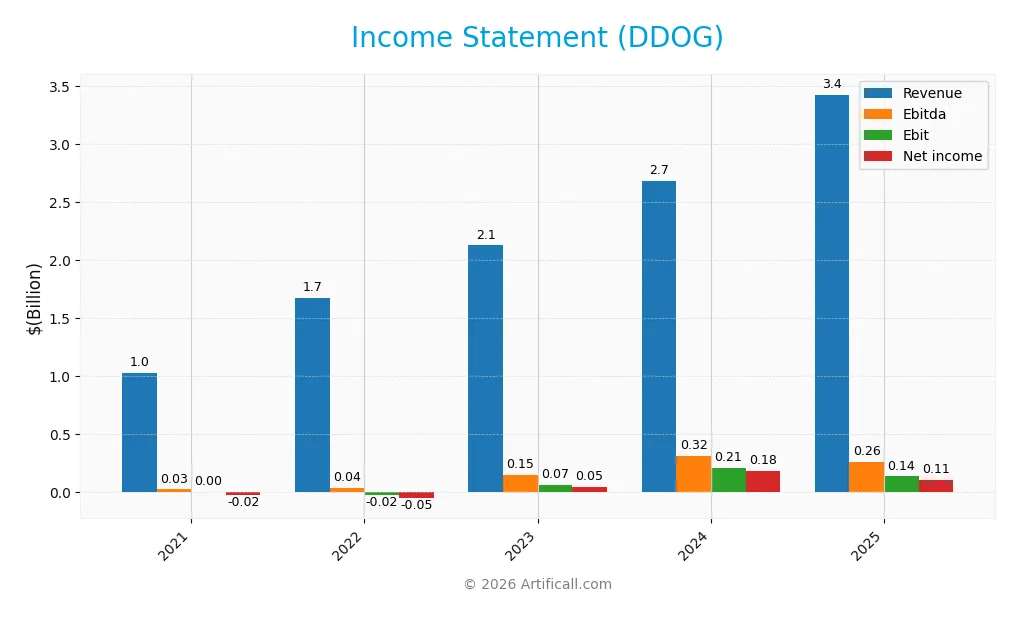
The following table presents Datadog, Inc.’s key income statement figures from 2021 to 2025, highlighting revenue, expenses, and profitability metrics.
| 2021 | 2022 | 2023 | 2024 | 2025 | |
|---|---|---|---|---|---|
| Revenue | 1.03B | 1.68B | 2.13B | 2.68B | 3.43B |
| Cost of Revenue | 235M | 348M | 411M | 516M | 687M |
| Operating Expenses | 813M | 1.39B | 1.75B | 2.11B | 2.78B |
| Gross Profit | 794M | 1.33B | 1.72B | 2.17B | 2.74B |
| EBITDA | 25.6M | 41.1M | 150.2M | 318.0M | 260.6M |
| EBIT | 2.6M | -21.5M | 66.5M | 211.0M | 138.1M |
| Interest Expense | 21.1M | 16.5M | 6.3M | 7.1M | 11.1M |
| Net Income | -20.7M | -50.2M | 48.6M | 183.7M | 107.7M |
| EPS | -0.067 | -0.16 | 0.15 | 0.55 | 0.31 |
| Filing Date | 2022-02-25 | 2023-02-24 | 2024-02-23 | 2025-02-20 | 2026-02-18 |
Income Statement Evolution
Datadog’s revenue surged 233% from 2021 to 2025, with a strong 27.7% increase in the latest year. Net income grew even faster, rising 619% over five years, though it fell 41% in 2025. Gross margin remained robust near 80%, while net and EBIT margins showed volatility, reflecting pressure on profitability despite top-line strength.
Is the Income Statement Favorable?
In 2025, revenue reached $3.43B, with gross profit at $2.74B, maintaining a high 79.96% margin. Operating expenses grew faster than revenue, contributing to a negative operating income of $44M and a 4.03% EBIT margin rated neutral. Net income was positive at $108M, but net margin declined 54% year-over-year. Overall, fundamentals appear mixed but lean toward favorable.
Financial Ratios
The following table summarizes key financial ratios for Datadog, Inc. (DDOG) over the last five fiscal years, highlighting profitability, efficiency, liquidity, leverage, and valuation metrics:
| Ratios | 2021 | 2022 | 2023 | 2024 | 2025 |
|---|---|---|---|---|---|
| Net Margin | -2.0% | -3.0% | 2.3% | 6.8% | 3.1% |
| ROE | -2.0% | -3.6% | 2.4% | 6.8% | 2.9% |
| ROIC | -1.0% | -2.6% | -0.9% | 1.1% | -0.7% |
| P/E | -2653 | -462 | 810 | 261 | 438 |
| P/B | 52.9 | 16.4 | 19.4 | 17.7 | 12.7 |
| Current Ratio | 3.54 | 3.09 | 3.17 | 2.64 | 3.38 |
| Quick Ratio | 3.54 | 3.09 | 3.17 | 2.64 | 3.38 |
| D/E | 0.78 | 0.59 | 0.45 | 0.68 | 0.41 |
| Debt-to-Assets | 34.0% | 27.9% | 22.9% | 31.8% | 23.1% |
| Interest Coverage | -0.9 | -3.5 | -5.3 | 7.7 | -4.0 |
| Asset Turnover | 0.43 | 0.56 | 0.54 | 0.46 | 0.52 |
| Fixed Asset Turnover | 7.5 | 7.9 | 7.1 | 6.7 | 6.2 |
| Dividend Yield | 0% | 0% | 0% | 0% | 0% |
Evolution of Financial Ratios
From 2021 to 2025, Datadog’s Return on Equity (ROE) showed a volatile but generally low trend, peaking in 2024 before declining sharply in 2025. The Current Ratio remained stable above 3.0, indicating consistent liquidity. Debt-to-Equity Ratio improved notably since 2021, decreasing to 0.41 in 2025. Profitability margins peaked in 2024 but deteriorated by 2025, reflecting weakening earnings quality.
Are the Financial Ratios Favorable?
In 2025, profitability ratios like net margin (3.14%) and ROE (2.89%) are unfavorable, signaling weak earnings relative to equity and sales. Liquidity appears mixed: the quick ratio is favorable at 3.38, but the current ratio status is unfavorable. Leverage ratios, including debt-to-equity (0.41) and debt-to-assets (23.1%), are favorable, indicating controlled debt levels. Efficiency metrics are mostly neutral to favorable, while valuation ratios such as price-to-earnings (438.37) and price-to-book (12.65) remain unfavorable. Overall, financial ratios suggest slightly unfavorable conditions.
Shareholder Return Policy
Datadog, Inc. does not pay dividends, reflecting its reinvestment strategy during a high-growth phase. The company maintains strong free cash flow coverage and has not engaged in share buybacks. This approach supports long-term value creation by prioritizing growth investments over immediate shareholder payouts.
Score analysis
Below is a radar chart illustrating Datadog, Inc.’s key financial scores across valuation, profitability, and leverage metrics:
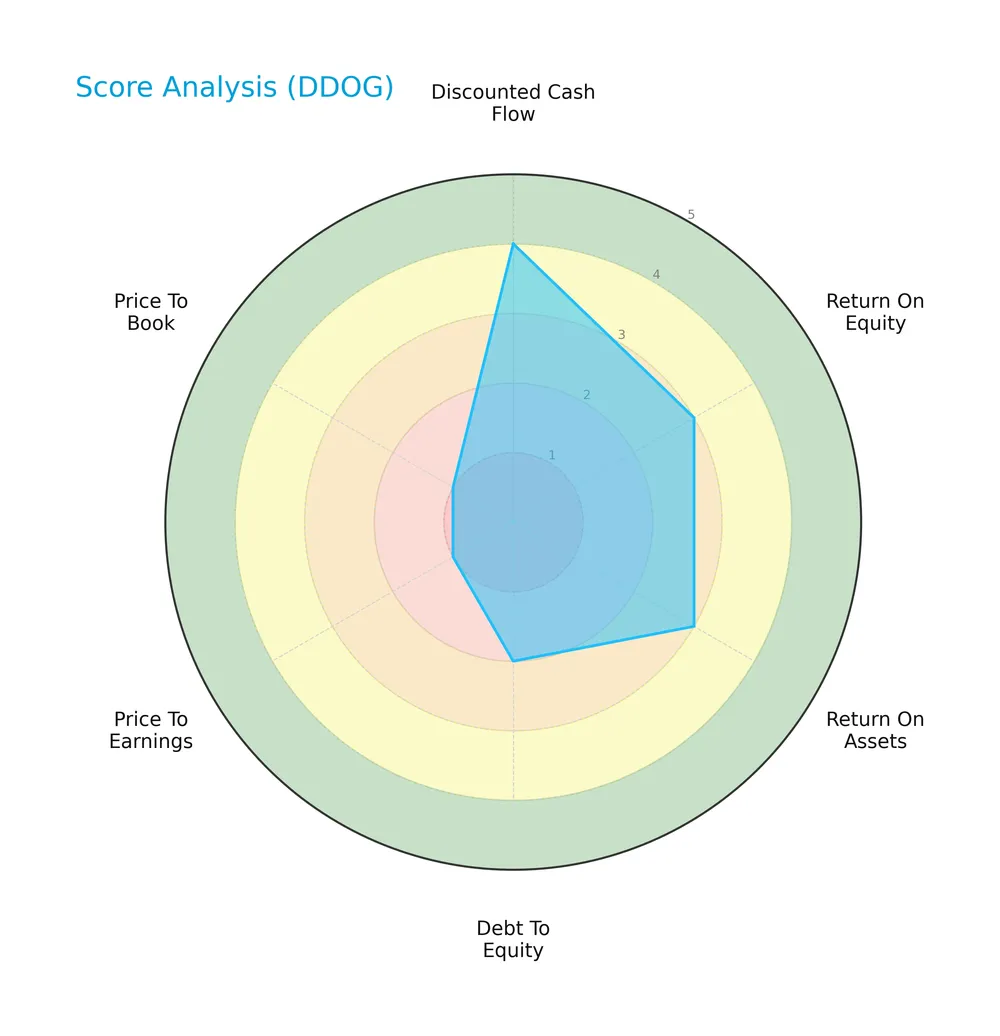
Datadog shows a favorable discounted cash flow score of 4, indicating solid intrinsic value. Profitability scores are moderate with ROE and ROA at 3 each. However, leverage and valuation metrics are weak, with debt-to-equity at 2 and both P/E and P/B scores at 1, signaling potential overvaluation and leverage concerns.
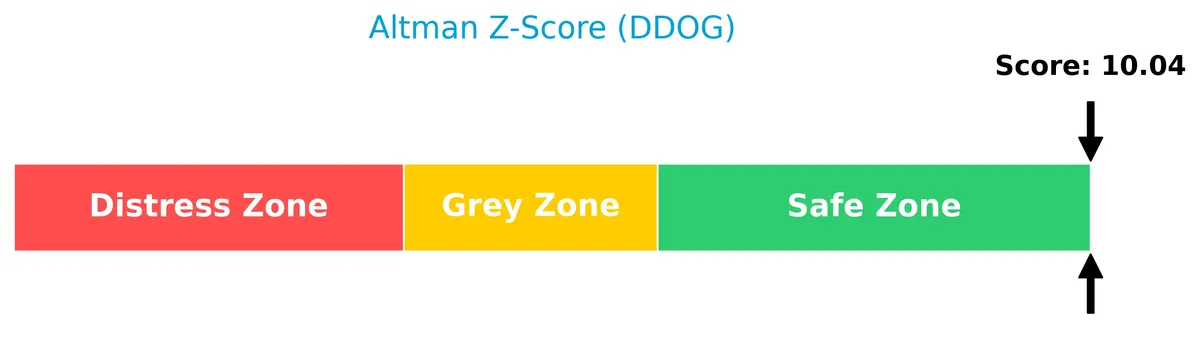
Analysis of the company’s bankruptcy risk
The Altman Z-Score places Datadog firmly in the safe zone, indicating a very low risk of bankruptcy and strong financial stability:
Is the company in good financial health?
This Piotroski diagram summarizes Datadog’s financial strength based on nine fundamental criteria:

With a Piotroski Score of 5, Datadog exhibits average financial health. The score suggests moderate operational efficiency and profitability but leaves room for improvement in overall financial robustness.
Competitive Landscape & Sector Positioning
This section analyzes Datadog, Inc.’s strategic positioning, revenue segments, key products, and main competitors within the software application sector. I will assess whether Datadog holds a competitive advantage over its peers based on these factors.
Strategic Positioning
Datadog concentrates on cloud-based monitoring software, expanding steadily from North America ($2.43B in 2025) into international markets ($994M). Its SaaS platform integrates diverse monitoring tools, signaling a focused yet gradually diversified geographic exposure within the technology sector.
Revenue by Segment
This pie chart illustrates Datadog, Inc.’s revenue distribution by segment for the most recent fiscal year, highlighting the contribution of each business unit to total sales.

Datadog’s revenue is primarily driven by its cloud monitoring and analytics services, which dominate the portfolio. The data reveals a strong concentration in core software offerings, with minimal contribution from ancillary segments. This focus reflects the company’s strategic emphasis on scalable, subscription-based revenue streams. Notably, the latest fiscal year shows either steady growth or a stable revenue mix, underscoring the resilience of its main business lines without significant diversification.
Key Products & Brands
Datadog offers a comprehensive SaaS platform integrating multiple monitoring and analytics solutions for IT and business users:
| Product | Description |
|---|---|
| Infrastructure Monitoring | Real-time tracking and automation of cloud infrastructure performance and health. |
| Application Performance Monitoring | Tools to analyze and optimize software application behavior and user experience. |
| Log Management | Collection, indexing, and analysis of log data for troubleshooting and security purposes. |
| Security Monitoring | Cloud security features including threat detection and compliance monitoring. |
| User Experience Monitoring | Insights into end-user interactions to improve application usability and performance. |
| Network Performance Monitoring | Monitoring network traffic and diagnosing connectivity issues across cloud environments. |
| Developer-Focused Observability | Specialized tools empowering developers to gain visibility into application and infrastructure. |
| Incident Management | Solutions for alerting, collaboration, and resolution of IT incidents and outages. |
| Shared Features | Dashboards, analytics, collaboration tools, and alerting capabilities common across all modules. |
Datadog’s platform unifies diverse monitoring functions into a single SaaS solution that supports cloud-native environments and enhances operational visibility.
Main Competitors
Datadog, Inc. faces competition from 33 companies, with the table below listing the top 10 leaders by market capitalization:
| Competitor | Market Cap. |
|---|---|
| Salesforce, Inc. | 242B |
| Shopify Inc. | 210B |
| AppLovin Corporation | 209B |
| Intuit Inc. | 175B |
| Uber Technologies, Inc. | 172B |
| ServiceNow, Inc. | 153B |
| Cadence Design Systems, Inc. | 84B |
| Snowflake Inc. | 73B |
| Autodesk, Inc. | 61B |
| Workday, Inc. | 55B |
Datadog ranks 11th among 33 competitors, with a market cap at 17.6% of the leader, Salesforce. It sits below the average market cap of the top 10 (143.6B) but above the sector median (18.8B). The company maintains a +28.7% gap to its nearest larger rival, reflecting a notable scale difference.
Comparisons with competitors
Check out how we compare the company to its competitors:
Does DDOG have a competitive advantage?
Datadog, Inc. currently lacks a strong competitive advantage, as its ROIC trails its WACC by over 10%, indicating value destruction despite growing profitability. The company’s gross margin near 80% signals product strength, but returns do not yet cover capital costs.
Looking ahead, Datadog’s expanding international revenue reflects successful market penetration beyond North America, presenting growth opportunities. Its integrated SaaS platform spanning monitoring and security offers scope for innovation and deeper customer adoption.
SWOT Analysis
This analysis highlights Datadog’s core competitive position and strategic challenges.
Strengths
- Strong revenue growth of 27.7% in 2025
- High gross margin near 80%
- Diverse SaaS platform with broad observability features
Weaknesses
- Negative ROIC versus WACC indicates value destruction
- High valuation metrics (PE 438x, PB 12.65x)
- Declining EBIT and net margin growth in 2025
Opportunities
- Expanding international revenue base
- Rising demand for cloud security and monitoring
- Potential to improve operational efficiency and margins
Threats
- Intense competition in cloud monitoring space
- High dependence on North American market
- Pressure on margins from rising operating expenses
Datadog’s robust growth and platform breadth underpin a strong market position. However, value destruction signals urgent capital allocation improvements. The company must leverage global expansion and operational discipline to sustain long-term profitability.
Stock Price Action Analysis
The weekly stock chart for Datadog, Inc. (DDOG) reveals recent price movements and volatility patterns over the last 12 months:
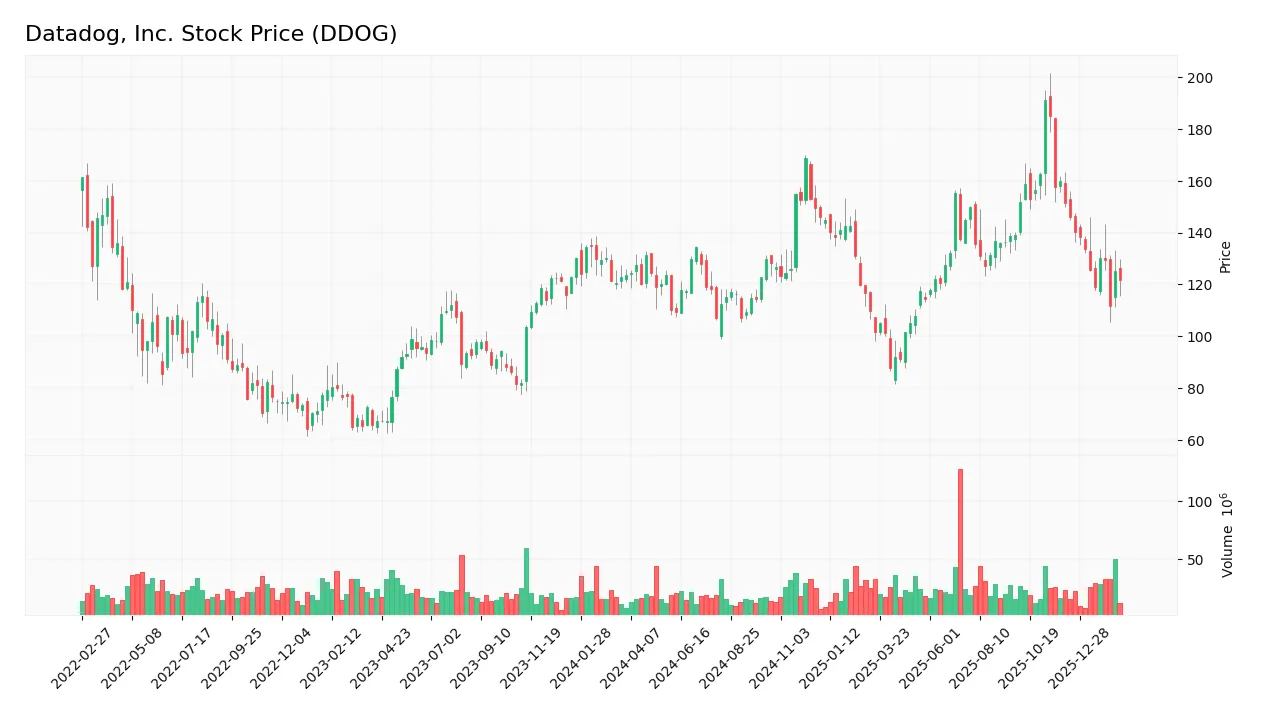
Trend Analysis
Over the past year, DDOG’s price declined by 1.47%, indicating a neutral to slight bearish trend with decelerating momentum. The stock traded between 87.93 and 191.24, showing high volatility with an 18.69 standard deviation. Recent months accelerated the decline with a 19.57% drop and slope of -2.71.
Volume Analysis
Trading volume has increased overall, totaling 2.72B shares, with sellers dominating at 53.72%. Recent three months intensified seller dominance, with buyers representing only 27.21%. This suggests cautious or negative investor sentiment, with reduced buying interest amid rising market participation.
Target Prices
Analysts present a clear consensus on Datadog, Inc.’s price targets, reflecting optimistic growth expectations.
| Target Low | Target High | Consensus |
|---|---|---|
| 105 | 215 | 175.07 |
The target range spans from 105 to 215, with a consensus near 175, indicating strong confidence in Datadog’s market potential.

Don’t Let Luck Decide Your Entry Point
Optimize your entry points with our advanced ProRealTime indicators. You’ll get efficient buy signals with precise price targets for maximum performance. Start outperforming now!
Analyst & Consumer Opinions
This section examines the latest analyst grades and consumer feedback regarding Datadog, Inc. (DDOG).
Stock Grades
Here are the most recent verified analyst grades for Datadog, Inc. across reputable firms:
| Grading Company | Action | New Grade | Date |
|---|---|---|---|
| Wedbush | Maintain | Outperform | 2026-02-13 |
| BTIG | Maintain | Buy | 2026-02-13 |
| Raymond James | Maintain | Outperform | 2026-02-11 |
| Citizens | Maintain | Market Perform | 2026-02-11 |
| Barclays | Maintain | Overweight | 2026-02-11 |
| Wedbush | Maintain | Outperform | 2026-02-11 |
| DA Davidson | Maintain | Buy | 2026-02-11 |
| Scotiabank | Maintain | Sector Outperform | 2026-02-11 |
| RBC Capital | Maintain | Outperform | 2026-02-11 |
| Macquarie | Maintain | Outperform | 2026-02-11 |
The consensus among top-tier analysts strongly favors maintaining positive ratings, predominantly Outperform and Buy. Only one firm holds a Market Perform rating, reflecting broad confidence without notable downgrades.
Consumer Opinions
Datadog, Inc. consistently earns praise for its robust monitoring solutions but faces criticism on pricing and complexity.
| Positive Reviews | Negative Reviews |
|---|---|
| “Powerful and intuitive dashboard.” | “Pricing is steep for small teams.” |
| “Excellent real-time data insights.” | “Steep learning curve for new users.” |
| “Reliable uptime and quick alerts.” | “Customer support response time varies.” |
Overall, consumers value Datadog’s reliability and data accuracy. However, many cite high costs and complexity as barriers for smaller businesses.
Risk Analysis
Below is a summary of key risks affecting Datadog, Inc., including their probability and potential impact:
| Category | Description | Probability | Impact |
|---|---|---|---|
| Valuation Risk | Extremely high P/E of 438x suggests overvaluation and correction risk. | High | High |
| Profitability Risk | Negative ROIC (-0.74%) below WACC (9.52%) signals poor capital returns. | High | High |
| Growth Risk | Slowing margins with net margin at 3.14% indicate margin pressure. | Moderate | Medium |
| Liquidity Risk | Current ratio at 3.38 is favorable but flagged unfavorable, indicating possible asset inefficiency. | Low | Low |
| Leverage Risk | Debt-to-equity at 0.41 is moderate and interest coverage strong (12.49x). | Low | Low |
| Market Risk | Beta of 1.29 implies higher sensitivity to market volatility. | Moderate | Medium |
The most pressing risks for Datadog are valuation and profitability. The sky-high P/E ratio sharply contrasts with weak return metrics, highlighting a mismatch between price and earnings quality. Despite a safe Altman Z-score, the average Piotroski score signals caution in financial strength. Investors must monitor margin trends and market volatility closely.
Should You Buy Datadog, Inc.?
Datadog appears to be improving profitability with growing ROIC but still sheds value relative to WACC, suggesting a slightly unfavorable moat. Despite manageable liquidity, its leverage profile raises concerns. The overall rating of B- reflects a very favorable yet cautious investment profile.
Strength & Efficiency Pillars
Datadog, Inc. maintains a strong operational margin profile with a gross margin of 79.96%, reflecting robust product pricing power. Despite a modest net margin of 3.14% and ROE at 2.89%, the company benefits from a safe Altman Z-Score of 10.04, signaling solid solvency. However, the negative ROIC of -0.74% versus a WACC of 9.52% reveals value destruction. While profitability is currently weak, Datadog shows improving ROIC trends, hinting at operational efficiencies gaining traction.
Weaknesses and Drawbacks
Datadog faces significant valuation risks with a sky-high P/E of 438.37 and a P/B ratio of 12.65, implying an overstretched premium that may deter value-conscious investors. The current ratio of 3.38 is marked unfavorable, suggesting potential inefficiencies in working capital management despite a strong quick ratio. Seller dominance in recent trading with only 27.21% buyer volume intensifies short-term pressure. These factors combine to create a challenging market and valuation environment.
Our Final Verdict about Datadog, Inc.
The company’s profile appears mixed. Despite a safe solvency position and improving operational metrics, the negative ROIC against WACC signals value erosion. Coupled with a bearish price trend and seller-dominant recent action, Datadog might appear speculative. Investors may consider waiting for clearer signs of fundamental and technical recovery before increasing exposure. The premium valuation and market pressure warrant caution.
Disclaimer: This content is for informational purposes only and does not constitute financial, investment, or other professional advice. Investing in financial markets involves a significant risk of loss, and past performance is not indicative of future results.
Additional Resources
- Decoding Datadog Inc (DDOG): A Strategic SWOT Insight – GuruFocus (Feb 19, 2026)
- Cantor Fitzgerald Reduces PT on Datadog, Inc. (DDOG) Stock – Yahoo Finance (Feb 17, 2026)
- Datadog (NASDAQ:DDOG) Shares Gap Down – Should You Sell? – MarketBeat (Feb 18, 2026)
- Inside Datadog’s DASH 2026: how big users keep AI systems in check – Stock Titan (Feb 18, 2026)
- Datadog slides 5.1% as investors digest guidance and ongoing OpenAI concentration risk – Quiver Quantitative (Feb 18, 2026)
For more information about Datadog, Inc., please visit the official website: datadoghq.com